 ?Mathematical formulae have been encoded as MathML and are displayed in this HTML version using MathJax in order to improve their display. Uncheck the box to turn MathJax off. This feature requires Javascript. Click on a formula to zoom.
Abstract
The growth of membrane nanotubes is crucial for intercellular communication in both normal development and pathological conditions. Therefore, identifying factors that influence their stability and formation are important for both basic research and in development of potential treatments of pathological states. Here we investigate the effect of cholera toxin B (CTB) and temperature on two pathological model systems: urothelial cell line RT4, as a model system of a benign tumor, and urothelial cell line T24, as a model system of a metastatic tumor. In particular, the number of intercellular membrane nanotubes (ICNs; ie, membrane nanotubes that bridge neighboring cells) was counted. In comparison with RT4 cells, we reveal a significantly higher number in the density of ICNs in T24 cells not derived from RT4 without treatments (P = 0.005), after 20 minutes at room temperature (P = 0.0007), and following CTB treatment (P = 0.000025). The binding of CTB to GM1–lipid complexes in membrane exvaginations or tips of membrane nanotubes may reduce the positive spontaneous (intrinsic) curvature of GM1–lipid complexes, which may lead to lipid mediated attractive interactions between CTB–GM1–lipid complexes, their aggregation and consequent formation of enlarged spherical tips of nanotubes. The binding of CTB to GM1 molecules in the outer membrane leaflet of membrane exvaginations and tips of membrane nanotubes may also increase the area difference between the two leaflets and in this way facilitate the growth of membrane nanotubes.
Introduction
Membrane nanotubes, as a novel intercellular communication mechanism, are extensively studied both structurally and functionally. They were found naturally occurring in many cell types (reviewed inCitation1–Citation5), and categorized into several types by different authors with respect to their proposed function and structural characteristics.Citation6–Citation8 The number of membrane nanotubes per cell may be affected by the cell membrane elasticity and composition, in which interacting anisotropic membrane constituents (proteins, lipids, or their complexes) could bend the cell membrane and stabilize highly curved anisotropic membrane regions.Citation9–Citation12 In particular, the clustering of anisotropic membrane constituents into lipid rafts at the outer leaflet of a cell membrane might lead to the outward bending of a membrane and to the initial growth of a membrane protrusion.Citation13
Previous X-ray crystallography studies have revealed that cholera toxin from Vibrio cholerae consist of a toxic subunit A and a nontoxic pentameric subunit B. Subunit B binds to its receptor, pentasaccharide GM1, binding one GM1 molecule per subunit B monomer, while subunit A resides upon subunit B.Citation14 After binding to GM1 molecules, which are localized in lipid rafts at the outer leaflet of the cell membrane, these complexes are internalized and transported to the endoplasmatic reticulum and Golgi apparatus. In a cholera toxin, the A subunit is cleaved at the Golgi to yield the active derivative of the cholera toxin.Citation14–Citation16 In the present study, the effects of adding the nontoxic cholera toxin B (CTB) (without the A subunit) extracellularly on the stability and growth of membrane nanotubes was being investigated in nonmalignant and malignant urothelial cancer cell lines.
We report the differences in cell shape and intercellular membrane nanotube (ICN) numbers between a nonmalignant urothelial cell line RT4 and a malignant urothelial cell line T24. The RT4 cell line derives from a transitional cell papilloma of urinary bladder, in which cells are not malignant, demonstrating growth and motility characteristics of normal epithelial cells. In contrast, T24 cells are transitional cell carcinoma of urinary bladder, wherein cells show malignant behavior, spreading and separating during cell motility. The progression from a benign cell line to a malignant cell line has been correlated with specific mutations.Citation17 Therefore, the comparison between the benign and malignant model systems reveals a continuous process, in which the observed higher number of ICNs in T24 cell lines can be considered as an increase during the development of a urothelial cancer.
CTB is a pentameric subunit of cholera toxin of Vibrio cholerae that binds specifically to the branched pentasaccharide moiety of lipid ordered domain resident entity (ganglioside GM1) on the surface of target human intestinal epithelial cells.Citation14–Citation16 Therefore, CTB in conjunction with antibodies to CTB (anti-CTB) is widely used as a marker for lipid ordered domains in cells. We suggest that the addition of CTB causes the lateral clustering of GM1 lipid rafts in the outer leaflet of a cell membrane. As a result, the membrane spontaneous curvature is locally changed, facilitating the formation of membrane protrusions in these membrane regions. The addition of anti-CTB reduces the number of membrane nanotubes, which might be due to the formation of CTB–GM1–anti-CTB protein network of nonzero shear elasticity that cannot be deformed into long tubes.Citation18
Since cell metabolism determines at least partially the growth of membrane nanotubes, a change in the temperature of the growth medium may affect the expression level of membrane nanotubes. A previous experimental study showed that temperature treatment could cause phase separation of GM1 molecules, changing the diameter of giant unilamellar vesicles (GUVs).Citation19 Therefore, it is crucial to elucidate the effects of temperature on ganglioside (eg, GM1) distributions and on the formation of membrane nanotubes.
Materials and Methods
Cell culture
Urothelial cell lines RT4 () and T24 () were cultured in a 1:1 mixture of advanced Dulbecco’s modified Eagle’s medium (Gibco, Invitrogen, Carlsbad, CA) and Ham’s F 12 (Sigma-Aldrich, St. Louis, MO), supplemented with 10% fetal calf serum (Gibco, Invitrogen), 5 μg/mL insulin, 5 μg/mL transferrin, 100 mg/mL hydrocortisone and 5 ng/mL selenite (Gibco, Invitrogen), 1800 U/mL cristacyclin (Pliva, Zagreb, Croatia), and 0.222 mg/mL streptomycine-sulfate (Fatol Arzneilmittel GmbH, Schiffweiler, Germany). Cells were incubated at 37°C in a humidified incubator in an atmosphere of 5% CO2.
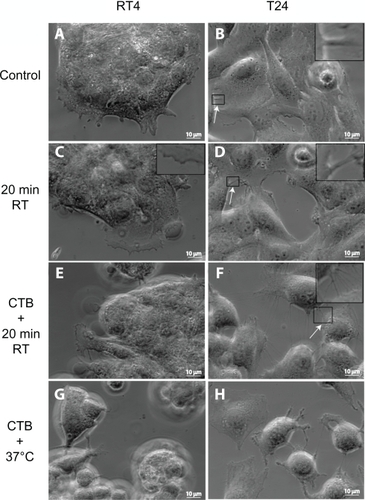
Figure 1 Phase-contrast microscope images of RT4 and T24 cells treated with either cholera toxin B (CTB) or temperature. Images of RT4 A) and T24 B) cells growing in normal conditions without any treatments (control experiments). Note that intercellular membrane nanotubes (ICNs) are not present between RT4 cells, while a few are present between T24 cells (arrow). Following their growth in normal conditions, the cells are moved to room temperature (RT) for 20 minutes, showing no significant change in the morphology of RT4 cells C), while T24 cells become more separated D). In conjunction with 20 minutes at RT, cells are treated with CTB. Note that in RT4 cells E) no ICNs are observed, while many ICNs (arrow) are present between T24 cells F). Finally, the combination of CTB and temperature incubation at 37°C induces rounding of RT4 cells and their detachment G), while T24 cells demonstrate large numbers of ICNs H).
Prior to the experiments cells were seeded onto sterile glass coverslips (Brand GmbH, Wertheim, Germany) and allowed to grow to approximately 40% to 50% and 70% to 80% confluency. T24 cell line was grown overnight and RT4 cells were left to grow for 48 to 72 hours.
Temperature dependence and CTB experiments
For controls, the growth medium was removed, and the cells were briefly washed with phosphate-buffered saline (PBS) warmed to 37°C and immediately fixed with 2% formaldehyde in PBS warmed to 37°C. A second set of cells was left in a humidified chamber at room temperature, approx. 23°C, for 20 minutes in normal growth medium. Afterwards medium was removed and cells were washed and fixed in 2% formaldehyde in PBS at room temperature for 30 minutes.
A stock solution of fluorescent CTB conjugate (component A of Vybrant Alexa Fluor 488 Lipid Raft Labeling Kit [Molecular Probes, Invitrogen, Carlsbad, CA]) was diluted to a final concentration of 4 μg/mL in PBS and added to the washed cells on glass coverslip. Cells were incubated in CTB solution for 20 minutes either at room temperature or at 37°C in humidified chamber, then washed with PBS and fixed in 2% formaldehyde in PBS for 30 minutes.
We followed the manufacturer’s protocol for labeling cells with anti-CTB antibodies. The temperature of PBS was always adapted to the temperature conditions of the experiments.
Actin labeling, immunofluorescence labeling, and microscopy
Cells treated with CTB were washed with PBS and fixed in 2% formaldehyde (Merk Schuthand, OHG, Germany) for 30 minutes (15 minutes for caspase-3 labeling). After washing with PBS, the cover slips were incubated in 0.25% Triton X-100 in PBS for 6 minutes at room temperature, washed 3 times in PBS, and incubated in 0.33 M sucrose in 0.2 M cacodylate buffer for 30 minutes. Samples were blocked in 2% bovine serum albumin (BSA; Sigma-Aldrich) in 0.2% NaN3 in PBS for 30 minutes at RT. Coverslips with cells were incubated in primary antibodies for 1 hour at 37°C or overnight at 4°C, then washed in PBS for 10 minutes and incubated in secondary antibodies for 30 minutes at 37°C. Actin labeling in 16.7 μg/mL phalloidin (phalloidin-FITC) (Sigma-Aldrich) in 20% methanol (Carlo Erba, Italy) in PBS for 30 minutes was performed after secondary antibody incubation and 10 minutes washing in PBS. Afterwards coverslips were decanted and embedded in vectashield-4′,6-diamidino-2-phenylindole (vectashield-DAPI) (Vector Laboratories, Peterborough, UK), and analyzed in a fluorescence microscope Axio-Imager Z1 microscope (Carl Zeiss Inc., USA). For active caspase-3 labeling rabbit polyclonal antibodies (AbCam Ltd, UK) were used at concentration 15 μg/mL. As secondary antibodies goat anti-mouse antibodies conjugated with tetramethylrhodamine isothiocyanate (TRITC) and the goat anti-rabbit antibodies conjugated with Alexa-Fluor® 555 (Molecular Probes, Invitrogen) were used.
Phase-contrast and fluorescence image acquisition
Cells were analyzed in a fluorescence microscope Axio-Imager Z1 microscope (Carl Zeiss Inc., New York, NY). Phase-contrast images were taken with 63× water immersion objective (numerical aperture [NA] = 0.95) and fluorescence images with Plan-Apochromat 63× (NA = 1.4, oil).
Morphometric analysis
Sampling was performed as follows: a cover glass with fixed cells was imaged with water immersion objective (63×). Images were taken at every second visual field, second horizontal, and second vertical axis. Afterwards 30 randomly chosen images were analyzed for each treatment by counting the cells and ICNs per image. Only membrane nanotubes that made contact between neighboring cells were counted as ICNs. The ICN density, ie, the number of ICNs per cell, was calculated as: ICN density = (total number of ICNs/total number of cells).
Testing for apoptosis
To assess whether exposing the cells to temperature treatment or the addition of CTB to RT4 and T24 cells induced apoptosis, cells were immunostained for active caspase-3 as a marker of apoptosis. The integrity of actin filaments was evaluated by labeling with phalloidin-fluorescein isothiocyanate (FITC) and the nucleus was labeled with DAPI.
Statistical analysis
All statistical comparisons between RT4 and T24 groups were performed using a t-test for independent samples.
Results
Control experiment
We compared two urothelial cancer cell lines: 1) the first was a nonmalignant cell line, RT4, which had a similar phenotype to normal cells; and 2) the second was a malignant cell line, T24, where cells were spread apart and showed extensive motility. The RT4 cell lines were grown in normal growth medium, and fixed with prewarmed formaldehyde (). Note that the cell islands were tightly connected to each other, and that the cells at the edge of a cell island formed short filopodia. In addition, there were few ICNs present between cells, mostly at the edges of the cell island.
The T24 cell lines were also grown in normal growth medium at 37°C and fixed with prewarmed formaldehyde (). In contrast to RT4 cells, T24 cells grew partly one on top of the other (). Cells at the middle of the cell island were tightly connected by ICNs. The number of ICNs in T24 cells highly exceeded the number of ICNs in RT4 cells ().
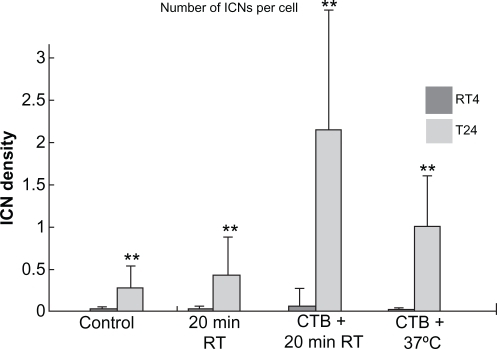
Figure 2 Summary statistics of changes in intercellular membrane nanotube (ICN) densities of treated RT4 and T24 cell lines. The control case was not treated. Note that both 20 minutes at room temperature (RT) and cholera toxin B (CTB) treatments significantly (P < 0.01**) increase the ICN density among T24 cells compared with among RT4 cells.
Note: Data are means ± standard deviation.
Incubation at room temperature for 20 minutes
Following the growth of RT4 cells in normal conditions, the change in temperature to room temperature for 20 minutes did not cause any significant change in their morphology (), while the cell edge retracted, forming a wave-like shape. In contrast, the same treatment of T24 cell lines caused a clear rounding of cells, occasionally forming ICNs between cells ().
CTB + incubation at room temperature for 20 minutes
The shape of RT4 cells did not significantly change after treatment of CTB for 20 minutes at room temperature (). The CTB-induced effects included rounding of the cell edge, formation of irregular protrusions, and formation of few ICNs. On the other hand, T24 cells became more rounded, and irregular protrusions and ICNs were formed along the edges as a result of CTB treatment (). The T24 cells were rather heterogeneous in binding CTB and their responses to it, while no such heterogeneity was observed in RT4 cells.
CTB + incubation at 37°C
In RT4 cells, CTB induced rounding of the cells and their detachment from the substratum (). The cell detachment and acquisition of spherical shape was expressed even more in T24 cells after CTB treatment at 37°C. In addition, irregular protrusions poked upward from the cell surface, while numerous ICNs connected 2 or more adjacent cells ().
Morphometric analysis
To evaluate the effect of CTB and temperature treatments in RT4 and T24 cells, the numbers of cells and of ICNs were counted in acquired images. The ICN density was calculated in each image. Summary statistics for the differences in ICN density between RT4 and T24 cells after different treatments are shown in and . Without any treatment there was a significant increase in ICN density of T24 cells compared with RT4 cells (RT4 = 0.0165 ± 0.0415; T24 = 0.2667 ± 0.3917, P < 0.01). Due to additional 20 minutes at room temperature, the ICN density was significantly greater in T24 cells (RT4 = 0.0114 ± 0.0476; T24 = 0.4157 ± 0.5483, P < 0.01), indicating the susceptibility of T24 cells to change in temperature. CTB treatment in conjunction with 20 minutes of incubation at room temperature significantly increased ICN density (RT4 = 0.0458 ± 0.2668; T24 = 2.1006 ± 2.6136, P < 0.01). In addition, the combined treatment of CTB and physiologic temperature (37°C) showed a deleterious effect on ICN numbers and cell count (RT4 = 0.0012 ± 0.0052; T24 = 0.9656 ± 0.6665, P < 0.01), which was due to cell damage and not apoptosis ().
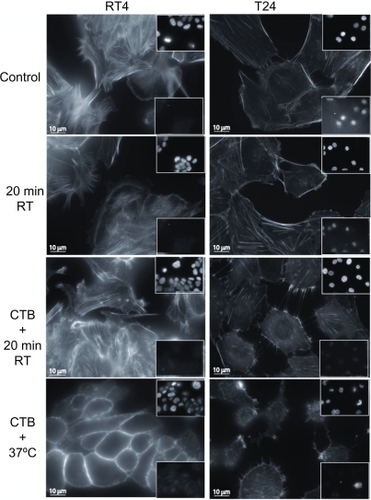
Figure 3 Cell testing for apoptosis using actin filament and nucleus fluorescence markers. To assess whether exposing cells to an ambient temperature or addition of cholera toxin B (CTB) to RT4 and T24 cells induced apoptosis, cells are immunostained for the integrity labeling of actin filaments with phalloidin-fluorescein isothiocyanate, the integrity of the nucleus with vectashield-4′,6-diamidino-2-phenylindole (top insets), and the integrity of the cells using caspase-3 (bottom insets). Note that neither temperature nor CTB treatments trigger apoptosis in RT4 and T24 cells. However, CTB does cause cell damage in some cells, mostly at 37°C.
Testing for apoptosis
To assess whether exposing RT4 and T24 cells to temperature treatment or whether the addition of CTB induced apoptosis, cells were immunostained for active caspase-3. As a marker for cell shape and integrity labeling of actin filaments, phalloidin-FITC was added, and as a marker for the nucleus, DAPI was used (). Lowering the temperature to room temperature did not trigger apoptosis at the given experimental conditions in RT4 or T24 cells, whereas CTB did cause cell damage in some T24 cells treated with CTB at 37°C ().
Reversing the induced growth of membrane nanotubes
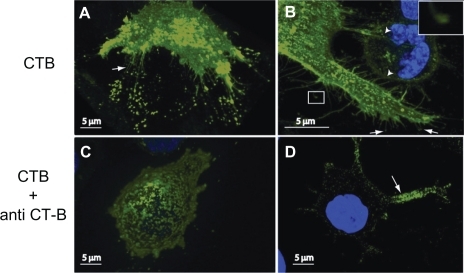
Binding of CTB to the cell membrane of RT4 () and T24 () induced growth of thin specific membrane nanotubes with semivesicular structures at the ends of the tips attached to the substratum (arrows). Moreover, some of the induced membrane nanotubes made contact with a neighboring cell (; arrowheads). Staining of the cell membrane was more or less uniform. Subsequently, binding of anti-CTB almost entirely abolished tubulation of the membrane, leading to patchy staining of the membrane (). Anti-CTB (pentameric antibodies) might cross-link (intercalate) CTB units, facilitating phase separation of lipids and proteins into more stiff microdomains with nonzero shear elastic modulus, which do not allow the growth of membrane nanotubes in RT4 (4B), and T24 cells (4D).
Figure 4 Reversing the induced growth of membrane nanotubes by the addition of anti-cholera toxin B (CTB). The addition of CTB to RT4 A) and T24 B) cells reveals the growth of membrane nanotubes (arrows), as well as membrane lipid rafts (marked by fluorescent CTB–GM1 complexes) at the tips and entire length of membrane nanotubes. Note that some membrane nanotubes (ICNs) make contact with a neighboring T24 cell (b; arrowheads), and the presence of a microvesicular structure at the tip of membrane nanotubes (close up view). The addition of anti-CTB causes the retraction of membrane nanotubes in both RT4 C) and T24 D) cells.
Possible mechanisms for CTB-facilitated membrane nanotube formation
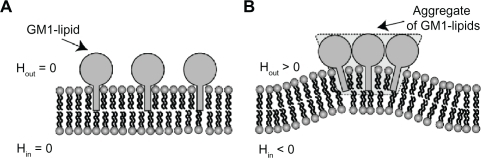
To explain the induced growth of membrane nanotubes with semivesicular structures at their tip following the addition of CTB, we propose that the binding of CTB to GM1–lipid membrane complexes at the outer leaflet of the cell membrane increases the local area difference between the two leaflets. The formation of GM1–lipid complexes at the tip of membrane nanotubes may affect the membrane curvature. The initial aggregation of GM1 molecules may contribute to the formation of a membrane protrusion of positive curvature (). The accumulation of a few aggregates may further bend the membrane, contributing an additional protrusive force. On the other hand, the addition of flat CTB and the formation of less curved CTB–GM1 nanodomains would reduce the spontaneous curvature of the tip region of the nanotubes, explaining the observed vesicular region at the tips of membrane nanotubes ().
Figure 5 Schematic diagram for the effects of GM1 interaction on membrane curvature. Single GM1 molecules have zero intrinsic (spontaneous) curvature A). Small membrane protrusions are formed due to the interaction between GM1 molecules, where it is assumed that small GM1 aggregates have positive intrinsic curvature B).Citation27,Citation28 Hout and Hin are the mean curvature of the outer and inner cell membrane leaflets, respectively.
The model
To test the hypothesis that the initial formation of a membrane nanotube is driven by the aggregation of CTB–GM1 complexes (), we constructed a model to study the effects of strong binding of CTB to GM1 molecules. The purpose of our model is to test whether the positive spontaneous curvature of CTB–GM1 complexes and the strong binding of GM1s to CTB are sufficient to drive a membrane instability causing the growth and coalescence of membrane protrusions ().
This model was based on our previous model, in which the membrane curvature was coupled to spontaneous curvature of membrane inclusions.Citation20–Citation22 According to the radius of curvature at the tip of membrane nanotubes, the spontaneous curvature of CTB–GM1 complexes was approximated by a positive value of 5 μm−1. The underlying assumption of the present model was that membrane inclusions, ie, CTB–GM1 complexes, contributed negative binding (interaction) energy (−αn). For the sake of simplicity, the modeled membrane contour of RT4 or T24 cells was considered to be nearly flat. The free energy of the model was:
The first term describes the bending energy due to the mismatch between the membrane curvature and the spontaneous curvature of the CTB–GM1 complex. The second term describes the effective membrane surface tension and the binding energy between CTB–GM1 complexes. The third term describes an external trapping of the membrane, which can be represented as the force of the cytoskeleton inside the cell. The fourth term gives the entropic contribution due to the lateral thermal motion of CTB–GM1 complexes in the membrane in the limit of small n. The fifth term describes the nearest neighbor attractive interactions between CTB and GM1, and the sixth term prevents the sharp changes in the CTB–GM1 density. The derivation leading to EquationEq. (1)(2) is a one-dimensional version of the more general expressions derived in previous studies.Citation23,Citation24 These expressions recover the familiar form for small undulations of a flat membrane in the Monge gauge form. See the supplementary material for the membrane contour forces and fluxes derived from the derivation of the free energy as well as the list of parameter values incorporated in our model.
Results of our numerical simulations revealed that the coupling between the CTB–GM1 density and the membrane curvature led to the formation of membrane protrusions, which coalesced into a larger membrane protrusion (). shows how the initial straight membrane contour evolves from a multiprotrusion shape (dotted line) at intermediate time to a coalesced membrane protrusion (solid line) at steady state (). Furthermore, the CTB–GM1 density distribution demonstrates a similar evolution to the one observed in the membrane shape dynamics ().
Figure 6 The effects of cholera toxin B (CTB) binding to GM1 molecules on membrane shape and filament densities. A) The schematic model is a nearly straight membrane contour, which describes a segment of an RT4 or T24 cell. Numerical simulations of the flat shape membrane reveal the steady state shapes of membrane amplitudes B) and CTB–GM1 densities C), given that α = 0.013 and H̄ = 5 μm−1 (see Supplementary material for more information). The amplitude h(x) is the value of the membrane deformation. The initial condition is a flat membrane with a random perturbation of small amplitudes (<1%) in the CTB–GM1 density around the uniform value of n0 = 0.1. The intermediate time (in dotted line) is after 400 seconds, and the steady state time (in bold line) is reached within 600 seconds.
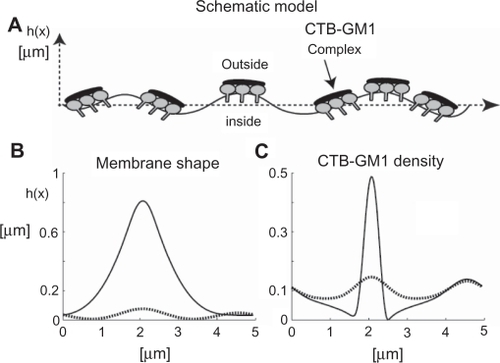
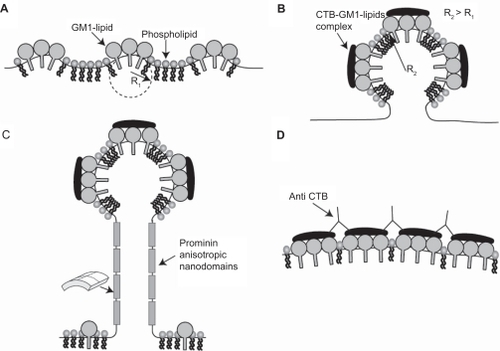
Figure 7 The effects of cholera toxin B (CTB) and prominins on the initial formation and stability of membrane nanotubes. Due to positive spontaneous curvature of GM1 aggregates (see ), such small GM1 aggregates would sense and stabilize small membrane protrusions A). The binding of each CTB molecule to a few GM1 aggregates would lead to the aggregation of CTB–GM1 complexes, thereby driving the coalescence of small membrane protrusions into a large spherical protrusion B). Due to flat shape of CTB it is assumed that bound CTB reduces the spontaneous curvature of GM1 aggregates. The neck region of the membrane protrusion attracts anisotropic membrane nanodomains such as prominins, which facilitate and stabilize the growth of membrane nanotubes C). The addition of anti-CTB (pentameric antibodies) may cross-link (intercalate) CTB units, thereby leading to the formation of stiff microdomains that do not allow the growing of membrane nanotubes D).
Discussion
Numerous studies have revealed the growth of membrane nanotubes in different cell types under normal and pathological states.Citation1–Citation8 In particular, previously it has been shown that ICNs that connect between neighboring cells are frequently observed in malignant (transformed) cancer cell lines (T24) of urothelial origin.Citation4,Citation8 So far, the comparison of ICN density between nonmalignant and malignant cancer cell lines was not investigated. We here report the differences in cell shape and ICN density between nonmalignant (RT4) and malignant (T24) urothelial cell lines not only in normal conditions, but also during the application of CTB and temperature (). Statistical analyses reveal that the ICN density in T24 cells is significantly increased compared with RT4 cells in normal conditions (RT4 = 0.0165 ± 0.0415; T24 = 0.2667 ± 0.3917, P < 0.01). Furthermore, significant increases in ICN densities were observed during CTB treatment at physiologic temperature (RT4 = 0.0012 ± 0.0052; T24 = 0.9656 ± 0.6665, P < 0.01), and during CTB treatment at room temperature (RT4 = 0.0114 ± 0.0476; T24 = 0.4157 ± 0.5483, P < 0.01) (, ). In addition, T24 cells are of irregular shapes and separated, which makes them morphologically different from the benign phenotype of RT4 cells, which are firmly bound to each other (). Testing for cell apoptosis using fluorescence markers for actin filaments and the nucleus demonstrated that neither lowering the temperature nor the addition of CTB triggered apoptosis in RT4 or T24 cells (). In addition, the induced growth of membrane nanotubes can be reversed or prevented by the application of CTB antibodies (anti-CTB) ().
Table 1 Statistical data on the density of ICNs for the different treatments in RT4 and T24 cells
Based on the experiment data, we discuss the following hypotheses. Firstly, the observed increases in ICN densities during the transformation from benign to malignant urothelial cells could be concomitant with increases in the membrane densities of GM1 and cholesterol molecules. Secondly, based on structure data of CTB-GM1 complexes and insight from the theory of membrane elasticity,Citation14,Citation15,Citation24 we suggest that the binding of CTB to GM1s reduces the spontaneous curvature of GM1 aggregates, explaining the observed increased diameter of the tip region of membrane nanotubes (). Thirdly, the clustering of GM1 molecules by CTB causes the formation of isotropic nanodomains at the outer leaflet of cell membranes, facilitating the growth of spherical membrane exvaginations ().
In previous studies, the effects of adding CTB were investigated using GUVs.Citation25,Citation26 Since the radius of GUVs is between 20 and 30 μm, the membrane is practically flat compared with the radius of curvature at the tip of membrane nanotubes. It has been shown that the addition of CTB to GUVs induced invagination, where CTB–GM1 complexes may stabilize a negative membrane curvature.Citation25,Citation26 These results are in agreement with those of the present study, in which the addition of CTB reduced the membrane curvature, forming a spherical tip in membrane nanotubes. The underlying mechanism is due to the flat crystal structure of CTB,Citation14 whereby binding to more than 1 GM1 molecule reduces the spontaneous curvature of a GM1 aggregate ().
Gangliosides such as GM1s are pentasaccharides of strong hydrophilic character,Citation27 which are docked into the outer leaflet of cell membranes by a ceramide hydrophobic moiety. It has been shown that GM1 pentasaccharides are aggregated at the highly curved edges of caveolae, where the large positive curvature is stabilized by hydrogen bonds between the sugar moieties of neighboring GM1s.Citation27 In another study, cholera toxin (CT) and Shiga toxins have been implicated in the formation of invaginations,Citation25,Citation26 where it has been suggested that the positive curvature at the neck region of caveolae is stabilized by the aggregation of GM1s.Citation25 Previous theoretical analyses demonstrated that the curvature of small nanodomains is changed when gangliosides with bulky headgroups such as GM1s come together, which is driven by the increased number of hydrogen bonds between neighboring sugar moieties.Citation27,Citation28 Accordingly, we propose that the aggregation of GM1 molecules may generate the positive membrane curvature mediating the initial growth of membrane nanotubes ( and ). Consequently, alterations in the amounts of GM1s in T24 malignant cancer cell lines may account for the observed increases of ICN densities compared with RT4 benign cancer cell lines ( and ).
To shed light on the mechanisms by which CTB facilitates the formation of membrane nanotubes, the model employed in the present study has shown that CTB could have a role in the initial growth of membrane nanotubes (). In particular, the binding of more than 1 GM1 molecule by CTB brings GM1s into close contact, facilitating the coalescence of small membrane protrusions into a single larger membrane protrusion (). The resulting negative interaction energy between neighboring GM1s complexes may counterbalance the loss of configurational entropy during the process of lateral sorting of GM1s, driving the initial dynamical instability.Citation10,Citation20,Citation22 From the crystal structure of CTB,Citation14 it is possible to conclude that the native CTB has a flat shape. Consequently, the spontaneous curvature of CTB–GM1 complexes is less positive than the spontaneous curvature of pure GM1 complexes (). The present dynamic model shows that a positive spontaneous curvature of CTB–GM1 could drive a positive feedback loop in which the aggregation of CTB–GM1 complexes would not only bend the membrane but also lead to further attraction of CTB–GM1 complexes. This relationship is evident from the mirror image of CTB–GM1 densities and membrane amplitude distributions ().
The growth of long membrane protrusions is not favorable for the Helfrich bending energy along anisotropic nanotubular regions. It has been demonstrated that the mild depletion of cholesterol and the degradation of actin filaments do not impair the stability of nanotubular structures.Citation8,Citation10 This stability could be due to prominin anisotropic nandomains along the tubular regions of membrane nanotubes (). Prominins may also reduce the anisotropic membrane bending energy, facilitating the growth of membrane nanotubes.Citation5,Citation8,Citation10
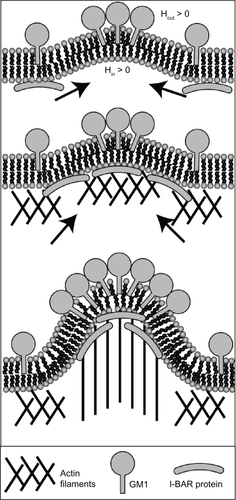
Besides the curvature-generation mechanism of GM1s initiating the formation of membrane nanotubes, GM1s may also have an indirect effect through the recruitment of I-BAR domain proteins attached to the inner membrane surface (). Previous studies have shown that I-BAR domain proteins, bound to the inner leaflet, can generate a negative membrane curvature and mediate the actin nucleation machinery.Citation29–Citation31 In contrast, at the outer leaflet the same membrane curvature is considered to be positive rather than negative (). Therefore, the induced negative curvature by aggregates of GM1s could lead to the recruitment of I-BAR domain proteins (). To conclude, the outward membrane bending during the initial growth of a membrane nanotube may be generated by GM1s and I-BARs at the outer and inner leaflets of cell membranes, respectively. Further, the attached I-BAR proteins may induce actin self-assembly and in this way promote the elongation of membrane nanotubes ().Citation32
Figure 8 Schematic diagram for the recruitment of I-BAR domain proteins and actin filaments by GM1 aggregates. The positive and negative curvatures at the outer and inner leaflets are induced by a GM1 aggregate. Consequently, I-BAR domain proteins are attracted to the negative curvature at the inner leaflet of a cell membrane. The I-BAR domain proteins would further bend the membrane, while activating the actin nucleation machinery. The nucleation of actin filaments would drive a membrane protrusive growth, elongating the membrane protrusion.
While the addition of CTB in conjunction with anti-CTB is widely used as a marker for lipid ordered domains in cells,Citation14,Citation15 the functional effects of formed microdomains of GM1s, CTB, and anti-CTB are not clear. We here suggest that anti-CTB binds more than one CTB molecule, thereby forming membrane microdomains or protein networks, which not only increase the membrane bending rigidity but also the membrane shear modulus ().Citation18,Citation33 As a result, the bound network of CTB molecules at the membrane would prevent the formation of new membrane nanotubes as well as destabilize those already formed.
In the present study, it was also revealed that lowering the temperature of the medium may cause the retraction of ICNs in T24 cells (). The effects of temperature in RT4 cells are not as clear, since the corresponding changes in ICN densities due to temperature change are not significant. The possible explanation for temperature-dependent changes in T24 cells is that a temperature change in the growth medium may alter the cell metabolism mediating the mechanisms responsible for the growth of membrane nanotubes. In addition, the temperature treatment may reduce or increase the fluidity of the membrane to a level that is not optimal for the binding of membrane proteins at the highly curved regions of ICNs. In addition, the application of temperature (eg, cooling to room temperature) might cause the excessive internalization of CTB–GM1 complexes, leading to the depletion of GM1 molecules from the outer leaflet of the cell membrane.
Lipid rafts are suggested to be detergent-resistant microdomains that are enriched with cholesterol and glycosphingolipids (eg, GM1) molecules. Various enzymes and membrane receptors, crucial for intracellular signaling and cell survival, are also found in lipid rafts. Previously, it has been demonstrated that malignant cancer cells have high cholesterol content in their cell membranes, leading to increased densities of lipid rafts.Citation34 Furthermore, the depletion of cholesterol levels in malignant cancer cells did cause their eventual cell death, while the other noncancer cells were less sensitive to cholesterol depletion.Citation34 Accordingly, malignant cancer cells were shown to be more sensitive to raft binding toxins, suggesting the development of novel therapeutic drugs that target the organization of lipid rafts.Citation34,Citation35 The results of the present study indicate that the high fluorescence label at the tip of membrane nanotubes may demonstrate the accumulation of lipid rafts. Thus, it remains to be elucidated whether the cholesterol and GM1 cell contents, which are important constituents of lipid rafts in urothelial cancer cells, are greater than those of their normal counterparts. Finally, due to the high content of lipid rafts in prostate and breast cancer cells,Citation36,Citation37 the membrane composition and spatial organization of membrane constituents within lipid rafts might also be altered.
According to X-ray crystallography structures of CT bound to GM1 pentasacharide, only the B subunits bind the GM1 molecules, while the A subunit is important for the toxicity of the CT.Citation14,Citation15 Nonetheless, the endocytosis of CTB–GM1 membrane complexes and their further transport towards the endoplasmatic reticulum might cause the reorganization of the actin cytoskeleton, leading to cell damage.Citation15 Using actin filament fluorescence markers (phalloidin-FITC), the present study has revealed the integrity of actin filaments, indicating that the CTB–GM1 complexes are probably not internalized at room temperature (). In contrast, the addition of CTB at physiologic temperature does show reorganization of the actin cytoskeleton, which might be due to enhanced internalization of CTB–GM1 complexes.
The experimental results and theoretical discussion of the present study set the stage for future experiments that could test the biophysical mechanisms responsible for the observed alterations in the frequency of ICNs in RT4 and T24 cancer cell lines. Experiments can be designed to reveal changes in the distribution of membrane constituents and to evaluate the efficacy of lipid raft toxins in normal and cancer cells. In particular, there could be a difference in the numbers of GM1 rafts between RT4 and T24 urothelial cancer cells, explaining the CTB-dependent increases in the densities of membrane nanotubes. To conclude, the relationship between the formation of membrane nanotubes and malignancy of the cell could be important not only for the basic knowledge of cellular function but also the development of therapeutic technology for cancer treatment in the next generation.
Acknowledgements
This work was supported by ARRS grants J3-9219-0381 and P2-0232-1538.
The authors are grateful to Henry Hägerstrand and Nir Gov for useful discussions.
Supplementary material
The model
To test the hypothesis that the initial formation of a membrane nanotube is driven by the aggregation of CTB–GM1 complexes, we constructed a model to study the effects of strong binding of CTB to GM1 molecules. The model is an extension of previous theoretical work,Citation20,Citation22 and the present aim is to test whether the less positive spontaneous curvature of CTB–GM1 complexes as well as the strong binding of CTB are sufficient to drive an instability causing the growth and coalescence of membrane protrusions.
Our model is a coarse-grained model, whereby we do not describe the detail of the molecular-scale level. The minimal length-scale along the membrane that is relevant to this model is of the order of 100 nm. The model is written as a set of equations of motion for the continuum fields that describe the membrane shape and density of CTB–GM1 complexes, including the actual forces acting on the membrane, and the details of the membrane elasticity. For the sake of simplicity, the modeled membrane contour of RT4 or T24 cells is considered to be nearly flat. The bending energy part of the free energy of the model is based on the Helfrich energy form.Citation24 The free energy expression includes also the CTB–GM1 binding, configurational entropy, and direct-interaction energy:
The first term gives the bending energy due to the mismatch between the membrane curvature and the spontaneous curvature of a CTB–GM1 complex. The term −αn describes the negative adhesion energy between CTB and GM1s. The third term describes an external trapping of the membrane, which can be represented as the force of the cytoskeleton. The fourth term gives the entropic contribution due to the lateral thermal motion of the CTB–GM1 in the membrane in the limit of small n. The fifth term describes the nearest-neighbor attractive interactions between CTB and GM1s, and the sixth term prevents the sharp jumps in n.
Derivation of the curvature force on the membrane
We derive the equations of motions of the membrane contour using the derivation of the free energy [EquationEq. (1)(1) ] with respect to the membrane coordinate and CTB–GM1 concentration.Citation21 To take into account the drag due to viscous forces, we assume for simplicity only local friction forces,Citation20,Citation21 with coefficient ξ.
The equation of motion of the membrane is
We next derive the forces at the membrane, by treating it as a “one-dimensional membrane”, ie, a thin strip of width w, with a bending modulus and tension coefficient. The free energy of this membrane is given in EquationEq. (1)(1) , and is used to derive the local restoring forces by the usual derivation method. Since the overall contour length is not constant in our system, the derivation of the coordinates has to be taken with respect to their absolute index u along the contour, which is constant. In these terms the curvature H appearing in the Helfrich part of the free energyCitation24 is written as (standard differential geometry)
The resulting equations of motion from this derivation gives very long expressions, which are not amenable to easy analysis, although they can be used for the numerical simulations. In order to arrive at simpler expressions we will develop the terms in EquationEq. (5)(5) , and simplify at the end by assuming that the arc-length separation between the nodes along the contour are all the same. This is maintained as the simulation progresses by using the spline routine to rediscretize evenly the contour as its length evolves.
The first term on the r.h.s. of EquationEq. (5)(5) is
The second term on the right hand side of EquationEq. (5)(5) is
We now write H in terms of s as: H = H⃗ · n̂ = −x″ y′ + y″ x′, where: H⃗ = x″ x̂ + y″ ŷ, and n̂ = −y′ x̂ + x′ ŷ so that
There is another force contribution from the membrane tension, giving a term of the form: Fx ∝ ⋅x″, so in the normal direction we get: Fn = ⋅σ(−y′ x″ + x′ y″) = ⋅σH, where we used the identity: x′2 + y′2 = 1 and therefore: 2(2(x′x″ + y′y″) = ∂(x′2 + y′2)/∂s = 0.
Putting everything together, the normal force acting on the membrane due to curvature and tension is
We need forces per unit length, whereas we calculated above the forces per unit u, so we divide by ⋅ and finally get
CTB–GM1s with spontaneous curvature
When there are CTB–GM1s with spontaneous curvature, the free energy.
(EquationEq. (4)(4) ) changes to
The new contributions to the forces acting on the membrane are (normal force per unit length)
Fluxes and diffusion of CTB–GM1s
The conservation equation for the CTB–GM1s along the contour becomes
If the number of CTB–GM1s is conserved, even though we allow the membrane overall length to change, then EquationEq. (19)(19) is correct. If however there is a reservoir of membrane that allows it to change in length, then this membrane can include lipids and CTB–GM1s, so that the total number of CTB–GM1s is not conserved when the membrane length changes. In this case the change in the density due to length changes is removed, as it is assumed to be balanced by the currents into/out of the reservoir. EquationEq. (19)
(19) is then modified by removing the second term on the left hand side.
In our calculations, a nonlinear tension was employed, and as a result, the length of each membrane segment changed very little, so the second term on the left hand side of EquationEq. (19)(19) was neglected.
Numerical realization of the model
Discretization of the model
Since the flat shape model represents a segment of the whole cell, we used periodic boundary conditions. Thus, the number of grid points N equals the number of discretizations. In our model, the density n of element i is given by:
The boundary conditions
We employed periodic boundary conditions. The first and second derivatives of the function along the x direction were calculated using the following explicit Euler method:
The derivation of the free energy equation
The derivation of the free energy is projected to give the forces normal to the membrane contour.Citation21 We now list the forces derived from the derivation of the free energy [EquationEq. (1)(1) ]Citation21
We now calculate the dynamics of the CTB–GM1 density, using the following conservation equation
Disclosure
The authors disclose no conflicts of interest.
References
- GerdesHCarvalhoRIntercellular transfer mediated by tunneling nanotubesCurr Opin Cell Biol20082047047518456488
- GürkeSBarrosoJGerdesHThe art of cellular communication: tunneling nanotubes bridge the divideHistochem Cell Biol200812953955018386044
- ShererNMothesWCytonemes and tunneling nanotubules in cell-cell communication and viral pathogenesisTrends Cell Biol2008941442018703335
- LokarMPerutkováSKralj-IgličVIgličAVeraničPNanotubes in urothelial cell line T24Advances in Planar Lipid Bilayers and Liposomes 10th volAmsterdam, The NetherlandsElsevier20096594
- HurtigJChiuDDanielTOnfeltBIntercellular nanotubes: insights from imaging studies and beyondWiley Interdiscip Rev Nanomed Nanobiotech20102260276
- GerdesHBukoreshtlievNBarrosoJTunneling nanotubes: a new route for the exchange of components between animal cellsFEBS Lett20075812194220117433307
- DaviesDSowinskiSMembrane nanotubes: dynamic long-distance connections between animal cellsNat Rev Mol Cell Biol2008943143618431401
- VeraničPLokarMSchuetzGDifferent types of cell-to-cell connections mediated by nanotubular structuresBiophys J2008954416442518658210
- Kralj-IgličVHeinrichVSvetinaSŽekšBFree energy of closed membrane with anisotropic inclusionsEur Phys J B19991058
- IgličAHägerstrandHVeraničPPlemenitašAKralj-IgličVCurvature induced accumulation of anisotropic membrane components and raft formation in cylindrical membrane protrusionsJ Theor Biol200624036837316277995
- IgličASlivnikTKralj-IgličVElastic properties of biological membranes influenced by attached proteinsJ Biomech2007402492250017198707
- PerutkováSKralj-IgličVFrankMIgličAMechanical stability of membrane nanotubular protrusions influenced by attachment of flexible rod-like proteinsJ Biomech2010431612161720185134
- Kralj-IgličVIgličAHägerstrandHPeterlinPStable tubular microexovesicles of the erythrocyte membrane induced by dimeric amphiphilesPhys Rev E20006142304234
- HolmgrenJLonnrothISvennerholmLTissue receptor for cholera exotoxin, postulated structure from studies with GM1 ganglioside and related glycolipidsInfect Immun197382082144125267
- MerrittESarfatySvan den AkkerFL’HoirCMartialJHolWCrystal structure of cholera toxin B-pentamer bound to receptor GM1 pentasaccharideProtein Sci199431661758003954
- WernickNChinnapenDChoJLencerWCholera toxin: an intracellular journey into the cytosol by way of the endoplasmic reticulumToxins2010231032522069586
- AlbertsAJohnsonALewisJRaffMRobertsKWlaterPMolecular Biology of the Cell5th edNew YorkGerland Science20081255
- HägerstrandHKralj-IgličVBobrowska-HägerstrandMIgličAMembrane skeleton detachment in spherical and cylindrical microexovesiclesBull of Math Biol1999611019103017879869
- PeiBChenJMore ordered, convex ganglioside-enriched membrane domains: The effects of GM1 on sphingomyelin bilayers containing a low level of cholesterolJ Biochem200313457558114607985
- VekslerAGovNSPhase transitions of the coupled membrane-cytoskeleton modify cellular shapeBiophys J2007933798381017704150
- KabasoDShlomovitzRAuthTLewVLGovNSCurling and local shape changes of red blood cell membranes driven by cytoskeletal reorganizationBiophys J20109980881620682258
- KabasoDGongadzeEPerutkováSMechanics and electrostatics of the interactions between osteoblasts and titanium surfaceComput Methods Biomech Biomed Engin2011 In press.
- CaiWLubenskyTCCovariant hydrodynamics of fluid membranesPhys Rev Lett1994731186118910057646
- HelfrichWElastic properties of lipid bilayers: theory and possible experimentsZ Naturforsch C1973286937034273690
- RomerWBerlandLChambonVShiga toxin induces tubular membrane invaginations for its uptake into cellsNature200745067067518046403
- EwersHRömerWSmithAEGM1structure determines SV40-induced membrane invagination and infectionNat Cell Biol201012112020023649
- SonninoSMauriLChigornoVPrinettiAGangliosides as components of lipid membrane domainsGlycobiology20061711316973732
- HägerstrandAMrowczynskaLSalzerUCurvature dependent lateral distribution of raft markers in the human erythrocyte membraneMol Membr Biol20062327728816785211
- MillardTBompardGHeungMStructural basis of Filopodia formation induced by the IRSp53/MIM homology domain of human IRSp53EMBO J20052424025015635447
- MattilaPKPykalainenASaarikangasJMissing-in-metastasis and IRSp53 deform PI(4,5)P2-rich membranes by an inverse BAR domain-like mechanismJ Cell Biol200717695396417371834
- ScitaGConfalonieriSLappalainenPSuetsuguSIRSp53: crossing the road of membrane and actin dynamics in the formation of membrane protrusionsTrends Cell Biol200818526018215522
- ZhaoHPykäläinenALappalainenPI-BAR domain proteins: linking actin and plasma membrane dynamicsCurr Opin Cell Biol2010231821190823
- ScharaKJansaVŠuštarVMechanisms for the formation of membranous nanostructures in cell-to-cell communicationCell Mol Biol Lett20091463665619554268
- LiYParkMYeSKimCKimYElevated levels of cholesterol-rich lipid rafts in cancer cells are correlated with apoptosis sensitivity induced by cholesterol-depleting agentsAm J Pathol20061681107111816565487
- JohannesLDecaudinDProtein toxins: intracellular trafficking for targeted therapyGene Therapy2005121360136815902276
- ZhuangLLinJLuMSolomonKFreemanMCholesterol-rich lipid rafts mediate Akt-regulated survival in prostate cancer cellsCancer Res2002622227223111956073
- SarnataroDGrimaldiCPisantiSPlasma membrane and lysosomal localization of CB1 cannabinoid receptor are dependent on lipid rafts and regulated by anandamide in human breast cancer cellsFEBS Lett20055796343634916263116