
Abstract
Background
Recently, the use of nanotechnology has been expanding very rapidly in diverse areas of research, such as consumer products, energy, materials, and medicine. This is especially true in the area of nanomedicine, due to physicochemical properties, such as mechanical, chemical, magnetic, optical, and electrical properties, compared with bulk materials. The first goal of this study was to produce silver nanoparticles (AgNPs) using two different biological resources as reducing agents, Bacillus tequilensis and Calocybe indica. The second goal was to investigate the apoptotic potential of the as-prepared AgNPs in breast cancer cells. The final goal was to investigate the role of p53 in the cellular response elicited by AgNPs.
Methods
The synthesis and characterization of AgNPs were assessed by various analytical techniques, including ultraviolet-visible (UV-vis) spectroscopy, X-ray diffraction (XRD), Fourier transform infrared (FTIR) spectroscopy, dynamic light scattering (DLS), and transmission electron microscopy (TEM). The apoptotic efficiency of AgNPs was confirmed using a series of assays, including cell viability, leakage of lactate dehydrogenase (LDH), production of reactive oxygen species (ROS), DNA fragmentation, mitochondrial membrane potential, and Western blot.
Results
The absorption spectrum of the yellow AgNPs showed the presence of nanoparticles. XRD and FTIR spectroscopy results confirmed the crystal structure and biomolecules involved in the synthesis of AgNPs. The AgNPs derived from bacteria and fungi showed distinguishable shapes, with an average size of 20 nm. Cell viability assays suggested a dose-dependent toxic effect of AgNPs, which was confirmed by leakage of LDH, activation of ROS, and terminal deoxynucleotidyl transferase dUTP nick end labeling (TUNEL)-positive cells in MDA-MB-231 breast cancer cells. Western blot analyses revealed that AgNPs induce cellular apoptosis via activation of p53, p-Erk1/2, and caspase-3 signaling, and downregulation of Bcl-2. Cells pretreated with pifithrin-alpha were protected from p53-mediated AgNPs-induced toxicity.
Conclusion
We have demonstrated a simple approach for the synthesis of AgNPs using the novel strains B. tequilensis and C. indica, as well as their mechanism of cell death in a p53-dependent manner in MDA-MB-231 human breast cancer cells. The present findings could provide insight for the future development of a suitable anticancer drug, which may lead to the development of novel nanotherapeutic molecules for the treatment of cancers.
Introduction
Nanotechnology is one of the most promising fields, generating various types of interesting and novel nanomaterials for applications in biotechnology and nanomedicine. However, only a few nanoproducts are currently in use for medical purposes. Among several nanomaterials, silver nanoparticles (AgNPs) have emerged as a superior product in the field of nanotechnology.Citation1 Nanosilver is one of the nanomaterials with the highest degree of commercialization,Citation1 and silver has gained much interest because of its distinctive physical and chemical properties, including conductivity, chemical stability, and catalytic and antibacterial activities.Citation2–Citation4 Because of their unique properties and high surface area to volume ratio, AgNPs have been used extensively as antibacterial agents in the health industry, food storage,Citation5 textile coating,Citation6 and a number of environmentalCitation2,Citation4,Citation7 and biomedical applications, including utility as antiangiogenicCitation8 and anticancer agents.Citation9
Recently, biologically synthesized AgNPs have shown potential for biomedical applications because of their biocompatibility, stability, high solubility, and high yield without aggregation. Therefore, the synthesis of nanomaterials using biological methods seems to be a simple, nontoxic, and dependable approach that is more environmentally friendly than chemical methods, which are expensive and hazardous to living organisms.Citation10,Citation11 Biomedical applications for nanoparticles increased tremendously when the biological approach to nanoparticle synthesis came into focus.Citation10 Furthermore, various natural resources are available for the environmentally friendly synthesis of nanoparticles, such as plants, plant products, bacteria, fungi, algae, yeast, and viruses.Citation10,Citation11 Interestingly, biological molecules can serve as both reducing and capping agents for nanoparticle synthesis. Capping agents are essential for preventing nanoparticle aggregation and increasing solubility of the nanosystem, and they can also be used as a site for bioconjugation of the nanoparticle with important molecules.Citation12,Citation13 Stabilization of nanoparticles can be achieved by adding capping agents, which bind to the nanoparticle surface via covalent bonds or chemical interactions.Citation14 Thus, biologically prepared nanomaterials are extremely valuable because nanoparticles can be coated with a lipid or protein layer that confers physiological solubility and stability, which are critical parameters for biomedical applications that are currently a challenge for other synthesis methods.
Several studies have demonstrated that nanoparticles have toxic effects at the cellular, subcellular, and biomolecular (eg, gene and protein) levels.Citation15,Citation16 AgNPs have been shown to induce cytotoxicity via apoptosis and necrosis in different cell lines.Citation17 However, the toxicity of AgNPs depends on their size, concentration, and surface functionalization.Citation18 Park et al demonstrated that the size of AgNPs is an important factor for cytotoxicity, inflammation, and genotoxicity.Citation19 The evaluation of toxicity of AgNPs has been carried out in different cellular models, including human lung fibroblasts,Citation20 BRL3A rat liver cells,Citation21 PC-12 neuroendocrine cells,Citation22 human alveolar epithelial cells,Citation23 germline stem cells,Citation24 breast cancer cells,Citation10 and human lung cancer cells.Citation25
Oxidative stress and severe lipid peroxidation are known mechanisms for nanomaterial-induced cell death in various types of cell lines and in fish brain tissue.Citation10,Citation26,Citation27 To support in vitro studies, in vivo studies showed that AgNPs induced oxidative stress and increased levels of reactive oxygen species (ROS) in the sera of AgNP-treated rats.Citation28 In addition, Rahman et al observed upregulation of oxidative stress-related genes in the brain tissue of AgNPs-treated mice,Citation29 in regions such as the caudate nucleus, frontal cortex, and hippocampus. Repeated studies have suggested that AgNPs are responsible for biochemical and molecular changes related to genotoxicity in cultured cells, including DNA breakage.Citation20,Citation30
A World Health Organization report suggests that cancer is the leading cause of mortality worldwide. Among the various types of cancer, breast cancer in females is the most important cause of mortality in the world.Citation31 Nowadays, the use of existing chemotherapeutic drugs, such as doxorubicin (DOX), daunorubicin, bleomycin, and cisplatin, are limited because of their high cost, high toxicity, poor specificity, and side effects, which include myelosuppression, anemia and, most precariously, the emergence of cellular resistance to drugs.Citation32 Although the majority of tumors initially respond to chemotherapy, most patients eventually succumb to recurrent tumors that are composed of chemotherapy-resistant clones. Resistance of recurrent disease to cytotoxic drugs is the principle factor limiting the long-term treatment success of cancer.Citation32 Hence, it is necessary to find alternative therapies or drugs to overcome these drawbacks.
The primary purpose of this work was to develop a simple, cost-effective, nontoxic, and environmentally friendly approach for the synthesis of AgNPs using the novel biological resources, Bacillus tequilensis and Calocybe indica, as reducing and stabilizing agents. The secondary aim was to evaluate the mechanism of toxicity of two different types of AgNPs in breast cancer cells. Finally, we aimed to investigate the role of p53 in AgNPs-induced apoptosis using a p53 inhibitor, cyclic pifithrin-alpha (PFT-α).
Materials and methods
Microorganisms and reagents
B. tequilensis was used from our culture collection. Milky mushrooms (C. indica) were procured from the Mushroom Cultivation Center (Coimbatore, India). Penicillin–streptomycin solution, trypsin ethylenediaminetetraacetic acid (EDTA) solution, Dulbecco’s Modified Eagle’s Medium (DMEM) (F-12), and 1% antibiotic-antimycotic solution were obtained from Life Technologies Corp (Carlsbad, CA, USA). A fetal bovine serum (FBS) in vitro toxicology assay kit was purchased from Sigma-Aldrich Corp (St Louis, MO, USA).
Media and bacterial growth analysis
Bacterial growth and media preparation were carried out according to a method described previously.Citation33 Briefly, B. tequilensis cultures were first grown aerobically at 37°C in Luria–Bertani (LB) broth (USB Corp, Cleveland, OH, USA). The cells were harvested by centrifugation, then washed twice with phosphate-buffered saline (PBS) (Hyclone; Thermo Fisher Scientific Inc, Waltham, MA, USA) (pH 7.3), and resuspended in the appropriate fresh medium, such as LB or PBS, to yield the desired initial optical density. Inoculated cultures were grown in a shaker (220 rpm) in 250 mL flasks (with medium volume/tube volume =1/3) at 37°C until they reached the stationary phase. Growth was monitored spectrophotometrically by periodically measuring the absorbance at 600 nm. The bacteria were routinely maintained on LB agar slants and preserved in glycerol stock solutions at −70°C. Unless otherwise stated, all experiments were performed three independent times.
Synthesis of AgNPs using culture supernatant of B. tequilensis
B. tequilensis was inoculated into flasks containing sterile LB broth (without NaCl), tryptone (BD Biosciences, Franklin Lakes, NJ, USA), and yeast extract, and the flasks were incubated for 24 hours (37°C, 200 rpm). After incubation, the culture was centrifuged (10,000 rpm, 10 minutes), and the supernatant was used for the synthesis of AgNPs. Three Erlenmeyer flasks, one containing supernatant with AgNO3 at a concentration of 5 mM, the second containing only the supernatant, and the third containing only AgNO3 solution, were incubated at 60°C for 1 hour. We used the sterile LB broth (without NaCl), tryptone (BD Biosciences), and yeast extract containing 5 mM AgNO3 as a control, to establish that the tryptone and yeast extract could not reduce the Ag+ ions to AgNPs. The supernatant was sterilized by 0.22 μm filter (Merck Millipore, Billerica, MA, USA) after centrifugation at 10,000 rpm for 10 minutes. The concentration of AgNPs was determined as described earlier.Citation34 The AgNPs derived from the culture supernatant of bacteria were called B-AgNPs.
Preparation of mushroom extract
Mushroom extract was prepared according to the method described earlier.Citation35 Fresh mushrooms (5 g) were washed repeatedly with distilled water to remove any organic impurities. The cleaned mushrooms were then crushed to small pieces with a sterilized knife. The small pieces of mushrooms were added to a 1 L beaker containing 300 mL double-distilled water and thoroughly stirred for approximately 30 minutes; then, the solution was filtered through filter paper. The resulting filtrate was the extract of mushroom used as a reducing and stabilizing agent for the reduction of Ag+ to Ag0.
Synthesis of AgNPs using milky mushroom extract
The mushroom extract was treated with an aqueous solution of 5 mM AgNO3 solution, and kept at 60°C for 1 hour. A color change from colorless to reddish-brown takes place within 30 minutes in the presence of AgNO3, whereas in our experiment, no color change was observed, either in the solution kept without AgNO3 or the culture filtrate alone. The AgNPs derived from the culture filtrate of fungi (milky mushroom) were called F-AgNPs.
Characterization of AgNPs
The bioreduction of AgNO3 by bacteria and mushrooms was monitored spectrophotometrically (OPTIZEN POP; Mecasys Co Ltd, Daejeon, South Korea) between 300 and 600 nm. The synthesized particles were characterized according to methods described previously.Citation33 The size distribution of the dispersed particles was measured using a Zetasizer Nano ZS90 (Malvern Instruments Ltd, Malvern, UK). X-ray diffraction (XRD) analyses were carried out on an X-ray diffractometer (Bruker D8 DISCOVER; Bruker AXS, Madison, MA, USA). The high-resolution XRD patterns were measured at 3 kW with a Cu target, using a scintillation counter (λ =1.5406 Å) at 40 kV and 40 mA, and were recorded in the range of 2θ =5°–80°. Further characterization of changes in the surface and surface composition was performed by Fourier transform infrared (FTIR) spectroscopy (PerkinElmer Spectroscopy GX, PerkinElmer Inc., Waltham, MA, USA). Transmission electron microscopy (TEM), using a JEM-1200EX microscope (JEOL Ltd, Tokyo, Japan), was performed to determine the size and morphology of AgNPs. TEM images of AgNPs were obtained at an accelerating voltage of 300 kV.
Cell culture
Cell culture was followed according to the method described earlier.Citation10 Briefly, MDA-MB-231 human breast cancer cells were kindly provided by Kyung Jin Lee, Institute for Life Sciences, ASAN Medical Center, University of Ulsan College of Medicine, Seoul, South Korea. MDA-MB-231 cells were grown adherently and maintained in DMEM containing 10% FBS and 1% antibiotic solution, containing penicillin and streptomycin, at 37°C in 5% CO2. All experiments were performed in six-well plates, unless stated otherwise. Cells were seeded onto the plates at a density of 1×10⁶ cells per well and incubated for 24 hours prior to the experiments. The cells were washed with PBS (pH 7.4) and incubated in fresh medium containing different concentrations of AgNPs.
Cell viability
Cell viability was measured using the 3-[4,5-dimethylthiazol-2-yl]-2,5-diphenyltetrazolium bromide (MTT) dye-reduction assay, to determine the cytotoxic effect of AgNPs at various concentrations. Briefly, cells were plated onto 96-well flat-bottom culture plates with various concentrations of B-AgNPs (0–25 μg/mL) and F-AgNPs (0–25 μg/mL). All cultures were incubated for 24 hours at 37°C in a humidified incubator. After 24 hours of incubation (37°C, 5% CO2 in a humid atmosphere), 10 μL of MTT (5 mg/mL in PBS) was added to each well, and the plate was incubated for a further 4 hours at 37°C. The resulting formazan was dissolved in 100 μL of dimethyl sulfoxide with gentle shaking at 37°C, and absorbance was measured at 595 nm with an enzyme-linked immunosorbent assay reader (SpectraMax; Molecular Devices, Sunnyvale, CA, USA). The results were given as the mean of three independent experiments. Concentrations of AgNPs showing a 50% reduction in cell viability (ie, half-maximal inhibitory concentration [IC50] values) were then calculated. Further studies were carried out with the IC50 value for both B-AgNPs and F-AgNPs.
PFT-α treatment
Treatment with the p53-inhibitor cyclic PFT-α (10 μM) (Sigma-Aldrich Corp) was carried out for 1 hour before inducing apoptosis with AgNPs. Rescue effects were calculated based on the percentage of apoptotic cells (1,000 cells/dish) in cultures, with or without PFT-α treatment, 24 hours following treatment with AgNPs. All data were presented as mean and standard error of the mean (SEM). Averages were calculated from three different experiments in triplicate. Statistical comparisons of AgNPs treated with or without PFT-α were performed using a two-tailed unpaired t-test. Values of P<0.05 were considered statistically significant.
Determination of ROS
Intracellular ROS were measured based on the intracellular peroxide-dependent oxidation of 2′,7′-dichlorodihydroflu orescein diacetate (H2-DCFH-DA) to form the fluorescent compound 2′,7′-dichlorofluorescein (DCF), as previously described. Cells were seeded onto 24-well plates at a density of 5×10⁴ cells per well and cultured for 24 hours. After washing twice with PBS, fresh medium containing 10 μg/mL of B-AgNPs or 2 μg/mL of F-AgNPs or 1 μM DOX was added, and the cells were incubated for 24 hours. For the control, 20 μM of DCFH-DA was added to the cells, and incubation was continued for 30 minutes at 37°C. The cells were rinsed with PBS, then 2 mL of PBS was added to each well, and fluorescence intensity was determined with a spectrofluorometer (Gemini EM; Molecular Devices) with excitation at 485 nm and emission at 530 nm.
Detection of ROS using fluorescence microscope
MDA-MB-231 human breast cancer cells were cultured in minimum essential medium (Hyclone; Thermo Fisher Scientific Inc) containing 10 μM H2-DCFDA in a humidified incubator at 37°C for 30 minutes. Cells were washed in PBS (pH 7.4) and lysed in lysis buffer (25 mM HEPES [pH 7.4], 100 mM NaCl, 1 mM EDTA, 5 mM MgCl2, and 0.1 mM dithiothreitol [DTT], supplemented with a protease inhibitor cocktail). Cells were cultured on coverslips in a four-well plate. Cells were incubated in DMEM containing 10 μM H2-DCFDA at 37°C for 30 minutes. Cells were washed in PBS, mounted with Vectashield fluorescent medium (Vector Laboratories, Burlingame, CA, USA), and viewed with a fluorescence microscope.
Terminal deoxynucleotidyl transferase dUTP nick end labeling (TUNEL) assay
Apoptotic DNA fragmentation was also detected using a DNA fragmentation imaging kit (F. Hoffman-La Roche Ltd, Basel, Switzerland), following the manufacturer’s instructions and also as described previously.Citation10 Based on the TUNEL reaction, fluorescence detection of cells with apoptotic DNA strand breaks was performed. To examine total cell numbers, nuclei were labeled simultaneously with 4′,6-diamidino-2-phenylindole (DAPI). Merged images of both channels were shown using a fluorescence microscope (Olympus, Tokyo, Japan) at 100× magnification.
Western blot analysis
The cells were treated with AgNPs and then harvested and washed with ice-cold PBS, followed by treatment with ice-cold radioimmunoprecipitation assay (RIPA) lysis buffer. Protein concentrations were measured using BCA Protein Assay Reagent (Pierce, Rockford, IL, USA). Equivalent amounts of proteins were loaded and electrophoresed on 8%–12% sodium dodecyl sulfate–polyacrylamide gel (SDS-PAGE). Subsequently, proteins were transferred to polyvinylidene difluoride (PVDF) membranes (Merck Millipore). The membranes were blocked with 6% nonfat dry milk at room temperature for 1 hour and then incubated with the indicated primary antibodies overnight at 4°C, followed by treatment with horseradish peroxidase (HRP)-conjugated secondary antibodies at room temperature for 1 hour. Blots were developed using enhanced chemiluminescence. The following primary antibodies were used: anti-Bcl-2 (Abcam, Cambridge, UK), anti-p-Erk1/2 (Thr202/Tyr204) (Santa Cruz Biotechnology Inc, Dallas, TX, USA), anti-P-p53 (S15) (Cell Signaling #12571S, MA, USA), and anti-c-Jun, antiprocaspase-3, and anti-β-actin (Abcam).
Measurement of caspase-3 activity
Caspase-3 activity was assayed as described earlierCitation9,Citation10 using a commercial kit (Sigma-Aldrich Corp) according to the manufacturer’s instructions. Cancer cells were plated as above and treated without or with AgNPs or caspase-3 inhibitor for 24 hours, washed with ice-cold PBS, and lysed with 100 μL of lysis buffer (50 mM tris(hydroxymethyl)aminomethane (Tris)-HCl, pH 7.5, 150 mM NaCl, 1 mM EGTA, 1 mM NaF, 1% Nonidet™ P-40, 1 mM phenylmethanesulfonyl fluoride (PMSF), and protease inhibitor cocktail) for 30 minutes at 4°C. The extracts were collected after centrifugation at 10,000 rpm for 10 minutes, and protein concentration was determined using the Bio-Rad protein assay kit (Bio-Rad, Hercules, CA, USA). Equal amounts (50 μg) of protein extracts were mixed with assay buffer (20 mM HEPES, pH 7.4, 100 mM NaCl, 0.1% 3-[(3-cholamidopropyl) dimethyl-ammonio]-1-propanesulfonate (CHAPS), 10 mM DTT, 1 mM EDTA, 10% sucrose), added to 96-well plates, and incubated with caspase-3 substrate acetyl-Asp-Glu-Val-Asp p-nitroanilide (Ac-DEVD-pNA) and caspase-3 inhibitor (Ac-DEVD-CHO) for 1 hour, and the absorbance was measured at 405 nm. The colorimetric assay was based on the hydrolysis of caspase-3 substrate by caspase-3, resulting in the release of the p-nitroaniline (pNA).
JC-1 assay
The change in mitochondrial transmembrane potential (MTP) was evaluated using the cationic fluorescent indicator JC-1 (Molecular Probes T-3168; Life Technologies Corp). J-aggregates in intact mitochondria fluoresce with emission at 583 nm (red), and J-monomers in the cytoplasm fluoresce with emission at 525 nm (green), at an excitation wavelength of 488 nm. MDA-MB-231 cells were incubated in DMEM containing 10 μM JC-1 at 37°C for 15 minutes, washed with PBS, and transferred to a clear 96-well plate. The fluorescence intensity was measured. Cell populations containing the JC-1 monomer were identified using a FACS-Calibur (BD Biosciences). Cells were also cultured on cover slips, incubated in DMEM containing 10 μM JC-1 at 37°C for 15 minutes, and then washed with PBS. Finally, cells were mounted using Vectashield fluorescent medium and visualized with fluorescence microscopy.
Statistical methods
For each set of results, independent trials were repeated at least three times; data are shown as mean ± standard deviation (SD). Differences among means were tested using Student’s t-test or one-way analysis of variance (ANOVA) followed by Tukey’s test for multiple comparisons, using the software GraphPad Prism (GraphPad Software, Inc, La Jolla, CA, USA). Comparisons were considered significant at P<0.05 and P<0.01.
Results and discussion
Synthesis and characterization of B-AgNPs and F-AgNPs using ultraviolet-visible (UV-vis) spectroscopy
Nanoparticle synthesis is expected to be vital for producing nanoparticles with defined properties, such as controlled size, shape, morphology, and surface charge. It has been shown that the optical, electronic, magnetic, and catalytic properties of nanoparticles depend on their size, shape, and chemical surroundings. In this study, we attempted to produce AgNPs with controlled particle size, using bacterial culture supernatant and mushroom extract as reducing and stabilizing agents with optimized conditions.Citation33
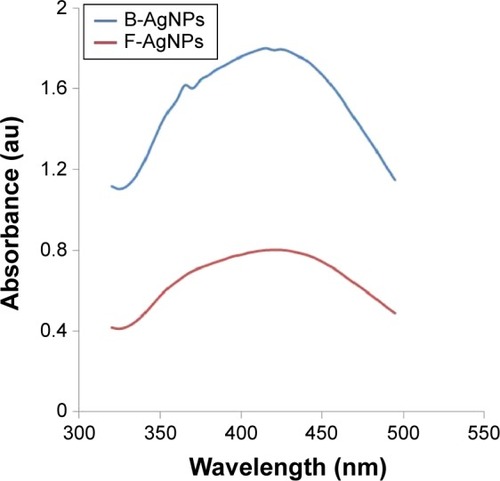
The synthesis of AgNPs was monitored by UV-vis spectroscopy, which is a reliable and valuable technique for verifying the formation of metal nanoparticles, provided that surface plasmon resonance exists for the metal.Citation33 It is known from the spectra that the silver surface plasmon resonance band occurs at 420 nm.Citation36–Citation38 shows the UV-vis spectrum of synthesized AgNPs from 5 mM AgNO3 with culture supernatant of bacteria or extracellular filtrate of the milky mushroom. It is observed that the band corresponding to surface plasmon resonance occurs at 410 nm, which clearly indicates the formation of AgNPs in the reaction mixture.Citation33,Citation36–Citation40 Similarly, Anthony et al reported AgNPs derived from culture supernatant of Bacillus mariflavi.Citation7 Mukherjee et al demonstrated synthesis of AgNPs using culture filtrate of Verticillium.Citation3 Extracellular synthesis of AgNPs has been carried out using the aqueous extract of edible oyster mushroom and Ganoderma neo-japonicum as a reducing agent.Citation10,Citation41 A strong and broad surface plasmon peak located at 410 nm was observed for the AgNPs prepared using both culture supernatant of bacteria and mycelia extract of milky mushroom.Citation10,Citation36 The strong surface plasmon resonance centered at 410 nm clearly indicates the formation of AgNPs, which were extremely stable, with no evidence of flocculation of the particles even after 3 months.Citation36 The band approximately 410 nm suggests that the particles were well-dispersed, without aggregation.Citation10 The long-term stability of the AgNPs solution may be due to the proteins in the culture supernatant of bacteria or mushroom extract acting as capping agents.
Figure 1 Synthesis and characterization of B-AgNPs and F-AgNPs using culture supernatant of Bacillus tequilensis and culture filtrate of milky mushroom, respectively.
Notes: The formation of AgNPs was confirmed using UV-vis spectroscopy. The absorption spectra of B-AgNPs and F-AgNPs exhibited a strong broad peak at 410 nm, and observation of such a band is assigned to surface plasmon resonance of the particles.
Abbreviations: AgNPs, silver nanoparticles; B-AgNPs, bacterium-derived AgNPs; F-AgNPs, fungus-derived AgNPs; UV-vis, ultraviolet-visible.
XRD analysis of B-AgNPs and F-AgNPs
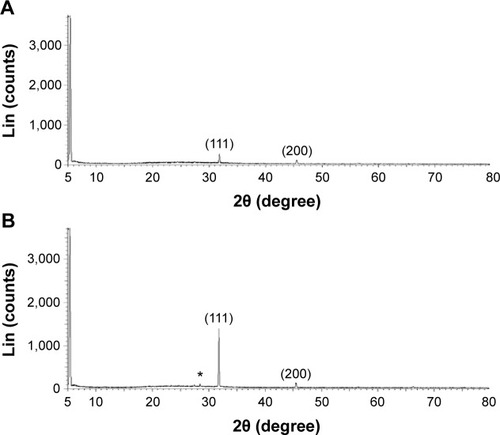
Next, the crystalline nature of B-AgNPs and F-AgNPs was confirmed using XRD analysis. shows the XRD pattern obtained from the culture supernatant of B. tequilensis. The presence of peaks at 2θ values of 32.0° and 45.7° corresponds to (111) and (200) planes of silver, respectively. Thus, the XRD spectrum confirmed the crystalline structure of AgNPs. All of the peaks in the XRD pattern can be readily indexed to a face-centered cubic structure of silver. The XRD pattern, thus, clearly shows that the AgNPs formed by the reduction of Ag+ ions by the culture supernatant were crystalline in nature, similar to AgNPs derived from Bacillus licheniformis.Citation39,Citation42 The XRD spectra of the AgNPs derived from milky mushroom extract suggest the formation of metallic silver. Regarding the crystalline nature of the AgNPs, two intense XRD peaks were observed, corresponding to the (111) and (200) planes at 2θ angles of 31.9° and 45.6°, respectively (). The width of the (111) peak of B-AgNPs and F-AgNPs was employed to calculate the average crystal size using the Scherrer equation. The average size was calculated as 20 nm, which matches the particle size obtained from a TEM image of AgNPs. In addition to the Bragg peaks representative of face-centered cubic AgNPs, additional as-yet-unassigned peaks were also observed in the F-AgNPs, suggesting that crystallization of the bioorganic phase occurred on the surface of the F-AgNPs.Citation10 Both B-AgNPs and F-AgNPs represent a significant consensus with earlier findings reporting the synthesis of AgNPs using geranium leaf and mushroom extracts.Citation10,Citation35,Citation36,Citation38,Citation43
Figure 2 XRD pattern of B-AgNPs and F-AgNPs.
Notes: A representative XRD pattern of AgNPs formed after the reaction of culture supernatant of Bacillus tequilensis (A) and culture filtrate of milky mushroom (B) with 5 mM AgNO3 for 1 hour at 60°C. The XRD pattern shows two intense peaks in the entire spectrum of 2θ values ranging from 20°–80°. The intense peaks were observed at 2θ values of 31.9° and 45.9°, corresponding to the (111) and (200) planes for silver, respectively. The * denotes the additional as-yet-unassigned peaks that were observed in the F-AgNPs.
Abbreviations: AgNPs, silver nanoparticles; B-AgNPs, bacterium-derived AgNPs; F-AgNPs, fungus-derived AgNPs; XRD, X-ray diffraction.
FTIR spectra of B-AgNPs and F-AgNPs
FTIR spectra of the nanoparticles were recorded in order to identify the functional groups of biomolecules involved in the reduction and capping/stabilization of the synthesized nanoparticles.Citation7 shows the FTIR spectra of the B-AgNPs. The spectrum of AgNPs showed characteristic absorbance bands at 1,025, 1,380, 1,630, 2,920, and 3,410 cm−1. In the FTIR spectrum of nanoparticles, a strong absorbance peak was observed at 3,410 cm−1, suggesting the binding of silver ions with hydroxyl (–OH) groups. The broad spectrum of the 3,410 cm−1 FTIR peak was from the strong stretching vibrations of the OH functional group. The presence of proteins found in the culture supernatant of bacteria could be responsible for the reduction of metal ions to their corresponding metal nanoparticles. It is also possible that proteins/enzymes play a role in the reduction of metal ions by the oxidation of benzaldehyde (aldehyde groups) to carboxylic acids.Citation44,Citation45 A peak at 3,410 cm−1 results from stretching of the amide (N–H) bond of amino groups, and is indicative of bonded –OH groups. The strong absorption peak at 2,920 cm−1 could be assigned to –CH stretching vibrations of –CH3 and –CH2 functional groups. The peak at 1,650 cm−1 indicates the fingerprint region of CO, carbonyl (C–O), and O–H groups, which exist as functional groups in bacterial supernatant. The absorption peaks at 1,650 cm−1 could be attributed to the presence of C–O stretching in carboxyl groups coupled to the amide linkage in amide I. The band at 1,530 cm−1 is characteristic of amide II, and arises as a result of the N–H stretching modes of vibration in the amide linkage. The intense band at 1,065 cm−1 can be assigned to the C–N stretching vibrations of aliphatic amines. The FTIR study of B-AgNPs indicates that the carboxyl –OH, and N–H groups of culture supernatant from bacteria are mainly involved in the reduction of Ag+ to Ag0 nanoparticles.
Figure 3 FTIR spectra of AgNPs synthesized by treating AgNO3 with culture supernatant of Bacillus tequilensis (A) and culture filtrate of milky mushroom (B).
Abbreviations: AgNPs, silver nanoparticles; FTIR, Fourier transform infrared.
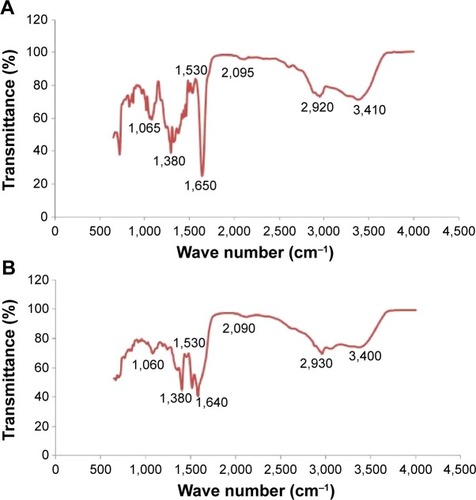
FTIR spectra of F-AgNPs show a peak at 3,400 cm−1, resulting from the stretching of the N–H bond of amino groups and indicative of bonded –OH groups. The strong absorption peak at 2,920 cm−1 could be assigned to –CH stretching vibrations of –CH3 and –CH2 functional groups (). The peak at 1,640 cm−1 indicates the fingerprint region of CO, C–O, and O–H groups, which exist as functional groups of mushroom extract. The absorption peaks at 1,640 cm−1 could be attributed to the presence of C–O stretching in carboxyl groups coupled to the amide linkage in amide I. The band at 1,530 cm−1 is characteristic of amide II and arises as a result of the N–H stretching modes of vibration in the amide linkage. The intense band at 1,060 cm−1 can be assigned to the C–N stretching vibrations of aliphatic amines. The bands observed at ∼1,650 cm−1 and ∼1,640 cm−1 observed in B-AgNPs and F-AgNPs are recognized as amide I and amide II, respectively, and arise because of C–O and –N–H stretch vibrations in the amide linkages of the protein responsible for reduction of metal ions.Citation41 The observed band shift of the –OH and C–O groups, loss of existing C–O, and appearance of a new C–O peak suggest that both –OH and C–O groups of the extract are involved in the synthesis of AgNPs.Citation35 The results of this experiment suggest that the C–O group of amino acid residues in peptides and proteins has strong ability of binding metal; therefore, the proteins most likely form a layer on the AgNPs, which prevents agglomeration of the particles and thus, stabilizes the nanoparticles in the medium.Citation3,Citation36,Citation46,Citation47
Size distribution analysis of B-AgNPs and F-AgNPs
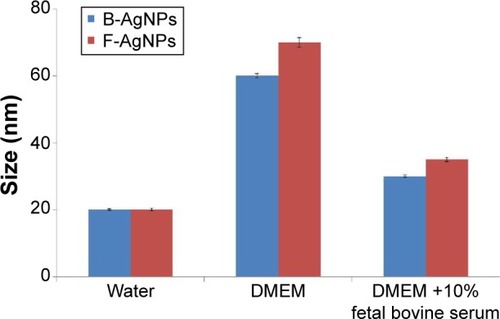
Powers et alCitation48 proposed dynamic light scattering (DLS) as a useful technique for evaluating particle size and size distribution of nanomaterials in solution. To determine particle size in aqueous or physiological solutions, DLS analysis was performed.Citation48 The characterization of nanoparticles in solution is essential before assessing in vitro toxicity.Citation49 Particle size, size distribution, particle morphology, particle composition, surface area, surface chemistry, and particle reactivity in solution are important factors in assessing nanoparticle toxicity.Citation49 In the present study, DLS was used to evaluate the size distribution of B-AgNPs and F-AgNPs. The B-AgNPs and F-AgNPs showed an average size of 20 nm, which is consistent with that observed by TEM (). Further, we evaluated the size distribution in DMEM media and DMEM media with 10% FBS. The results depicted that the average size of B-AgNPs was 20±2.0, 60±10.0, and 30±5.0 nm in water, DMEM media, and DMEM with 10% FBS, respectively. The average size of F-AgNPs was 20±5.0, 70±10.0, and 35±10.0 nm in water, DMEM media, and DMEM with 10% FBS, respectively (). The results show that AgNPs in the presence of DMEM media and DMEM media with 10% FBS exhibited larger size than the AgNPs dispersed in water. However, DMEM media with 10% FBS showed slight variation in AgNP sizes. Murdock et alCitation49 observed that polysaccharide-coated AgNPs showed an increase in the size from 80 to 250 nm and 1,230 nm in water and media with serum, respectively. Han et alCitation26 also observed that the AgNPs dispersed in media were larger in size than those dispersed in water.
Figure 4 Size distribution analysis by DLS.
Notes: AgNPs were dispersed in deionized water, DMEM, and DMEM media with 10% fetal bovine serum and the particles were mixed thoroughly via sonication and vortexing. Samples were measured at 25 μg/mL.
Abbreviations: AgNPs, silver nanoparticles; B-AgNPs, bacterium-derived AgNPs; F-AgNPs, fungus-derived AgNPs; DLS, dynamic light scattering; DMEM, Dulbecco’s Modified Eagle’s Medium.
Several studies have been reported using a biological system for synthesis of AgNPs. Synthesis of AgNPs by treating AgNO3 solution with the culture supernatant of Klebsiella pneumonia has also been reported, in which the particles ranged in size from 28.2 to 122 nm and possessed an average size of 52.5 nm.Citation50 The average size of AgNPs synthesized using a biomass of B. licheniformis and supernatant of Escherichia coli was approximately 50 nm.Citation33,Citation42 A spore crystal mixture of Bacillus thuringiensis was used for the synthesis of AgNPs, and their average size was 15 nm, with a cubic and hexagonal structure.Citation51 Anthony et al reported that particles range in size from 10 to 120 nm and possessed an average size of 40 nm when synthesized by Bacillus marisflavi.Citation7
Previously, several studies reported various sizes of AgNPs using different fungi as reducing agents. For example, Verticillium fungi produce AgNPs with an average size of 25 nm.Citation3 Cell-associated biosynthesis of AgNPs are reported in Fusarium oxysporum, and the particles were overall quasi-spherical, with a size ranging from 5 to 15 nm.Citation36 Aspergillus niger produces AgNPs with an average size between 3 and 30 nm, whereas Aspergillus terreus produces polydispersed spherical particles ranging in size from 1 to 20 nm.Citation52,Citation53 C. indica produces with an average size of 20 nm, which is consistent with other fungi.
Size and surface morphology analysis of B-AgNPs and F-AgNPs by TEM
TEM is one of the most valuable tools for directly analyzing structural information of nanoparticles, such as size and morphology.Citation25,Citation49 TEM micrographs of the B-AgNPs revealed distinct, uniformly spherical shapes that were well-separated from each other. The average particle size was estimated by measuring more than 200 particles from TEM images and showed an average size of 20 nm (). An earlier study suggested that microorganisms are able to produce different sizes of nanoparticles, depending on concentration of AgNO3, pH, temperature, and type of reducing agents.Citation33 For example, B. licheniformis, B. thuringiensis, and G. neo-japonicum produce AgNPs with average sizes of 50, 15, and 10 nm, respectively. Previous studies also suggest various sizes of AgNPs were produced from different type of mushrooms, such as Ganoderma lucidum, Pleurotus florida, Volvariella volvacea, and G. neo-japonicum, with average sizes of 20, 15, 45, and 5 nm, respectively.Citation10,Citation54–Citation56
Figure 5 Size and surface morphology of B-AgNPs and F-AgNPs by TEM.
Notes: Several fields were photographed and used to determine the diameter of AgNPs using TEM. The average of observed diameters was 20 nm. TEM images of B-AgNPs (A) and F-AgNPs (B).
Abbreviations: AgNPs, silver nanoparticles; B-AgNPs, bacterium-derived AgNPs; F-AgNPs, fungus-derived AgNPs; TEM, transmission electron microscopy.
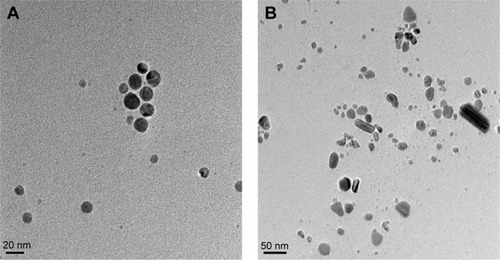
Interestingly, milky mushroom extract produces different shapes of nanoparticles, including spherical, diamond, rod, and hexagonal shapes. Although it produces various shapes of AgNPs, the size is typically 20 nm (). Philip reported synthesis of different sizes (20–150 nm) and shapes, from triangular nanoprisms to nearly spherical and hexagonal gold nanoparticles, using the extract of V. volvacea, a naturally occurring edible mushroom, as a reducing and protecting agent.Citation47
Cytotoxicity of B-AgNPs and F-AgNPs
It is well-established that the tissue distribution of nanoparticles depends on their size.Citation57 According to Johnston et al, it is apparent that AgNPs are able to pass through the gastrointestinal tract, dermal, and lung barriers into the blood and thereby, become distributed throughout the body.Citation58 On the other hand, not only does size influence the activity but also, different coatings may result in different surface charges. The surface charge can influence nanoparticle interactions with living systems, and thus, their toxicity, and may change depending on the dispersant.Citation59–Citation61 Furthermore, Suresh et alCitation61 suggest a direct correlation between the cytotoxicity of dispersed AgNPs and their overall surface charge and/or surface coating. AgNPs capped with albumin (with size 70 nm) were found to be more genotoxic to a mouse peritoneal macrophage cell line than the AgNPs capped with polysaccharides (with size 25 nm) on mouse embryonic stem cells and fibroblasts.Citation19,Citation61,Citation62 Pal et al demonstrated shape-dependent interactions and activities of AgNPs in E. coli.Citation63
Taking the literature into account, we were interested in studying the cytotoxicity of B-AgNPs and F-AgNPs derived from bacterial culture supernatant and milky mushroom extract, respectively, as a reducing agent. Therefore, we were interested in investigating whether AgNPs derived from two different capping agents and whether different shapes of AgNPs could influence cell viability with remarkable effect. To examine the effect of B-AgNPs (mostly spherical) and F-AgNPs (multishaped), MDA-MB-231 human breast cancer cells were treated with various concentrations of AgNPs, and cell viability was measured. After 24 hours of treatment with different AgNP concentrations, the MDA-MB-231 cells showed a dose-dependent decrease in cell viability compared with that of the control group, and the differences between B-AgNP- and F-AgNP-treated cells and the control group were statistically significant (). Cell viability assays showed that MDA-MB-231 cells were significantly inhibited by F-AgNPs and, to a lesser extent, by B-AgNPs. The significant toxicity of F-AgNPs may be due to the overall surface charge and/or surface coating of AgNPs.Citation61 Our studies are consistent with previous studies showing that AgNPs exposure can induce changes in cell shape, reduce cell viability, and increase lactate dehydrogenase (LDH) release, and finally, result in cell apoptosis and necrosis.Citation8,Citation20,Citation64–Citation67 Edetsberger et al demonstrated that AgNPs with a size of ≤20 nm could enter cells without significant endocytosis and were distributed within the cytoplasm.Citation68 Jiang et al reported that cellular uptake of AgNPs of ≤20 nm was greater than that of AgNPs of >100 nm in human glioma U251 cells.Citation69 Our results are consistent with those previously reported. For example, Park et al showed the effects of various sizes of AgNPs (20, 80, and 113 nm) using in vitro assays for cytotoxicity, inflammation, genotoxicity, and developmental toxicity, and finally concluded that AgNPs of 20 nm were more toxic than larger nanoparticles.Citation19 Pal et al showed the first comparative study on the bactericidal properties of AgNPs of different shapes in E. coli.Citation63 Dong et al reported that triangular nanoprisms with sharp edges and vertices possess very high antibacterial properties compared with spherical-shaped AgNPs.Citation70 Taken together, our results demonstrate that AgNPs undergo a shape-dependent interaction with cancer cells.
Figure 6 Effect of B-AgNPs and F-AgNPs on cell viability of MDA-MB-231 cells.
Notes: Cells were treated with various concentrations of B-AgNPs (A) and F-AgNPs (B) for 24 hours, and cytotoxicity was determined by the MTT method. The results are expressed as the mean ± SD of three independent experiments, each of which contained three replicates. Treated groups showed statistically significant differences from the control group by the Student’s t-test (P<0.05).
Abbreviations: B-AgNPs, bacterium-derived AgNPs; F-AgNPs, fungus-derived AgNPs; MTT, 3-[4,5-dimethylthiazol-2-yl]-2,5-diphenyltetrazolium bromide; SD, standard deviation.
![Figure 6 Effect of B-AgNPs and F-AgNPs on cell viability of MDA-MB-231 cells.Notes: Cells were treated with various concentrations of B-AgNPs (A) and F-AgNPs (B) for 24 hours, and cytotoxicity was determined by the MTT method. The results are expressed as the mean ± SD of three independent experiments, each of which contained three replicates. Treated groups showed statistically significant differences from the control group by the Student’s t-test (P<0.05).Abbreviations: B-AgNPs, bacterium-derived AgNPs; F-AgNPs, fungus-derived AgNPs; MTT, 3-[4,5-dimethylthiazol-2-yl]-2,5-diphenyltetrazolium bromide; SD, standard deviation.](/cms/asset/4f06c1af-adc2-44b3-8ba6-9bd187552f0f/dijn_a_83953_f0006_b.jpg)
In order to show consistency in the further experiments, IC50 values were calculated for B-AgNPs and F-AgNPs. The IC50 values of B-AgNPs and F-AgNPs were found to be 10 μg/mL and 2 μg/mL, respectively. Further experiments were carried out using these concentrations to depict the potential effect of AgNPs on leakage of LDH, apoptosis, signaling, and mitochondrial membrane potential of MDA-MB-231 cells.
Effect of B-AgNPs and F-AgNPs on membrane integrity
Membrane integrity is an important factor for cell survival. LDH is a cytosolic enzyme present in all mammalian cells that can be easily utilized for determining the extent of cell death.Citation71 The plasma membrane is impermeable to LDH, and loss of its integrity is detectable by the release of LDH into the supernatant.Citation72 In vitro release of LDH from cells provides an accurate measure of cell membrane integrity and cell viability, irrespective of the type of cell death.Citation71 Therefore, we examined the effect of B-AgNPs and F-AgNPs on membrane integrity. Cells were treated with IC50 concentrations of AgNPs for 24 hours, with DOX used as a positive control, and these induced LDH leakage significantly more than did the control. The results suggest that cell-membrane leakage was significantly affected (). The results from the LDH assay were consistent with cell viability; both AgNPs induced cytotoxicity in cancer cells. BRL 3A rat liver cells exposed to AgNPs for 24 hours resulted in a concentration-dependent increase in LDH leakage and significant cytotoxicity at 10–50 μg/mL.Citation21 Park et al demonstrated size-dependent toxicity in L929 fibroblasts by measuring LDH leakage.Citation19 The LDH level increased in a concentration- and time-dependent manner when cells were cultured with AgNPs at 100 μg/mL for 48 hours. Further, polyvinylpyrrolidine-coated AgNPs inhibited cell proliferation and viability, and increased LDH leakage, in a time- and concentration-dependent manner in the murine dendritic DC2.4 cell line (Kang et al).Citation75 The results from our experiments and the previous literature suggest that AgNPs can reduce the membrane potential of MDA-MB-231 cells.Citation73
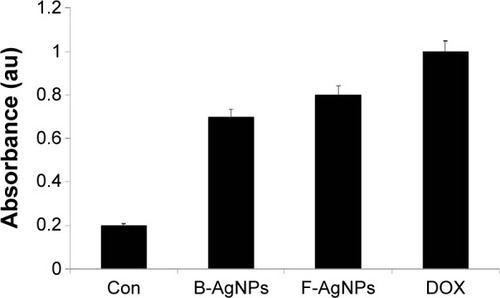
Figure 7 Effect of B-AgNPs and F-AgNPs on membrane integrity of MDA-MB-231 cells.
Notes: The cells were treated with respective IC50 concentrations of B-AgNPs or F-AgNPs, and LDH leakage was measured by changes in optical density due to NAD+ reduction, monitored at 490 nm, as described in “Materials and methods”. The results are expressed as the mean ± SD of three independent experiments, each of which contained three replicates. Treated groups showed statistically significant differences from the control group by the Student’s t-test (P<0.05).
Abbreviations: B-AgNPs, bacterium-derived AgNPs; Con, control; DOX, doxorubicin; F-AgNPs, fungus-derived AgNPs; IC50, half-maximal inhibitory concentration; LDH, lactate dehydrogenase; NAD, nicotinamide adenine dinucleotide; SD, standard deviation.
Effect of B-AgNPs and F-AgNPs on ROS generation
ROS are chemical species produced as byproducts of cellular oxygen metabolism, which occurs via mitochondrial respiration in eukaryotic cells, and are general mediators of nanoparticle-induced cytotoxicity.Citation8,Citation74 Therefore, we were interested in evaluating whether AgNPs could generate intracellular ROS in MDA-MB-231 cells. We examined the ability of AgNPs to induce oxidative stress by measuring ROS with carboxy-H2DCFDA in AgNP-treated MDA-MB-231 cells. The cells were treated with 10 μg/mL and 2.0 μg/mL B-AgNPs and F-AgNPs, respectively, for 24 hours. shows the fluorescence images of untreated MDA-MB-231 cells and cells treated with AgNPs. The control sample showed no green fluorescence, indicating a lack of H2O2 formation, whereas B-AgNP- and F-AgNP-treated cells showed bright green fluorescence () similar to H2O2-treated cells. The AgNP-treated cells showed significantly greater fluorescence intensity than untreated cells. Thus, the increase in fluorescence intensity is directly proportional to the generation of ROS. ROS target mitochondria and cause DNA damage and apoptosis.Citation75 Earlier studies have suggested that AgNPs are inducers of ROS in a variety of cells.Citation10,Citation20,Citation65,Citation76 The exposure of MDA-MB-231 cells to AgNPs could result in the production of ROS, which could explain the outcomes of metabolic and toxicological problems (). Kang et al reported that AgNPs stimulate ROS-dependent apoptosis and the inhibition of mitochondrial function.Citation75 Finkel and Holbrook reported that ROS can induce various cellular events, such as cell growth and cell signaling.Citation77 The production of intracellular ROS has been implicated as a mediator of nanotoxicity, including toxicity of AgNPs in human hepatoma cells.Citation78 Several studies have reported AgNPs-mediated generation of ROS, which induced cell death, in different cell types.Citation29,Citation67,Citation79 AgNPs with an average size of 25 nm produced a significant increase in ROS production in vitro and in vivo.Citation29 The induction of apoptosis by exposure to AgNPs was mediated by oxidative stress in fibroblasts, muscle, and colon cells.Citation67,Citation79 The production of ROS was detected in both the MC3T3-E1 and PC12 cell lines in a particle size- and concentration-dependent manner.Citation80 The results from the present study and previous studies provide strong evidence for a link between AgNPs-mediated production of ROS and subsequent generation of oxidative stress and cytotoxicity.Citation65 Oxidative stress, in turn, plays an important role in many types of cellular injury that can result in DNA damage and apoptotic cell death.Citation65
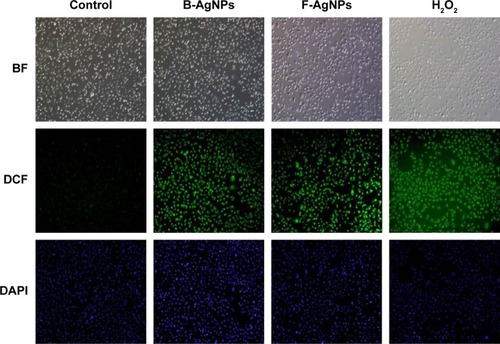
Figure 8 B-AgNPs and F-AgNPs induce ROS production in MDA-MB-231 cells.
Notes: Fluorescence images of MDA-MB-231 cells treated with respective IC50 concentrations of B-AgNPs or F-AgNPs incubated for 24 hours. The image shows significant formation of H2O2 inside the MDA-MB-231 cells, whereas no fluorescence was observed in control cells.
Abbreviations: B-AgNPs, bacterium-derived AgNPs; BF, bright field; DAPI, 4′,6-diamidino-2-phenylindole; DCF, 2′,7′-dichlorofluorescein; F-AgNPs, fungus-derived AgNPs; IC50, half-maximal inhibitory concentration; ROS, reactive oxygen species.
B-AgNPs and F-AgNPs promote apoptosis
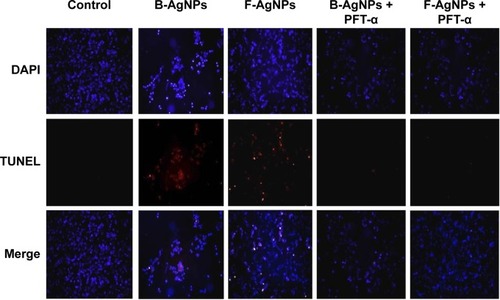
ROS can act as signal molecules promoting cell-cycle progression and can induce oxidative DNA damage. DNA fragmentation is broadly considered a characteristic feature of apoptosis.Citation81 Induction of apoptosis can be confirmed by two factors: irregular reduction in cell size, in which the cells are reduced and shrunken, and DNA fragmentation.Citation9,Citation65 Foldbjerg et al reported that AgNPs could elicit many biochemical and molecular changes in cultured cells.Citation66 For example, AgNPs-induced DNA breakage was detected in cell lines by using a TUNEL assay. To confirm the apoptotic features induced by AgNPs in MDA-MB-231 cells, apoptotic DNA fragmentation was evaluated by fluorescence microscopy using the TUNEL assay (). Treatment of MDA-MB-231 cells with B-AgNPs (10 μg/mL) and F-AgNPs (2 μg/mL) revealed a significant appearance of positively labeled cells, representing apoptotic DNA fragmentation. In control cultures, fewer or no apoptotic cells were observed. In contrast, DOX-treated cells showed a significant number of TUNEL-positive cells. Sriram et al demonstrated that Dalton’s lymphoma ascites cell lines treated with AgNPs exhibit DNA fragmentation.Citation9 The toxicity of starch-coated AgNPs was studied using normal human lung fibroblast cells (IMR-90) and human glioblastoma cells (U251), and the results concluded that the toxicity of AgNPs influences cell morphology, cell viability, metabolic activity, and oxidative stress. Further, AgNPs reduced adenosine triphosphate (ATP) content of the cell, caused damage to mitochondria, and increased production of ROS in a dose-dependent manner.Citation20 AgNPs can generate oxidative stress and lead to a series of cellular events, including reduced levels of glutathione (GSH), elevated lipid peroxidation, inflammation, DNA damage, altered cell cycle and proliferation capacity, and apoptosis and necrosis in various cell culture models.Citation82
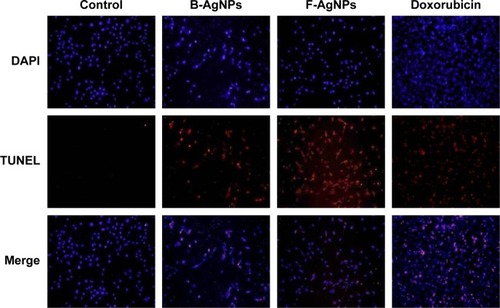
Figure 9 B-AgNPs and F-AgNPs promote apoptosis.
Notes: MDA-MB-231 cells were treated with respective IC50 concentrations of B-AgNPs or F-AgNPs for 24 hours. Fluorescent staining of cells was recorded. Representative images are shown for apoptotic DNA fragmentation (red staining) and corresponding nuclei (blue staining).
Abbreviations: B-AgNPs, bacterium-derived AgNPs; DAPI, 4′,6-diamidino-2-phenylindole; F-AgNPs, fungus-derived AgNPs; IC50, half-maximal inhibitory concentration; TUNEL, terminal deoxynucleotidyl transferase dUTP nick end labeling.
AgNPs activate ROS-mediated intracellular signals
Apoptosis is characterized by typical morphological and biochemical hallmarks, including cell shrinkage, nuclear DNA fragmentation, and membrane blebbing.Citation83 The underlying mechanisms for initiation of an apoptotic response upon cytotoxic therapy may depend on the individual stimulus.Citation84 To investigate whether both B-AgNPs and F-AgNPs activate ROS-mediated intracellular signaling, Western blot analysis was performed in MDA-MB-231 cells to analyze the activation or deactivation of various signaling molecules. The cells were exposed to the IC50 concentration of both B-AgNPs and F-AgNPs for 24 hours. The results indicate that AgNPs-treated cells showed a significant increase in the phosphorylation of both p53 and ERK1/2. Recently, AshaRani et al observed a concentration-dependent increase in phosphorylated p53 accompanied by the cleavage of caspase-3 and poly (ADP-ribose) polymerase (PARP) in cancer cells, but phosphorylation was not detected in normal cells.Citation85 Recent studies have suggested that p53 plays a critical role in the cellular response to DNA damage and apoptosis induced by ROS.Citation86,Citation87 Our Western blotting data () suggest that both B-AgNPs and F-AgNPs activated p53, which mediated apoptosis. This result is consistent with previous studies by Lu et al and Mroz et al, which showed that nanoparticles and ROS can induce DNA damage, activate p53, and mimic irradiation-related carcinogenesis pathways.Citation88,Citation89 Similarly, several studies reported that polyvinylpyrrolidone (PVP)-coated AgNPs induced p53 in the larval tissue of Drosophila melanogaster.Citation75,Citation90 Taken together, the induction of the apoptotic pathway is indicated by the phosphorylation of p53 and ERK1/2.
Figure 10 Western blot analysis of p-p53, p-Erk1/2, p-c-Jun, Bcl-2, procaspase-3, and actin expression in MDA-MB-231 cells exposed to B-AgNPs or F-AgNPs.
Notes: MDA-MB-231 cells were treated with respective IC50 concentrations of B-AgNPs or F-AgNPs for 24 hours. Expression of p-p53, p-Erk1/2, p-c-Jun, Bcl-2, and procaspase-3 protein levels were determined by Western blot analysis. Both B-AgNPs and F-AgNPs led to increased levels of p-p53, p-Erk1/2, and decreased levels of procaspase-3, whereas no alteration in expression was observed for p-c-Jun. Bcl-2 expressions significantly reduced. Equal protein loading was confirmed by analysis of β-actin protein levels. The results are representative of three independent experiments.
Abbreviations: B-AgNPs, bacterium-derived AgNPs; Con, control; F-AgNPs, fungus-derived AgNPs; IC50, half-maximal inhibitory concentration.
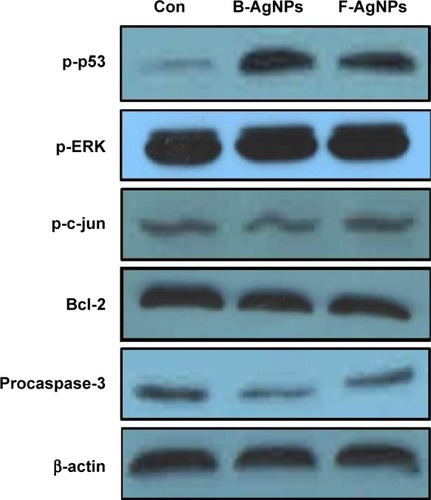
In the case of phosphorylation levels of c-Jun, there was no significant change in the F-AgNP-treated cells; B-AgNPs slightly activated phosphorylation of c-Jun but not significantly. Similarly, Kang et al did not observe any significant impact of AgNPs on c-Jun in DC2.4 cells.Citation75 Hsin et al reported that AgNPs activate JNK-dependent mechanisms involved in the mitochondrial pathway of NIH3T3 cells.Citation79 The Bcl-2 protein family controls mitochondrial outer-membrane permeabilization (MOMP) and can exert their proapoptotic (Bax, Bad, and Bak) or antiapoptotic (Bcl-2 and Bcl-XL) effect by activation or inactivation of an inner mitochondrial permeability transition pore.Citation91,Citation92 Bcl-XL is an antiapoptotic protein that protects cells from entering into p53-mediated apoptosis. Our findings indicate that both B-AgNPs and F-AgNPs significantly downregulated the expression of Bcl-2 (). The downregulation of antiapoptotic members of the Bcl-2 protein family in the present study strongly correlate with previous findings.Citation91,Citation92
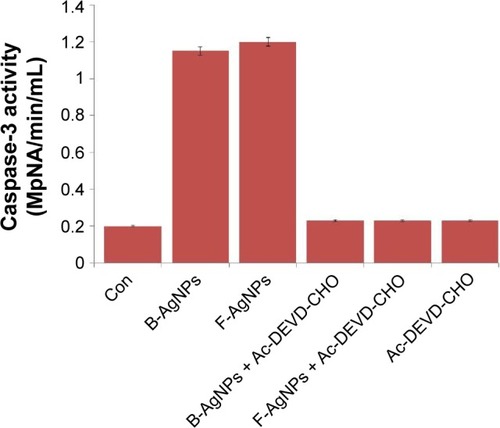
Caspases are potent cysteine proteases whose functions are tightly linked to their structural makeup, and their induction in the apoptotic pathway is known to play a vital role in both the initiation and execution of apoptosis. It was reported that caspase-3 is essential for cellular DNA fragmentation.Citation65,Citation92,Citation93 ROS is known to stimulate the intrinsic pathway of apoptosis, and it causes impairment of outer mitochondrial membrane permeability, followed by the release of cytochrome c, and procaspases-2, -3, and -9. We measured the expression level of procaspase-3 in both B-AgNP- and F-AgNP-treated cells, and the results showed significantly lower expression in AgNPs-treated cells than in untreated cells (). Similarly, Xi et al observed a gradual decrease in caspase-3 expression in human histocytic lymphoma U937 cells treated with nanoparticle realgar powders (NRP), which indicates that caspase-3 plays an important role in nanoparticle-induced apoptosis.Citation94 In order to show the link between decreased level of procaspase-3 and increased level of caspase-3, we measured the level of caspase-3 activation using the peptide substrate, Ac-DEVD-pNA. The cells treated with B-AgNPs and F-AgNPs significantly increased caspase-3 level compared with untreated cells (). The results suggest that the increased level of caspase-3 activation in AgNP-treated cells could contribute to cell death through apoptosis.Citation9,Citation10 These results concluded that both AgNPs could induce apoptosis in breast cancer cells in a caspase-3-dependent manner.Citation9,Citation10
Figure 11 B-AgNPs and F-AgNPs induces caspase-3 activity in MDA-MB-231 cells.
Notes: MDA-MB-231 cells were treated with AgNPs and F-AgNPs with or without caspase-3 inhibitor Ac-DEVD-CHO for 24 hours. The concentration of p-nitroanilide released from the substrate was calculated from the absorbance at 405 nm. The results are expressed as the mean ± standard deviation of three independent experiments. The treated groups showed statistically significant differences from the control group by the Student’s t-test (P<0.05).
Abbreviations: B-AgNPs, bacterium-derived AgNPs; Con, control; F-AgNPs, fungus- derived AgNPs.
A previous study has suggested that destabilization of mitochondrial integrity by genotoxic and cytotoxic agents precede the activation of caspases leading to apoptosis.Citation92 We also confirmed that the activation of intracellular signaling in response to AgNPs was induced through the production of ROS. Thus, these data suggest that both B-AgNPs and F-AgNPs result in the activation of ROS-mediated intracellular signaling pathways via a similar approach. Interestingly, among various signaling molecules, p53 showed the most remarkable effect in response to treatment with both B-AgNPs and F-AgNPs; therefore, further studies were focused on AgNPs-induced p53-mediated apoptosis.
PFT-α inhibits B-AgNPs- and F-AgNPs-induced cell death
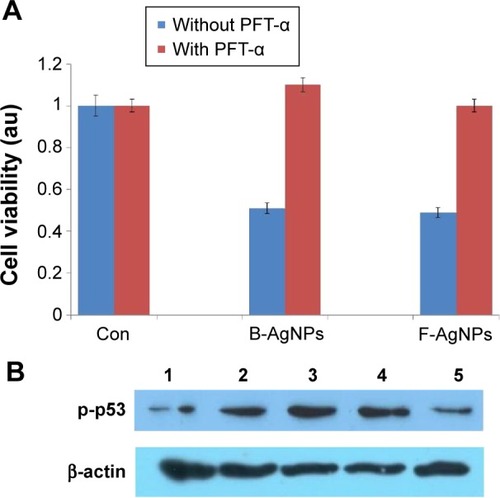
The small-molecule PFT-α has been reported to inhibit p53 function and protect against a variety of genotoxic agents.Citation95 PFT-α, an inhibitor of p53, is known to reversibly inhibit p53 transcriptional activity and has been used for the characterization of p53 function in various experimental systems.Citation96–Citation99 Culmsee et al showed that DU145 cells treated with PFT-α exhibited reduced resveratrol-induced activation of p53, decreased p53 binding to DNA, and decreased levels of Bax, a target gene for p53.Citation100 In this manuscript, previous experiments provided evidence that B-AgNPs- and F-AgNPs-induced cell death in MDA-MB-231 cells was mediated specifically by p53. To ascertain whether PFT-α suppressed p53-dependent cell death, we investigated whether PFT-α can rescue the apoptosis induced by AgNPs by pretreating cells with PFT-α and then measuring cell viability. The results clearly indicate that cells were rescued from B-AgNPs- and F-AgNPs-induced p53-mediated cell death when pretreated with PFT-α (). In addition, we performed Western blot analysis to confirm the inhibitory effect of PFT-α in the AgNPs-induced phosphorylation of p53. The results suggest that PFT-α inhibits the B-AgNPs-and F-AgNPs-induced phosphorylation of p53 (). Altogether, the results from the present study suggest that both B-AgNPs and F-AgNPs induce apoptosis through p53, which can be protected by PFT-α.
Figure 12 PFT-α inhibits B-AgNPs- and F-AgNPs-induced cell death in a p53-dependent manner.
Notes: Cells were pretreated with a p53 inhibitor (PFT-α, 10 μM) for 1 hour and then incubated with respective IC50 concentrations of B-AgNPs or F-AgNPs for 24 hours. Effects on cell viability (A) and protein expression of p-p53 (B) are shown as mean ± SD of three independent experiments. Lane 1 shows control; lane 2 shows B-AgNPs; lane 3 shows F-AgNPs; lane 4 shows B-AgNPs with PFT-α; and lane 5 shows F-AgNPs with PFT-α.
Abbreviations: B-AgNPs, bacterium-derived AgNPs; Con, control; F-AgNPs, fungus-derived AgNPs; IC50, half-maximal inhibitory concentration; PFT-α, pifithrin-alpha; SD, standard deviation.
PFT-α inhibits B-AgNP- and F-AgNP-induced p53-dependent ROSproduction
In previous experiments, exposure to both B-AgNPs and F-AgNPs led to phosphorylation of p53 and induction of p53-dependent apoptosis in MDA-MB-231 cells, through reduction of cell viability, enhanced LDH leakage, increased ROS generation, increased DNA fragmentation, and increased impairment of MTP (Δψm). These results confirm that p53 plays a major role in the activation of certain signaling transduction pathways that control the apoptotic pathway. In order to investigate whether the observed induction of p53 expression by B-AgNPs and F-AgNPs is responsible for these cellular responses, MDA-MB-231 cells were pretreated with PFT-α to block the activation of p53-mediated ROS production. To determine the effect of B-AgNPs and F-AgNPs on oxidative stress in the presence of PFT-α, we measured ROS generation using 2′,7′-dichlorofluorescein diacetate. B-AgNPs- and F-AgNPs-induced intracellular ROS generation was evaluated using intracellular peroxide-dependent oxidation of dichlorodihydrofluorescein diacetate to form fluorescent DCF. DCF fluorescence was measured in cells treated with B-AgNPs and F-AgNPs for 24 hours. Treatment of MDA-MB-231 cells with PFT-α resulted in a decline in both B-AgNP- and F-AgNP-induced ROS production (). Herein, we used H2O2 as a positive control, in which MDA-MB-231 cells treated with H2O2 showed an increase in DCF fluorescence compared with the control. Conversely, in cells that were pretreated with PFT-α, H2O2-stimulated ROS generation was compromised. Taken together, these results suggest that p53 transcriptional activity is involved in ROS production upon treatment with AgNPs.
Figure 13 PFT-α inhibits B-AgNPs- and F-AgNPs-induced ROS generation in a p53-independent manner.
Notes: Cells were pretreated with PFT-α (10 μM) for 1 hour and then incubated with respective IC50 concentrations of B-AgNPs or F-AgNPs for 24 hours. The relative fluorescence of DCF was measured using a spectrofluorometer, with excitation at 480 nm and emission at 530 nm. All experiments were carried out in triplicate, and the experiments were repeated at least three times. Data are expressed as the mean relative gene expression ± SD of three independent determinations.
Abbreviations: B-AgNPs, bacterium-derived AgNPs; Con, control; DCF, 2′,7′-dichlorofluorescein; F-AgNPs, fungus-derived AgNPs; IC50, half-maximal inhibitory concentration; PFT-α, pifithrin-alpha; ROS, reactive oxygen species; SD, standard deviation.
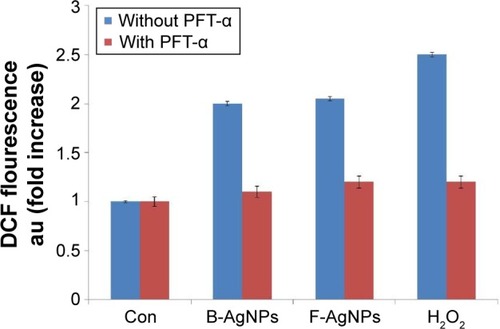
Our results are consistent with previous publications. Li et al demonstrated that the intracellular production of ROS may activate and modulate apoptosis by regulating p53 activity and accelerating mitochondrial depolarization during the effector phase of apoptosis.Citation101 In turn, activation of p53 induces the production of ROS by activation or repression of genes that regulate the production of ROS during apoptosis.Citation101 Further, Ostrakhovitch and Cherian demonstrated that exposure of MCF-7 cells to both copper and zinc can lead to phosphorylation of p53 and induces p53-dependent apoptosis; they concluded that p53 plays a major role on the activation of certain signal transduction pathways that control the apoptotic pathway.Citation102 Bragado et al showed that the presence of PFT-α, an inhibitor of p53 transcriptional activity, blocked cisplatin-induced apoptosis by reducing the generation of ROS produced upon cisplatin treatment, in HCT116 cells.Citation103 These results are consistent with previous reports on the regulation of ROS production by p53, and increased generation of ROS may be crucial for p53-dependent apoptosis.Citation101,Citation102,Citation104
Effects of PFT-α on B-AgNPs- and F-AgNPs-induced apoptosis
Liu et al reported that each cellular concentration and distribution pattern of p53 has a distinct cellular function and that ROS act as both an upstream signal that triggers p53 activation and as a downstream factor that mediates apoptosis.Citation105 Here, we examined the role of PFT-α on p53 in regulating cellular apoptosis, and the mechanism by which PFT-α modulates p53 in AgNPs-induced apoptosis. Cells were preincubated with 10 μM PFT-α, and the inhibitory effect of PFT-α on apoptosis was analyzed using the TUNEL assay. The results show that PFT-α pretreated cells exhibited significantly decreased AgNPs-induced apoptosis (). PFT-α is a small-molecule inhibitor shown to specifically inhibit the direct proapoptotic actions of p53 at mitochondria, by reducing the affinity of p53 toward its mitochondrial interaction partners Bcl-2, Bcl-XL, and Bak.Citation106,Citation107 Pretreatment with PFT-α was shown to rescue primary thymocytes in vitro and mice in vivo, from lethal doses of γ-irradiation or DNA-damaging agents.Citation106,Citation107 Thus, we used this inhibitor to determine the significance of the transcription-independent mitochondrial p53 death program during AgNPs-induced apoptosis. Indeed, cells pretreated with PFT-α prior to AgNPs exposure show decreased TUNEL staining in both B-AgNPs- and F-AgNPs-treated cells. Taken together, these results confirm the importance of the direct mitochondrial p53 death program in AgNPs-induced apoptosis.
Figure 14 PFT-α inhibits B-AgNPs- and F-AgNPs-induced apoptosis in a p53-dependent manner.
Notes: Cells were pretreated with PFT-α (10 μM) for 1 hour and then incubated with respective IC50 concentrations of B-AgNPs or F-AgNPs for 24 hours. Apoptosis was measured using the TUNEL assay.
Abbreviations: B-AgNPs, bacterium-derived AgNPs; DAPI, 4′,6-diamidino-2-phenylindole; F-AgNPs, fungus-derived AgNPs; IC50, half-maximal inhibitory concentration; PFT- α, pifithrin-alpha; TUNEL, terminal deoxynucleotidyl transferase dUTP nick end labeling.
Effect of PFT-α on B-AgNPs- and F-AgNPs-induced MTP
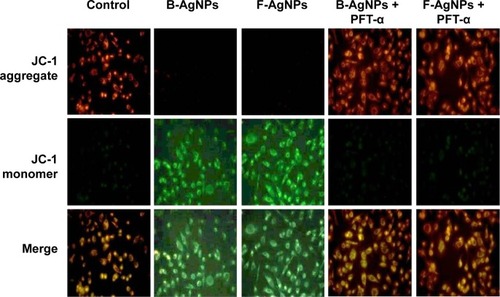
Mitochondria play a key role in the apoptotic pathway of cell death, and changes in mitochondrial membrane permeability comprise the early events of apoptosis, via depolarization of the mitochondrial membrane. Depolarized mitochondria result from the formation of mitochondrial permeability transition pores.Citation108–Citation111 Mitochondrial permeability transition has been associated with various metabolic consequences, such as halted functioning of the electron transport chain with associated elevation in ROS and decreased production of ATP.Citation112 Neema et al suggested that p53-dependent neuronal death involves a drop in MTP, which reflects both a loss in the integrity of mitochondria and an increase in mitochondrial membrane permeability.Citation113 As described from an earlier study, the inner MTP decreases during apoptosis. Thus, the effect of AgNPs exposure on the MTP of MDA-MB-231 cells in the present study was further investigated using JC-1 staining. To test whether loss of MTP occurred in AgNPs-treated cells, we used JC-1, a cationic dye that aggregates in mitochondria, giving rise to red, punctate fluorescence in healthy cells (). The cells were exposed to both B-AgNPs and F-AgNPs at their respective IC50 concentrations. Fluorescence microscopic observation of control cells () showed completely polarized mitochondria, which formed J-aggregates as red dots. In contrast, treatment with B-AgNPs and F-AgNPs resulted in depolarization of the mitochondrial membrane in MDA-MB-231 cells, as evident from the loss of the red dots and simultaneous increase of green fluorescence (). This change in fluorescence pattern indicates a loss of mitochondrial membrane integrity (). The cells pretreated with PFT-α showed no loss of MTP. These findings suggest that AgNPs induced increases in mitochondrial membrane permeability, resulting in part from p53 action. Sanpui et al reported that mitochondrial dysfunction due to nanoparticle immobilization may lead to oxidative stress, and the mitochondrial membrane is among the most susceptible targets of the deleterious effects associated with intracellular ROS.Citation109 Govender et al demonstrated that a significant increase in mitochondria depolarization after AgNPs treatment, with an accompanying decrease in ATP concentration, induces cellular apoptosis in cancerous lung cells via the intrinsic apoptosis pathway.Citation111 The present results indicate that adverse changes in mitochondrial function due to AgNPs, with possible association of intracellular ROS production, trigger apoptosis. Taking the literature and the present study into account, results suggest that an increase in ROS generation after exposure to B-AgNPs and F-AgNPs can result in disruption of the mitochondrial membrane and apoptosis.
Figure 15 PFT-α inhibits B-AgNPs- and F-AgNPs-induced increase in MTP in a p53-independent manner.
Notes: Cells were pretreated with PFT-α (10 μM) for 1 hour and then incubated with respective IC50 concentrations of B-AgNPs or F-AgNPs for 24 hours. Changes in MTP were determined using the cationic fluorescent indicator JC-1. Fluorescence images of control and treated cells were recorded using fluorescence microscopy. JC-1 formed red fluorescent J-aggregates in healthy control cells with high MTP, whereas cells exposed to B-AgNPs or F-AgNPs had low MTP, and JC-1 existed as a monomer showing green fluorescence.
Abbreviations: B-AgNPs, bacterium-derived AgNPs; F-AgNPs, fungus-derived AgNPs; IC50, half-maximal inhibitory concentration; MTP, mitochondrial membrane potential; PFT-α, pifithrin-alpha.
Conclusion
Here we showed the synthesis of AgNPs with an average size of 20 nm produced by B. tequilensis (spherical in shape) and C. indica (multishaped, especially rod). The apoptotic potential of these two types of AgNPs was explored in human breast cancer cells. The results obtained from various biochemical and cellular assays indicate that both B-AgNPs and F-AgNPs showed significant cytotoxic effects against breast cancer cells. Particularly, the dose-dependent assay indicates that F-AgNPs show more potential than B-AgNPs. Signaling assays suggest that activation of p53 is required for the B-AgNP- and F-AgNP-induced generation of ROS in MDA-MB-231 breast cancer cells and the expression of downstream targets of p53, such as activation of p-Erk, decreased expression of Bcl-2 responsible for increased generation of intracellular ROS, and disruption of mitochondrial integrity. Furthermore, our data suggest that in the apoptotic signaling pathway of MDA-MB-231 cells, p53 induces ROS generation and plays important roles in depolarization of the mitochondrial membrane and activation of caspase-3. Thus, activation of caspase-3 is an important pathway in the execution of apoptosis in MDA-MB-231 cells. Based on these results, it can be concluded that oxidative stress is a possible mechanism underlying the cytotoxicity and apoptosis induced by both B-AgNPs and F-AgNPs in MDA-MB-231 cells. In addition, this study also suggests that the size, shape, and type of coating materials could influence the cytotoxicity of the cells. Therefore, AgNPs derived from natural sources, such as bacteria and fungi, have therapeutic potential for cancer. Further studies are required to investigate the anticancer effects of AgNPs in other cellular models using in vivo studies.
Acknowledgments
Dr Sangiliyandi Gurunathan was supported by a Konkuk University full-time Professorship. This work was also supported by the Woo Jang-Choon project (grant number PJ007849).
Disclosure
The authors report no conflicts of interest in this work.
References
- ReidyBHaaseALuchADawsonKALynchIMechanisms of silver nanoparticle release, transformation and toxicity: a critical review of current knowledge and recommendations for future studies and applicationsMaterials20136622952350
- ChenXSchluesenerHJNanosilver: a nanoproduct in medical applicationToxicol Lett2008176111218022772
- MukherjeePAhmadAMandalDFungus-mediated synthesis of silver nanoparticles and their immobilization in the mycelial matrix: a novel biological approach to nanoparticle synthesisNano Lett2001110515519
- SondiISalopek-SondiBSilver nanoparticles as antimicrobial agent: a case study on E. coli as a model for Gram-negative bacteriaJ Colloid Interface Sci2004275117718215158396
- CushenMKerryJMorrisMCruz-RomeroMCumminsEEvaluation and simulation of silver and copper nanoparticle migration from polyethylene nanocomposites to food and an associated exposure assessmentJ Agric Food Chem20146261403141124450547
- WalserTDemouELangDJHellwegSProspective environmental life cycle assessment of nanosilver T-shirtsEnviron Sci Technol201145104570457821506582
- AnthonyKJPMuruganMGurunathanSBiosynthesis of silver nanoparticles from the culture supernatant of Bacillus marisflavi and their potential antibacterial activityJ Ind Eng Chem201420415051510
- GurunathanSLeeKJKalishwaralalKSheikpranbabuSVaidyanathanREomSHAntiangiogenic properties of silver nanoparticlesBiomaterials200930316341635019698986
- SriramMIKanthSBKalishwaralalKGurunathanSAntitumor activity of silver nanoparticles in Dalton’s lymphoma ascites tumor modelInt J Nanomedicine2010575376221042421
- GurunathanSRamanJAbd MalekSNJohnPAVikineswarySGreen synthesis of silver nanoparticles using Ganoderma neo-japonicum Imazeki: a potential cytotoxic agent against breast cancer cellsInt J Nanomedicine201384399441324265551
- ThakkarKNMhatreSSParikhRYBiological synthesis of metallic nanoparticlesNanomedicine20106225726219616126
- SeabraABDuránNNitric oxide-releasing vehicles for biomedical applicationsJ Mater Chem201020916241637
- SinghSPatelPJaiswalSPrabhuneAARamanaCVPrasadBLVA direct method for the preparation of glycolipid–metal nanoparticle conjugates: sophorolipids as reducing and capping agents for the synthesis of water re-dispersible silver nanoparticles and their antibacterial activityNew J Chem2009333646652
- de LimaRSeabraABDuránNSilver nanoparticles: a brief review of cytotoxicity and genotoxicity of chemically and biogenically synthesized nanoparticlesJ Appl Toxicol2012321186787922696476
- ChiZLiuRZhaoLA new strategy to probe the genotoxicity of silver nanoparticles combined with cetylpyridine bromideSpectrochim Acta A Mol Biomol Spectrosc200972357758119070536
- GurrJRWangASChenCHJanKYUltrafine titanium dioxide particles in the absence of photoactivation can induce oxidative damage to human bronchial epithelial cellsToxicology20052131–2667315970370
- FoldbjergROlesenPHougaardMPVP-coated silver nanoparticles and silver ions induce reactive oxygen species, apoptosis and necrosis in THP-1 monocytesToxicol Lett2009190215616219607894
- GreulichCDiendorfJSimonTEggelerGEppleMKöllerMUptake and intracellular distribution of silver nanoparticles in human mesenchymal stem cellsActa Biomater20117134735420709196
- ParkMVNeighAMVermeulenJPThe effect of particle size on the cytotoxicity, inflammation, developmental toxicity and genotoxicity of silver nanoparticlesBiomaterials201132369810981721944826
- AshaRaniPVLow Kah MunGHandeMPValiyaveettilSCytotoxicity and genotoxicity of silver nanoparticles in human cellsACS Nano20093227929019236062
- HussainSMHessKLGearhartJMGeissKTSchlagerJJIn vitro toxicity of nanoparticles in BRL 3A rat liver cellsToxicol In Vitro200519797598316125895
- HussainSMJavorinaAKSchrandAMDuhartHMAliSFSchlagerJJThe interaction of manganese nanoparticles with PC-12 cells induces dopamine depletionToxicol Sci200692245646316714391
- ParkJHKimEJJangHYCombination treatment with arsenic trioxide and sulindac enhances apoptotic cell death in lung cancer cells via activation of oxidative stress and mitogen-activated protein kinasesOncol Rep200820237938418636201
- Braydich-StolleLHussainSSchlagerJJHofmannMCIn vitro cytotoxicity of nanoparticles in mammalian germline stem cellsToxicol Sci200588241241916014736
- HanJWGurunathanSJeongJKOxidative stress mediated cytotoxicity of biologically synthesized silver nanoparticles in human lung epithelial adenocarcinoma cell lineNanoscale Res Lett20149145925242904
- FoldbjergRDangDAAutrupHCytotoxicity and genotoxicity of silver nanoparticles in the human lung cancer cell line, A549Arch Toxicol201185774375020428844
- OberdörsterEManufactured nanomaterials (fullerenes, C60) induce oxidative stress in the brain of juvenile largemouth bassEnviron Health Perspect2004112101058106215238277
- TiwariDKJinTBehariJDose-dependent in-vivo toxicity assessment of silver nanoparticle in Wistar ratsToxicol Mech Methods2011211132421080782
- RahmanMFWangJPattersonTAExpression of genes related to oxidative stress in the mouse brain after exposure to silver-25 nanoparticlesToxicol Lett20091871152119429238
- KawataKOsawaMOkabeSIn vitro toxicity of silver nanoparticles at noncytotoxic doses to HepG2 human hepatoma cellsEnviron Sci Technol200943156046605119731716
- World Health OrganizationThe Global Burden of Disease: 2004 UpdateGenevaWorld Health Organization2008 Available from http://www.who.int/healthinfo/global_burden_disease/GBD_report_2004update_full.pdfAccessed December 1, 2014
- OpipariAWTanLBoitanoAESorensonDRAuroraALiuJRResveratrol-induced autophagocytosis in ovarian cancer cellsCancer Res200464269670314744787
- GurunathanSKalishwaralalKVaidyanathanRBiosynthesis, purification and characterization of silver nanoparticles using Escherichia coliColloids Surf B Biointerfaces200974132833519716685
- KalishwaralalKDeepakVRam Kumar PandianSBiosynthesis of silver and gold nanoparticles using Brevibacterium caseiColloids Surf B Biointerfaces201077225726220197229
- AnthonyKJPMuruganMJeyarajMRathinamNKSangiliyandiGSynthesis of silver nanoparticles using pine mushroom extract: A potential antimicrobial agent against E. coli and B. subtilisJ Ind Eng Chem201420423252331
- AhmadAMukherjeePSenapatiSExtracellular biosynthesis of silver nanoparticles using the fungus Fusarium oxysporumColloids Surf B Biointerfaces2003284313318
- SastryMMayyaKSBandyopadhyayKpH Dependent changes in the optical properties of carboxylic acid derivatized silver colloidal particlesColloids and Surfaces A: Physicochemical and Engineering Aspects1997127221228
- SastryMPatilVSainkarSRElectrostatically controlled diffusion of carboxylic acid derivatized silver colloidal particles in thermally evaporated fatty amine filmsJ Phys Chem B1998102814041410
- KalimuthuKSuresh BabuRVenkataramanDBilalMGurunathanSBiosynthesis of silver nanocrystals by Bacillus licheniformisColloids Surf B Biointerfaces200865115015318406112
- MulvaneyPPereraJMBiggsSGrieserFStevensGWThe direct measurement of the forces of interaction between a colloid particle and an oil dropletJ Colloid Interface Sci199618326146168954709
- BhatRDeshpandeRGanachariSVHuh doSVenkataramanAPhoto-irradiated biosynthesis of silver nanoparticles using edible mushroom pleurotus Florida and their antibacterial activity studiesBioinorg Chem Appl2011201165097922190895
- KalishwaralalKDeepakVRamkumarpandianSNellaiahHSangiliyandiGExtracellular biosynthesis of silver nanoparticles by the culture supernatant of Bacillus licheniformisMater Lett2008622944114413
- ShankarSSAhmadASastryMGeranium leaf assisted biosynthesis of silver nanoparticlesBiotechnol Prog20031961627163114656132
- MandalDGuptaBDCobaloximes with pyrazine and their dimetallic complexesEur J Inorg Chem200620062040864095
- ShankarSSRaiAAhmadASastryMRapid synthesis of Au, Ag, and bimetallic Au core-Ag shell nanoparticles using Neem (Azadirachta indica) leaf brothJ Colloid Interface Sci2004275249650215178278
- KathiresanKManivannanSNabeelMADhivyaBStudies on silver nanoparticles synthesized by a marine fungus, Penicillium fellutanum isolated from coastal mangrove sedimentColloids Surf B Biointerfaces200971113313719269142
- PhilipDBiosynthesis of Au, Ag and Au-Ag nanoparticles using edible mushroom extractSpectrochim Acta A Mol Biomol Spectrosc200973237438119324587
- PowersKWBrownSCKrishnaVBWasdoSCMoudgilBMRobertsSMResearch strategies for safety evaluation of nanomaterials. Part VI. Characterization of nanoscale particles for toxicological evaluationToxicol Sci200690229630316407094
- MurdockRCBraydich-StolleLSchrandAMSchlagerJJHussainSMCharacterization of nanomaterial dispersion in solution prior to in vitro exposure using dynamic light scattering techniqueToxicol Sci2008101223925317872897
- ShahverdiARFakhimiAShahverdiHRMinaianSSynthesis and effect of silver nanoparticles on the antibacterial activity of different antibiotics against Staphylococcus aureus and Escherichia coliNanomedicine20073216817117468052
- JainDKachhwahaSJainRSrivastavaGKothariSLNovel microbial route to synthesize silver nanoparticles using spore crystal mixture of Bacillus thuringiensisIndian J Exp Biol201048111152115621117457
- JaidevLRNarasimhaGFungal mediated biosynthesis of silver nanoparticles, characterization and antimicrobial activityColloids Surf B Biointerfaces201081243043320708910
- LiGHeDQianYFungus-mediated green synthesis of silver nanoparticles using Aspergillus terreusInt J Mol Sci201213146647622312264
- BernardshawSJohnsonEHetlandGAn extract of the mushroom Agaricus blazei Murill administered orally protects against systemic Streptococcus pneumoniae infection in miceScand J Immunol200562439339816253127
- KarwaAGaikwadSRaiMKMycosynthesis of silver nanoparticles using Lingzhi or Reishi medicinal mushroom, Ganoderma lucidum (W. Curt.:Fr.) P. Karst. and their role as antimicrobials and antibiotic activity enhancersInt J Med Mushrooms201113548349122324414
- VigneshwaranNAshtaputreNMVaradarajanPVNachaneRPParalikarKMBalasubramanyaRHBiological synthesis of silver nanoparticles using the fungus Aspergillus flavusMater Lett200761614131418
- LankveldDPOomenAGKrystekPThe kinetics of the tissue distribution of silver nanoparticles of different sizesBiomaterials201031328350836120684985
- JohnstonHJHutchisonGChristensenFMPetersSHankinSStoneVA review of the in vivo and in vitro toxicity of silver and gold particulates: particle attributes and biological mechanisms responsible for the observed toxicityCrit Rev Toxicol201040432834620128631
- ChappellMAMillerLFGeorgeAJSimultaneous dispersion-dissolution behavior of concentrated silver nanoparticle suspensions in the presence of model organic solutesChemosphere20118481108111621550097
- ChoiOClevengerTEDengBSurampalliRYRossLHuZRole of sulfide and ligand strength in controlling nanosilver toxicityWater Res20094371879188619249075
- SureshAKPelletierDAWangWMorrell-FalveyJLGuBDoktyczMJCytotoxicity induced by engineered silver nanocrystallites is dependent on surface coatings and cell typesLangmuir20122852727273522216981
- AhamedMKarnsMGoodsonMDNA damage response to different surface chemistry of silver nanoparticles in mammalian cellsToxicol Appl Pharmacol2008233340441018930072
- PalSTakYKSongJMDoes the antibacterial activity of silver nanoparticles depend on the shape of the nanoparticle? A study of the Gram-negative bacterium Escherichia coliAppl Environ Microbiol20077361712172017261510
- KalishwaralalKBanumathiERam Kumar PandianSSilver nanoparticles inhibit VEGF induced cell proliferation and migration in bovine retinal endothelial cellsColloids Surf B Biointerfaces2009731515719481908
- GurunathanSHanJWDayemAAGreen synthesis of anisotropic silver nanoparticles and its potential cytotoxicity in human breast cancer cells (MCF-7)J Ind Eng Chem201319516001605
- FoldbjergROlesenPHougaardMDangDAHoffmannHJAutrupHPVP-coated silver nanoparticles and silver ions induce reactive oxygen species, apoptosis and necrosis in THP-1 monocytesToxicol Lett2009190215616219607894
- AroraSJainJRajwadeJMPaknikarKMCellular responses induced by silver nanoparticles: in vitro studiesToxicol Lett200817929310018508209
- EdetsbergerMGaubitzerEValicEWaigmannEKöhlerGDetection of nanometer-sized particles in living cells using modern fluorescence fluctuation methodsBiochem Biophys Res Commun2005332110911615896306
- JiangHWangCGuoZWangZLiuLSilver nanocrystals mediated combination therapy of radiation with magnetic hyperthermia on glioma cellsJ Nanosci Nanotechnol201212118276828123421206
- Van DongPHaCBinhLKasbohmJChemical synthesis and antibacterial activity of novel-shaped silver nanoparticlesInt Nano Lett20122119
- KryskoDVVanden BergheTD’HerdeKVandenabeelePApoptosis and necrosis: detection, discrimination and phagocytosisMethods200844320522118314051
- RaeTTolerance of mouse macrophages in vitro to barium sulfate used in orthopedic bone cementJ Biomed Mater Res1977116839846591525
- LeeHParkMTChoiBHEndoplasmic reticulum stress-induced JNK activation is a critical event leading to mitochondria-mediated cell death caused by β-lapachone treatmentPLoS One201166e2153321738692
- NelAXiaTMädlerLLiNToxic potential of materials at the nanolevelScience2006311576162262716456071
- KangKJungHLimJSCell death by polyvinylpyrrolidine-coated silver nanoparticles is mediated by ROS-dependent signalingBiomol Ther (Seoul)201220439940524009827
- EomHJChoiJOxidative stress of CeO2 nanoparticles via p38-Nrf-2 signaling pathway in human bronchial epithelial cell, Beas-2BToxicol Lett20091872778319429248
- FinkelTHolbrookNJOxidants, oxidative stress and the biology of ageingNature2000408680923924711089981
- KimSChoiJEChoiJOxidative stress-dependent toxicity of silver nanoparticles in human hepatoma cellsToxicol In Vitro20092361076108419508889
- HsinYHChenCFHuangSShihTSLaiPSChuehPJThe apoptotic effect of nanosilver is mediated by a ROS- and JNK-dependent mechanism involving the mitochondrial pathway in NIH3T3 cellsToxicol Lett2008179313013918547751
- KimTHKimMParkHSShinUSGongMSKimHWSize-dependent cellular toxicity of silver nanoparticlesJ Biomed Mater Res A201210041033104322308013
- AllenRTHunterWJ3rdAgrawalDKMorphological and biochemical characterization and analysis of apoptosisJ Pharmacol Toxicol Methods19973742152289279777
- ZhangTWangLChenQChenCCytotoxic potential of silver nanoparticlesYonsei Med J201455228329124532494
- HengartnerMOThe biochemistry of apoptosisNature2000407680577077611048727
- FuldaSDebatinKMExtrinsic versus intrinsic apoptosis pathways in anticancer chemotherapyOncogene200625344798481116892092
- AshaRaniPSethuSLimHKBalajiGValiyaveettilSHandeMPDifferential regulation of intracellular factors mediating cell cycle, DNA repair and inflammation following exposure to silver nanoparticles in human cellsGenome Integr201231222321936
- ChowdhuryRChowdhurySRoychoudhuryPMandalCChaudhuriKArsenic induced apoptosis in malignant melanoma cells is enhanced by menadione through ROS generation, p38 signaling and p53 activationApoptosis200914110812319082730
- CardaciSFilomeniGRotilioGCirioloMRReactive oxygen species mediate p53 activation and apoptosis induced by sodium nitroprusside in SH-SY5Y cellsMol Pharmacol20087451234124518676676
- LuXQianJZhouHIn vitro cytotoxicity and induction of apoptosis by silica nanoparticles in human HepG2 hepatoma cellsInt J Nanomedicine201161889190121931484
- MrozRMSchinsRPLiHNanoparticle-driven DNA damage mimics irradiation-related carcinogenesis pathwaysEur Respir J200831224125118057054
- AhamedMPosgaiRGoreyTJNielsenMHussainSMRoweJJSilver nanoparticles induced heat shock protein 70, oxidative stress and apoptosis in Drosophila melanogasterToxicol Appl Pharmacol2010242326326919874832
- ChaoDTKorsmeyerSJBCL-2 family: regulators of cell deathAnnu Rev Immunol1998163954199597135
- GopinathPGogoiSKSanpuiPPaulAChattopadhyayAGhoshSSSignaling gene cascade in silver nanoparticle induced apoptosisColloids Surf B Biointerfaces201077224024520197232
- JänickeRUSprengartMLWatiMRPorterAGCaspase-3 is required for DNA fragmentation and morphological changes associated with apoptosisJ Biol Chem199827316935793609545256
- XiRGHuangJLiDWangXBWuLJRoles of PI3-K/Akt pathways in nanoparticle realgar powders-induced apoptosis in U937 cellsActa Pharmacol Sin200829335536318298901
- WaltonMIWilsonSCHardcastleIRMirzaARWorkmanPAn evaluation of the ability of pifithrin-alpha and -beta to inhibit p53 function in two wild-type p53 human tumor cell linesMol Cancer Ther2005491369137716170029
- LeiXHZhaoDLiYLPifithrin-α enhances the survival of transplanted neural stem cells in stroke rats by inhibiting p53 nuclear translocationCNS Neurosci Ther201319210911623253187
- MisraUKPizzoSVPFT-alpha inhibits antibody-induced activation of p53 and pro-apoptotic signaling in 1-LN prostate cancer cellsBiochem Biophys Res Commun2010391127227619913499
- MurphyPJGalignianaMDMorishimaYPifithrin-alpha inhibits p53 signaling after interaction of the tumor suppressor protein with hsp90 and its nuclear translocationJ Biol Chem200427929301953020115145929
- NieLSasakiMMakiCGRegulation of p53 nuclear export through sequential changes in conformation and ubiquitinationJ Biol Chem200728219146161462517371868
- CulmseeCZhuXYuQSA synthetic inhibitor of p53 protects neurons against death induced by ischemic and excitotoxic insults, and amyloid beta-peptideJ Neurochem200177122022811279278
- LiPFDietzRvon HarsdorfRp53 regulates mitochondrial membrane potential through reactive oxygen species and induces cytochrome c-independent apoptosis blocked by Bcl-2EMBO J199918216027603610545114
- OstrakhovitchEACherianMGRole of p53 and reactive oxygen species in apoptotic response to copper and zinc in epithelial breast cancer cellsApoptosis200510111112115711927
- BragadoPArmesillaASilvaAPorrasAApoptosis by cisplatin requires p53 mediated p38alpha MAPK activation through ROS generationApoptosis20071291733174217505786
- YeJWangSLeonardSSRole of reactive oxygen species and p53 in chromium(VI)-induced apoptosisJ Biol Chem199927449349743498010574974
- LiuBChenYSt ClairDKROS and p53: a versatile partnershipFree Radic Biol Med20084481529153518275858
- LeuJIGeorgeDLHepatic IGFBP1 is a prosurvival factor that binds to BAK, protects the liver from apoptosis, and antagonizes the proapoptotic actions of p53 at mitochondriaGenes Dev200721233095310918056423
- StromESatheSKomarovPGSmall-molecule inhibitor of p53 binding to mitochondria protects mice from gamma radiationNat Chem Biol20062947447916862141
- ThressKKornbluthSSmithJJMitochondria at the crossroad of apoptotic cell deathJ Bioenerg Biomembr199931432132610665522
- SanpuiPChattopadhyayAGhoshSSInduction of apoptosis in cancer cells at low silver nanoparticle concentrations using chitosan nanocarrierACS Appl Mater Interfaces20113221822821280584
- HirschTMarzoIKroemerGRole of the mitochondrial permeability transition pore in apoptosisBiosci Rep199717167769171922
- GovenderRPhulukdareeAGenganRMAnandKChuturgoonAASilver nanoparticles of Albizia adianthifolia: the induction of apoptosis in human lung carcinoma cell lineJ Nanobiotechnology201311523418790
- WangJGreenPSSimpkinsJWEstradiol protects against ATP depletion, mitochondrial membrane potential decline and the generation of reactive oxygen species induced by 3-nitroproprionic acid in SK-N-SH human neuroblastoma cellsJ Neurochem200177380481111331409
- NeemaMNavarro-QuirogaIChechlaczMDNA damage and nonhomologous end joining in excitotoxicity: neuroprotective role of DNA-PKcs in kainic acid-induced seizuresHippocampus20051581057107116216017