
Abstract
Doped ZnS quantum dots (QDs) have a longer dopant emission lifetime and potentially lower cytotoxicity compared to other doped QDs. The liver is the key organ for clearance and detoxification of xenobiotics by phagocytosis and metabolism. The present study was designed to synthesize and evaluate the hepatotoxicity of Mn-doped ZnS QDs and their polyethylene glycol-coated counterparts (1 mg/kg and 5 mg/kg) in mice. The results demonstrated that daily injection of Mn-doped ZnS QDs and polyethylene glycol-coated QDs via tail vein for 7 days did not influence body weight, relative liver weight, serum aminotransferases (alanine aminotransferase and aspartate aminotransferase), the levels of antioxidant enzymes (catalase, glutathione peroxidase, and superoxide dismutase), or malondialdehyde in the liver. Analysis of hepatocyte ultrastructure showed that Mn-doped ZnS QDs and polyethylene glycol-coated QDs mainly accumulated in mitochondria at 24 hours after repeated intravenous injection. No damage to cell nuclei or mitochondria was observed with either of the QDs. Our results indicate that Mn-doped ZnS QDs did not cause obvious damage to the liver. This study will assist in the development of Mn-doped ZnS QDs-based bioimaging and biomedical applications in the future.
Introduction
Quantum dots (QDs) are semiconductor nanocrystals with distinctive photoluminescence properties, holding great promise in applications from consumer products to several commercial systems of clinical significance.Citation1,Citation2 QDs have tunable emission wavelengths and can be excited over a broad wavelength range.Citation3,Citation4 Moreover, QDs are much brighter than traditional organic dyes, with higher quantum yields and resistance to photobleaching.Citation5,Citation6 QDs are powerful imaging tools and are used in vivo as fluorescence nanoparticle probes for lymph node and live cell imaging.Citation7 Bilan et alCitation8 deemed that QDs could be used for long-term visualization due to their high stability to photobleaching, and Lin et alCitation9 reported that mercaptosuccinic acid-functionalized near-infrared QDs could be detected in in vivo imaging of a pancreatic tumor-bearing mouse until 216 hours had passed. Future medical applications will expose humans directly to QDs during diagnostic or therapeutic imaging.Citation10,Citation11 Environmental exposure to QDs is also becoming common, and QDs can enter aquatic environments in a variety of ways, including wastewater discharge and atmospheric deposition.Citation12,Citation13 Therefore, the health risk from exposure to QDs is of increasing concern.
Some studies have shown that kinds of QDs including CdTe QDs,Citation14 CdSe-ZnS QDs,Citation15 CdSeTe/ZnS QDs,Citation16 and Ag2S QDsCitation17 failed to change tissue morphology, parameters of clinical biochemistry, or hematology after single and repeated injection. Lin et al proposed that low toxicity of QDs was due to the relative insensitivity of these parameters, and they demonstrated Cd/Se/Te-based QD 705-induced hepatotoxicity in mice by disruption of the cellular antioxidant systems.Citation18 Liu et alCitation7 found that CdSe QDs caused significant impairment to the liver by oxidative stress, as characterized by a significant increase in reactive oxygen species and malondialdehyde (MDA) levels within hepatocytes. Park et alCitation19 have suggested that bioconjugation could reduce the level of oxidative stress and decrease the toxicity of CdTe QDs to mammalian cells.
Surface modification of QDs changed their physicochemical properties (such as particle diameter and surface ζ potential) and finally affected QD-induced cytotoxicity.Citation20 According to the reports by Hoshino et al the cytotoxicity of QDs was dependent on their surface molecules.Citation20 Lovrić et al found that the smaller size of QDs could more readily allow them to enter the cell, nucleus, and possibly other subcellular compartments, thereby causing the more pronounced cytotoxicity.Citation21 Polyethylene glycol (PEG) is inexpensive, nontoxic, nonimmunogenic, and US Food and Drug Administration-approved for many applications. Modifying the surface of nanoparticles with PEG not only prevents agglomeration but also renders nanoparticles resistant to protein adsorption and increases the in vivo circulation time and biocompatibility.Citation22 Ju et alCitation23 inferred that the low toxicity of PEG-coated QDs was due to PEG coating, which can inhibit reactive oxygen species generation on the surface of QDs. Our result also demonstrated that PEG could relieve the hepatotoxicity of ZnO QDs induced by oxidative stress.Citation24
Liver as a reticuloendothelial system can clear the circulating nanoparticles from intravenous exposure route by resident phagocytes.Citation25 Liver is the key organ for detoxification of xenobiotics by metabolism and biliary excretion.Citation26 Lu et alCitation27 confirmed that liver was one of the target organs after postintravenous injection of near-infrared-emitting QDs, and Haque et alCitation28 demonstrated that the liver tissues showed stronger fluorescence of CdSe/CdS-mercaptopropionic acid QDs compared with other tissues (such as lung and kidney) after repeated intraperitoneal treatment for 15 days. Additionally, our previous study found that ZnS and ZnO QDs were both mainly located in the liver after intravenous injection.Citation29 The accumulation and metabolism of QDs may cause toxic and other unwanted effects on liver tissue.
Because incorporating ions or atoms of appropriate elements into host lattices could yield materials with desirable properties and functions, doping has been a widely used technological process for materials.Citation30 The optical behavior of QDs is strongly influenced by dopants; thus, doped QDs are regarded as a new class of luminescent nanomaterials.Citation31 The fluorescence self-quenching of QDs may limit their application in bioanalysis, while doped QDs could avoid the self-quenching problem due to their substantial ensemble Stokes shift.Citation32 Two obvious advantages of doped QDs, especially for doped ZnS QDs, are longer dopant emission lifetime and potentially lower cytotoxicity.Citation32 Mn-doped ZnS QDs elicited no apparent cytotoxicity, even at high concentrations of ~100 mM and 48 hours incubation, in a normal lung fibroblast cell line (L929), a folate receptor-positive nasopharyngeal epidermoid carcinoma cell line (KB), and a folate receptor-negative lung cancer cell line (A549) in vitro.Citation33 Xu et al synthesized glycopolypeptide nanoparticles composed of Mn-doped ZnS QDs as the core and glycopolypeptides as the shell. The glycopolypeptide nanoparticles exhibited not only high loading but also controlled-release behavior and were shown to have low cytotoxicity in HEK293 T-cell lines.Citation34
It is necessary to assess the systemic toxicity of nanoparticles before their application in pharmaceutics and medicine in vivo.Citation35 The present study was designed to synthesize Mn-doped ZnS QDs and to evaluate hepatotoxicity induced by repeated intravenous injection of the QDs in mice.
Materials and methods
Materials
ZnSO4, Na2S, MnCl2, and ethanol were supplied by Tianjin Guangfu Chemical Reagent Co. Ltd. (Tianjin, People’s Republic of China). N,N-dimethyl formamide was purchased from Tianjin Chemical Reagent Co. Ltd. (Tianjin, People’s Republic of China). 1-Ethyl-3-(3-dimethylaminopropyl) carbodiimide hydrochloride was supplied by Shanghai GL Biochem Reagent Co Ltd. (Shanghai, People’s Republic of China). Thioglycolic acid and glutaraldehyde were purchased from Sinopharm Chemical Reagent Co. Ltd. (Shanghai, People’s Republic of China). PEG with hydroxy-terminal (PEG, Mw 2,000) was purchased from Alfa aesar (Tianjin, People’s Republic of China). Dimethylaminopyridine was obtained from Sigma-Aldrich (St Louis, MO, USA). Normal saline (NS, 0.9%) was supplied by Double-crane Pharmaceutical Co. Ltd (Beijing, People’s Republic of China). Deionized water was prepared from EMD Millipore (Billerica, MA, USA). Other reagents used were of analytical grade.
Synthesis of Mn-doped ZnS QDs
Mn-doped ZnS QDs were synthesized following a previously reported methodCitation36 with slight modifications. Briefly, 12.5 mmol ZnSO4, 1 mmol MnCl2, and 40 mL deionized water were stirred at room temperature (~25°C) for 10 minutes, then 12.5 mmol Na2S (dissolved in 10 mL deionized water) was added dropwise. After 30 minutes of stirring, Mn-doped ZnS QDs were obtained by centrifugation (10,000 rpm, 10 minutes, H-2050 R; Xiang Yi Centrifuge Instrument Co. Ltd, Hunan, People’s Republic of China) and washed three times with deionized water. The Mn-doped ZnS QDs were transferred to a two-necked flask and stirred under nitrogen, then 0.625 mmol thioglycolic acid in 10 mL ethanol was added dropwise with vigorous stirring. After a further 20 hours of stirring, the obtained Mn-doped ZnS QDs-COOH was centrifuged (10,000 rpm, 10 minutes) and dispersed in dimethyl formamide. PEG (1.5 mmol), N-(3-dimethylaminopropyl)-N′-ethylcarbodiimide hydrochloride (0.938 mmol), and 4-dimethylaminopyridine (0.156 mmol) were added, and then, the mixture was stirred at 0°C for the first 2 hours and at room temperature for 24 hours. The product, Mn-doped ZnS QDs-PEG, was centrifuged (10,000 rpm, 10 minutes), washed with deionized water and absolute ethanol three times, and then dried under vacuum.
Characterization of Mn-doped ZnS QDs
Transmission electron microscopy (TEM) images were recorded with a JEM-2100 (JEOL, Tokyo, Japan). Absorption spectra were determined using a Puxi TU-1810 visible spectrophotometer (Beijing Puxi Tongyong Instrument Co. Ltd, Beijing, People’s Republic of China). Fluorescence spectra were recorded on an RF-5301PC fluorescence spectrometer (Shimadzu Corporation, Kyoto, Japan). Large-angle powder X-ray diffraction spectra were recorded with X’Pert PRO (PANalytical, Almelo, the Netherlands) using Cu Kα radiation. Fourier transform infrared spectra were determined on a NEXUS 670 Fourier transform infrared spectrometer (Nicolet Instrument Corporation, Madison, WI, USA). The size distribution was determined by dynamic light scattering using a BI-200SM (Brookhaven Instruments Corporation, Holtsville, NY, USA).
Animal treatment
Male Kunming mice (22±1 g) were purchased from the Experimental Animal Center of Lanzhou University (Lanzhou, People’s Republic of China). The animals were maintained at 22°C±1°C and 50%–60% relative humidity under 12 hours light–dark cycle with free access to food and water. For the experiment, animals were injected (NS, 1 mg/kg Mn-doped ZnS QDs, 5 mg/kg Mn-doped ZnS QDs, or 5 mg/kg QDs-PEG) via tail vein for 7 days consecutively with a total volume of 100 µL sample per mouse. After the final injection, six animals were sacrificed at 24 hours and six animals at 28 days. All mice were maintained and used in accordance with the protocols approved by the Ethics Committee of Animal Experiments of Lanzhou University, who also approved this study. All efforts were made to minimize suffering.
Body weight and relative liver weight
Body weights were recorded on alternate days throughout the experiment. The relative liver weight was calculated as the ratio of liver (wet weight, mg) to body weight (g).
Quantification of serum alanine aminotransferase and aspartate aminotransferase activity
Blood samples were collected and centrifuged, and the obtained serum was stored at −20°C until analysis. The aminotransferase (alanine aminotransferase [ALT] and aspartate aminotransferase [AST]) activities in serum were colori-metrically determined using 2,4-dinitrophenylhydrazine at 505 nm according to kit protocols (Nanjing Jiancheng Bioengineering Institute, Nanjing, People’s Republic of China).
Preparation of liver tissue homogenates
The liver extracts were prepared as soon as possible after dissection to avoid drying. Briefly, liver tissues (~500 mg) were homogenized in NS (liver mass/NS =1:9), centrifuged (2,500 rpm, 4°C) for 10 minutes, and then supernatants were collected to analyze the activity of antioxidant enzymes and the level of lipid peroxidation.
Determination of oxidative stress-related enzymes in liver tissue
The activities of the following enzymes were determined according to the kit manufacturer’s protocol (Nanjing Jiancheng Bioengineering Institute, Nanjing, People’s Republic of China).
Catalase
Decomposition of hydrogen peroxide (H2O2) was catalyzed by catalase (CAT) for 60 seconds at 37°C and then terminated by forming stable complexes with ammonium molybdate. The CAT level was calculated at 405 nm.
Glutathione peroxidase
Glutathione (GSH, [1 mmol/L]) was incubated with liver extracts for 5 minutes at 37°C and centrifuged, and the supernatant was collected. The GSH in the supernatant reduced 5,5′-dithiobis 2-nitrobenzoic acid to 2-nitro-5-thiobenzoate anion. The GSH-peroxidase (Px) level was calculated by recording the absorbance of 2-nitro-5-thiobenzoate anion at 412 nm.
Superoxide dismutase
The xanthine/xanthine oxidase system produces free radicals of superoxide anions (O2−•), which can oxidize hydroxylamine to nitrous salt. The function of superoxide dismutase (SOD) is to decompose superoxide anions and inhibit the production of nitrous salt. In the assay, a mauve complex was produced by the reaction of nitrous salt with chromogenic reagent and measured at 550 nm.
Assay of lipid peroxidation levels in liver
MDA is widely used to estimate the level of lipid peroxidation because it is the end product of the pathway. The concentration of MDA was determined according to kit protocols (Nanjing Jiancheng Bioengineering Institute, Nanjing, People’s Republic of China). Liver extracts were reacted with thiobarbituric acid on a boiling water bath for 80 minutes and centrifuged, and the optical density values of the supernatants were determined at 532 nm.
Observation of hepatocyte ultrastructure
The liver sample was fixed using 3% glutaraldehyde in 1/15 phosphate buffer (pH 7.4) for 48 hours at 4°C, postfixed for 1 hour in 1% osmium tetroxide, then dehydrated progressively in ethanol, and embedded in Epon 812. Ultrathin sections were cut, contrasted with uranyl acetate and lead citrate, and then visualized using a JEM-1230 TEM (JEOL).
Statistical analysis
All the data were presented as mean ± standard error of the mean. A one-way analysis of variance followed by the Dunnett’s test for post hoc comparisons was used for the statistical evaluation. A P-value <0.05 was considered statistically significant.
Results
Characterization of Mn-doped ZnS QDs
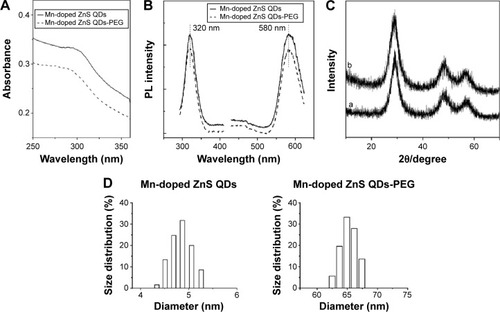
The average diameter of Mn-doped ZnS QDs was ~3.8±0.1 nm according to TEM (). The ultraviolet-visible absorption is shown in , and no obvious change occurred in the absorbance curves after coating with PEG. Photoluminescence spectra of Mn-doped ZnS QDs and QDs-PEG are depicted in , with strong fluorescence centered at 580 nm and the excitation maximum located at 320 nm. The X-ray diffraction peaks of Mn-doped ZnS QDs () correspond to (111), (220), and (311), which indicate a typical cubic structure. According to dynamic light scattering (), the average sizes of Mn-doped ZnS QDs and QDs-PEG were 4.79±0.14 nm and 64.94±0.87 nm, respectively.
Figure 1 Transmission electron microscopy images of Mn-doped ZnS QDs.
Note: Circles indicate Mn-doped ZnS QDs.
Abbreviation: QDs, quantum dots.
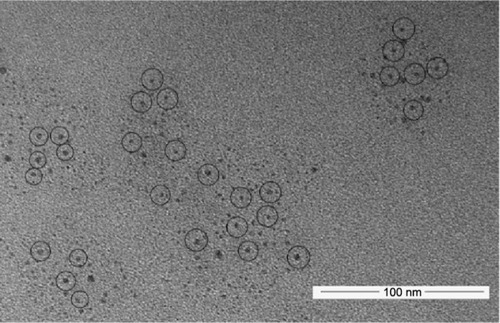
Figure 2 Characterization of Mn-doped ZnS QDs and Mn-doped ZnS QDs-PEG.
Notes: (A) UV-vis absorption, (B) PL spectra, and (C) XRD patterns of (a) Mn-doped ZnS QDs, (b) Mn-doped ZnS QDs-PEG, and (D) size distribution (DLS).
Abbreviations: DLS, dynamic light scattering; PEG, polyethylene glycol; PL, photoluminescence; QDs, quantum dots; UV-vis, ultraviolet-visible; XRD, X-ray powder diffraction.
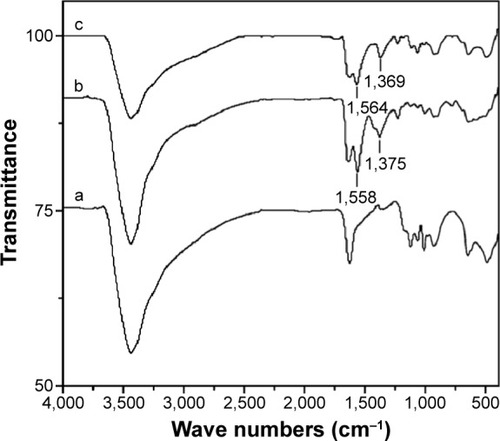
The Fourier transform infrared spectra shown in were used to determine the successful incorporation of PEG. The new peaks at 1,558 cm−1 and 1,375 cm−1 appearing in were associated with C=O stretching and C–H bending vibrations, respectively, suggesting the successful reaction between Mn-doped ZnS QDs and thioglycolic acid. The absorption peaks at 1,564 cm−1 () correspond to ester groups, indicating the successful conjugation of PEG and Mn-doped ZnS QDs-COOH.
Figure 3 FTIR spectra of (a) Mn-doped ZnS QDs, (b) Mn-doped ZnS QDs-COOH, and (c) Mn-doped ZnS QDs-PEG.
Abbreviations: FTIR, Fourier transform infrared; PEG, polyethylene glycol; QDs, quantum dots.
Body weight and relative liver weight
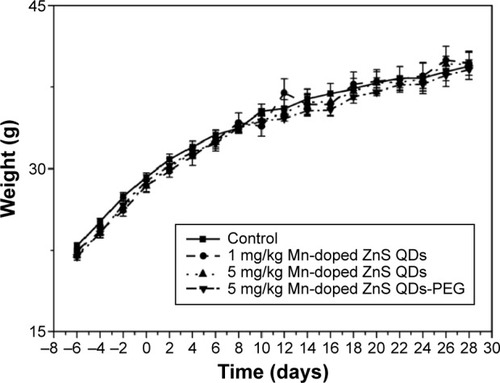
After administration of Mn-doped ZnS QDs and QDs-PEG, no unusual changes in daily behavior such as eating, drinking, moving, or hunching were observed. The animal body weights were recorded throughout the experiment of 7 days injection and 28 days postinjection (). There was no significant difference between the Mn-doped ZnS QDs and QDs-PEG-treated groups compared to the control group (from 22.88±0.28 g to 39.46±1.25 g). The relative liver weight in control, Mn-doped ZnS QDs, and QDs-PEG-treated groups is given in . All data from the treated groups were similar to those of the control group (55.89±3.72 mg/g for 24 hours and 47.26±1.23 mg/g for 28 days).
Table 1 Relative liver weight of mice at 24 hours and 28 days after consecutive intravenous injection of Mn-doped ZnS QDs and Mn-doped ZnS QDs-PEG
Figure 4 Body weight of mice after 7 days consecutive intravenous injection with Mn-doped ZnS QDs and Mn-doped ZnS QDs-PEG.
Notes: The “0” day was the day on which injection was completed. All data are presented as mean ± standard error of the mean (n=6).
Abbreviations: PEG, polyethylene glycol; QDs, quantum dots.
Serum aminotransferase analysis
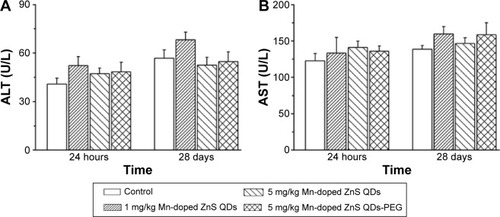
Liver injury was assessed by determining the activity of serum aminotransferases (ALT and AST). At 24 hours and 28 days postinjection, no significant change of ALT or AST activities () was observed after administration of Mn-doped ZnS QDs or QDs-PEG.
Figure 5 Serum aminotransferase levels after intravenous injection with Mn-doped ZnS QDs and Mn-doped ZnS QDs-PEG with different concentrations at 24 hours and 28 days.
Notes: (A) ALT and (B) AST. All data are presented as mean ± SEM (n=6).
Abbreviations: ALT, alanine aminotransferase; AST, aspartate aminotransferase; PEG, polyethylene glycol; QDs, quantum dots; SEM, standard error of the mean.
Antioxidant enzyme activity in the liver
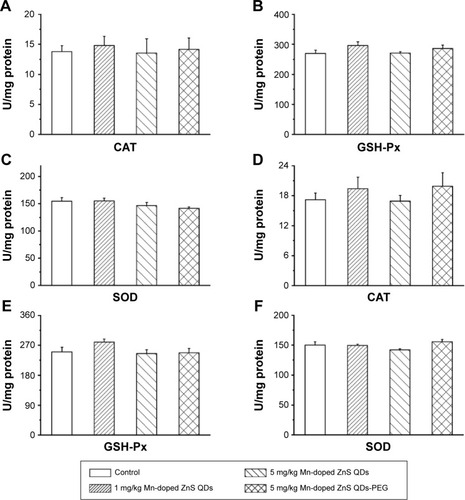
We examined antioxidant enzyme activity in the liver by the analysis of CAT, GSH-Px, and SOD activities (). At 24 hours and 28 days postinjection, neither 1 mg/kg nor 5 mg/kg of Mn-doped ZnS QDs induced a significant change in the activities of these antioxidant enzymes compared with control (CAT: 13.80±0.96 U/mg protein, GSH-Px: 269.53±10.57 U/mg protein, SOD: 154.39±6.62 U/mg protein for 24 hours, and CAT: 17.19±1.33 U/mg protein, GSH-Px: 249.93±14.07 U/mg protein, SOD 150.03±5.51 U/mg protein for 28 days). All the enzyme activities in the Mn-doped ZnS QDs-PEG-treated group were within normal ranges at both 24 hours and 28 days.
Figure 6 Levels of CAT, GSH-Px, and SOD in the liver of mice treated with Mn-doped ZnS QDs and Mn-doped ZnS QDs-PEG at time points of 24 hours (A–C) and 28 days (D–F).
Note: All data are presented as mean ± SEM (n=6).
Abbreviations: CAT, catalase; GSH-Px, glutathione peroxidase; PEG, polyethylene glycol; QDs, quantum dots; SEM, standard error of the mean; SOD, superoxide dismutase.
Lipid peroxidation assay
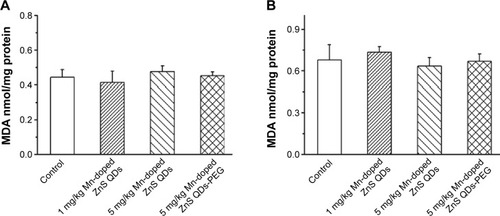
The level of lipid peroxidation was assessed by determining the concentration of MDA (). Compared with the control group (0.44±0.04 nmol/mg protein at 24 hours and 0.68±0.11 nmol/mg protein at 28 days), Mn-doped ZnS QDs and QDs-PEG did not affect the levels of MDA at either 24 hours or 28 days.
Figure 7 MDA levels in the liver of mice treated with Mn-doped ZnS QDs and Mn-doped ZnS QDs-PEG at 24 hours (A) and 28 days (B).
Note: All data are presented as mean ± SEM (n=6).
Abbreviations: MDA, malondialdehyde; PEG, polyethylene glycol; QDs, quantum dots; SEM, standard error of the mean.
Observation of hepatocyte ultrastructure
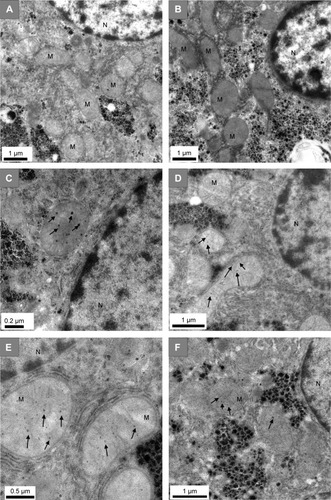
shows the hepatic cell ultrastructure after treatment with NS (control), 5 mg/kg Mn-doped ZnS QDs, and QDs-PEG. The hepatic cells of the control group contained elliptical nuclei with homogeneous chromatin and clear cristae in the mitochondria at both 24 hours () and 28 days (). After Mn-doped ZnS QDs treatment, QDs were located in mitochondria at 24 hours (). After 28 days, Mn-doped ZnS QDs were mainly distributed in mitochondria and also detected in lysosomes and lipid droplets (). Mn-doped ZnS QDs-PEG mainly distributed in the mitochondria at both 24 hours () and 28 days (). Neither Mn-doped ZnS QDs nor QDs-PEG caused damage to the cell nuclei or mitochondria during the entire experiment.
Figure 8 Ultrastructure of hepatocyte after treatment with control (A: 24 hours, B: 28 days), 5 mg/kg of Mn-doped ZnS QDs (C: 24 hours, D: 28 days), and Mn-doped ZnS QDs-PEG (E: 24 hours, F: 28 days).
Note: Arrows indicate Mn-doped ZnS QDs.
Abbreviations: PEG, polyethylene glycol; QDs, quantum dots; N, nucleus; M, mitochondria.
Discussion
Mn-doped ZnS QDs are potentially useful in biological labeling and drug delivery because of their small size and fluorescence properties. However, their behavior in vivo must be assessed before their clinical application. We have investigated the potential for hepatotoxicity induced by repeated intravenous injection of Mn-doped ZnS QDs in this study. Animal body weight did not change throughout the treatment and postinjection periods. Mn-doped ZnS QDs did not affect the relative liver weight or the levels of serum aminotransferases. Antioxidant enzyme activity and MDA were also unchanged during the entire experiment. Analysis of the hepatic cell ultrastructure showed that neither Mn-doped ZnS QDs nor QDs-PEG caused damage to cell nuclei or mitochondria.
Su et alCitation14 and Xiong et alCitation37 have shown that fluctuation of body weight is a useful indicator for qualitatively assessing in vivo toxicity of compounds. Body weight was recorded every other day throughout our experiment, and the results showed that Mn-doped ZnS QDs did not have any effect compared to controls. In order to exclude the influence of factors such as age, malnutrition, or water on body weight, relative organ weightCitation38 was further used to assess hepatotoxicity induced by Mn-doped ZnS QDs in mice. Treatment with Mn-doped ZnS QDs for seven consecutive days did not influence the relative liver weight at either 24 hours or 28 days after injection, indicating that Mn-doped ZnS QDs do not cause liver damage in mice. This result is in accordance with our previous report that ZnS QDs did not cause noticeable toxicity in mice.Citation29
The levels of serum aminotransferases (ALT and AST) correspond well with the extent of liver cell damage and are commonly used as indicators of liver function. In liver cells, ALT is mainly found in the cytoplasm and is sensitive to acute hepatocyte injury induced by drugs or alcohol. AST is mainly found in the cytoplasm and mitochondria, and the levels are increased in chronic hepatitis and liver cirrhosis.Citation39 Our study found that Mn-doped ZnS QDs did not affect the levels of ALT or AST in serum, suggesting that repeat injection with Mn-doped ZnS QDs did not cause obvious damage to the liver.
Lots of different mechanisms were involved in the toxicity of nanomaterials, and the primary reason was the induction of oxidative stress.Citation40 The high surface energy and electron–hole of nanomaterials enhance their reactivity. The combination of nanomaterials with biological components, such as lipid and protein, can induce the generation of reactive oxygen species. Reports have shown that the toxicity of many nanomaterials, such as TiO2,Citation41,Citation42 Fe2O3, and CuO nanoparticles,Citation43 is caused by the generation of oxidative stress. Enzymatic antioxidant systems, including CAT, GSH-Px, and SOD, are an important mechanism for the elimination of free radicals in vivo.Citation44 In this study, the activity of antioxidant enzymes was analyzed to assess the effect of repeated injection of Mn-doped ZnS QDs on oxidative stress. The results showed that Mn-doped ZnS QDs did not influence the levels of CAT, GSH-Px, or SOD, indicating that these QDs do not induce oxidative damage in the liver. In addition, Mn-doped ZnS QDs caused no apparent change in the levels of MDA, a product of lipid peroxidation. Our previous report showed that ZnO QDs induced oxidative stress under the same conditions,Citation24 suggesting that Mn-doped ZnS QDs have lower toxicity than ZnO QDs.
The effect on ultrastructure of hepatic cells was also investigated in this study, using TEM. At 24 hours after injection, Mn-doped ZnS QDs and QDs-PEG were mainly accumulated in mitochondria. At 28 days, a portion of Mn-doped ZnS QDs shifted to lysosomes and lipid droplets, whereas Mn-doped ZnS QDs-PEG still distributed to the mitochondria. Moreover, Mn-doped ZnS QDs did not change cell morphology, chromosomes, or nuclei at 24 hours and 28 days, suggesting that the accumulation of QDs in the liver does not cause obvious tissue damage.
Conclusion
In this study, Mn-doped ZnS QDs and QDs-PEG were synthesized and administered daily to mice by intravenous injection for 7 days to evaluate their hepatotoxicity. Body weight, relative liver weight, and serum aminotransferases were not affected by the Mn-doped ZnS QDs or QDs-PEG, indicating that these QDs did not cause obvious damage to the liver. The levels of CAT, GSH-Px, SOD, and MDA were analyzed, and the results indicated that the QDs did not cause oxidative stress in the liver. The results of hepatocyte ultrastructure analysis demonstrated that Mn-doped ZnS QDs and QDs-PEG had no effect on cell structure and that they were mainly located in mitochondria at both 24 hours and 28 days after injection.
Acknowledgments
This study was supported by research funds from the National Natural Science Foundation of China (grant number 21375052).
Disclosure
The authors report no conflicts of interest in this work.
References
- AzzazyHMMansourMMKazmierczakSCFrom diagnostics to therapy: prospects of quantum dotsClin Biochem2007401391792717689518
- TangSAllagaddaVChibliHNadeauJLMayerGDComparison of cytotoxicity and expression of metal regulatory genes in zebrafish (Danio rerio) liver cells exposed to cadmium sulfate, zinc sulfate and quantum dotsMetallomics20135101411142223912858
- ChanWCMaxwellDJGaoXBaileyREHanMNieSLuminescent quantum dots for multiplexed biological detection and imagingCurr Opin Biotechnol2002131404611849956
- PengLHeMChenBCellular uptake, elimination and toxicity of CdSe/ZnS quantum dots in HepG2 cellsBiomaterials201334379545955824011712
- DerfusAMChanWCBhatiaSNIntracellular delivery of quantum dots for live cell labeling and organelle trackingAdv Mater20041612961966
- KaufferF-AMerlinCBalanLSchneiderRIncidence of the core composition on the stability, the ROS production and the toxicity of CdSe quantum dotsJ Hazard Mater201426824625524509095
- LiuWZhangSWangLCdSe quantum dot (QD)-induced morphological and functional impairments to liver in micePLoS One201169e2440621980346
- BilanRFleuryFNabievISukhanovaAQuantum dot surface chemistry and functionalization for cell targeting and imagingBioconjug Chem201526460962425710410
- LinGWangXYinFYongK-TPassive tumor targeting and imaging by using mercaptosuccinic acid-coated near-infrared quantum dotsInt J Nanomedicine20151033534525609948
- CliftMJBoylesMSBrownDMStoneVAn investigation into the potential for different surface-coated quantum dots to cause oxidative stress and affect macrophage cell signalling in vitroNanotoxicology20104213914920795892
- AsharaniPLianwuYGongZValiyaveettilSComparison of the toxicity of silver, gold and platinum nanoparticles in developing zebrafish embryosNanotoxicology201151435421417687
- ScownTMSantosEMJohnstonBDEffects of aqueous exposure to silver nanoparticles of different sizes in rainbow troutToxicol Sci2010115252153420219766
- LeighKBouldinJBuchananREffects of exposure to semiconductor nanoparticles on aquatic organismsJ Toxicol2012201239765722131989
- SuYPengFJiangZIn vivo distribution, pharmacokinetics, and toxicity of aqueous synthesized cadmium-containing quantum dotsBiomaterials201132255855586221601920
- HauckTSAndersonREFischerHCNewbiggingSChanWCIn vivo quantum – dot toxicity assessmentSmall20106113814419743433
- WangY-WYangKTangHChenDBaiY-LToxicity assessment of repeated intravenous injections of arginine–glycine–aspartic acid peptide conjugated CdSeTe/ZnS quantum dots in miceInt J Nanomedicine201494809481725378922
- ZhangYZhangYHongGBiodistribution, pharmacokinetics and toxicology of Ag2S near-infrared quantum dots in miceBiomaterials201334143639364623415643
- LinCHYangMHChangLWCd/Se/Te-based quantum dot 705 modulated redox homeostasis with hepatotoxicity in miceNanotoxicology20115465066321142715
- ParkSChibliHNadeauJSolubilization and bio-conjugation of quantum dots and bacterial toxicity assays by growth curve and plate countJ Vis Exp201265e396922824953
- HoshinoAFujiokaKOkuTPhysicochemical properties and cellular toxicity of nanocrystal quantum dots depend on their surface modificationNano Lett200441121632169
- LovrićJBazziHSCuieYFortinGRWinnikFMMaysingerDDifferences in subcellular distribution and toxicity of green and red emitting CdTe quantum dotsJ Mol Med (Berl)200583537738515688234
- ManoSSKanehiraKSonezakiSTaniguchiAEffect of polyethylene glycol modification of TiO2 nanoparticles on cytotoxicity and gene expressions in human cell linesInt J Mol Sci20121333703371722489177
- JuLZhangGZhangCQuantum dot-related genotoxicity perturbation can be attenuated by PEG encapsulationMutat Res20137531546423416234
- YangYZhaoTChengTHepatotoxicity induced by ZnO quantum dots in miceRSC Adv201441156425648
- ShaBGaoWWangSOxidative stress increased hepatotoxicity induced by nano-titanium dioxide in BRL-3A cells and Sprague-Dawley ratsJ Appl Toxicol20133434535623873220
- LiangXGriceJEZhuYIntravital multiphoton imaging of the selective uptake of water-dispersible quantum dots into sinusoidal liver cellsSmall201511141711172025504510
- LuYSuYZhouYIn vivo behavior of near infrared-emitting quantum dotsBiomaterials201334174302430823489928
- HaqueMImHYSeoJEHasanMWooKKwonOSAcute toxicity and tissue distribution of CdSe/CdS-MPA quantum dots after repeated intraperitoneal injection to miceJ Appl Toxicol201333994095022733552
- YangYLanJXuZToxicity and biodistribution of aqueous synthesized ZnS and ZnO quantum dots in miceNanotoxicology20148110711623245670
- BryanJDGamelinDRDoped semiconductor nanocrystals: synthesis, characterization, physical properties, and applicationsProg Inorg Chem20055447126
- BolAMeijerinkADoped semiconductor nanoparticles – a new class of luminescent materials?J Lumin200087315318
- WuPYanX-PDoped quantum dots for chemo/biosensing and bioimagingChem Soc Rev201342125489552123525298
- ManzoorKJohnySThomasDSetuaSMenonDNairSBio-conjugated luminescent quantum dots of doped ZnS: a cyto-friendly system for targeted cancer imagingNanotechnology200920606510219417370
- XuZLiBTangWChenTZhangHWangQGlycopolypeptide- encapsulated Mn-doped ZnS quantum dots for drug delivery: fabrication, characterization, and in vitro assessmentColloids Surf B Biointerfaces2011881515721764270
- EiflerACThaxtonCSNanoparticle therapeutics: FDA approval, clinical trials, regulatory pathways, and case studyMethods Mol Biol201172632533821424459
- WangH-FHeYJiT-RYanX-PSurface molecular imprinting on Mn-doped ZnS quantum dots for room-temperature phosphorescence optosensing of pentachlorophenol in waterAnal Chem20098141615162119170523
- XiongLYangTYangYXuCLiFLong-term in vivo biodistribution imaging and toxicity of polyacrylic acid-coated upconversion nanophosphorsBiomaterials201031277078708520619791
- WangCCaoMShiDXA 90-day subchronic toxicity study of neem oil, a Azadirachta indica oil, in miceHum Exp Toxicol201332990491323444337
- ZhangX-DWuDShenXLiuP-XFanF-YFanS-JIn vivo renal clearance, biodistribution, toxicity of gold nanoclustersBiomaterials201233184628463822459191
- SharmaVSinghPPandeyAKDhawanAInduction of oxidative stress, DNA damage and apoptosis in mouse liver after sub-acute oral exposure to zinc oxide nanoparticlesMutat Res20127451849122198329
- SayesCMWahiRKurianPACorrelating nanoscale titania structure with toxicity: a cytotoxicity and inflammatory response study with human dermal fibroblasts and human lung epithelial cellsToxicol Sci200692117418516613837
- Braydich-StolleLKSchaeublinNMMurdockRCCrystal structure mediates mode of cell death in TiO2 nanotoxicityJ Nano Res200911613611374
- FahmyBCormierSACopper oxide nanoparticles induce oxidative stress and cytotoxicity in airway epithelial cellsToxicol In Vitro20092371365137119699289
- SimkóMGazsóAFiedelerUNentwichMNanoparticles, free radicals and oxidative stressNano Trust Dossiers20111213