
Abstract
Purpose
To compare optic nerve head (ONH) measurements in glaucomatous eyes with paracentral visual field (VF) loss to eyes with peripheral VF loss and controls.
Methods
Open-angle glaucoma (OAG) patients with early paracentral VF loss or isolated peripheral VF loss as well as control subjects underwent ONH imaging with swept-source optical coherence tomography (OCT) and retinal nerve fiber layer (RNFL) imaging with spectral-domain OCT. Minimum rim width at Bruch’s membrane opening (BMO-MRW), lamina cribrosa depth (LCD), and RNFL thickness were compared among the glaucoma and control groups with one-way analysis of variance, Kruskal–Wallis test, and multiple regression analysis.
Results
Twenty-nine eyes from 29 OAG patients (15 early paracentral and 14 isolated peripheral VF loss) and 20 eyes of 20 control subjects were included. The early paracentral and isolated peripheral VF loss groups had similar VF mean deviation (MD) (−5.3±2.7 dB and −3.7±3.0 dB, p=0.15, respectively). Global BMO-MRW was lower in OAG eyes than in controls (193.8±40.0 vs 322.7±62.2 μm, p<0.001), but similar between eyes with early paracentral VF loss and those with isolated peripheral VF loss (187.6±43.4 vs 200.6±36.3 μm; p>0.99). In contrast, the minimal BMO-MRW was lower in eyes with early paracentral loss (69.0±33.6 μm) than in eyes with isolated peripheral loss (107.7±40.2 μm; p=0.03) or control eyes (200.1±40.8 μm; p<0.001). Average and thinnest RNFL thickness did not differ between OAG groups (p=0.61 and 0.19, respectively). Horizontal and vertical LCD did not differ among the OAG groups and controls (p=0.80 and 0.82, respectively). Multivariable linear regression analysis among OAG cases confirmed the association between lower minimal BMO-MRW and early paracentral VF loss (β=−38.3 μm; 95% confidence interval, −69.8 to −6.8 μm; p=0.02) after adjusting for age, gender, MD, and disc size.
Conclusion
Thin minimal BMO-MRW may represent a new structural biomarker associated with early glaucomatous paracentral VF loss.
Introduction
Glaucoma is a heterogeneous group of disorders characterized by progressive degeneration of retinal ganglion cells and their axons, leading to cupping of the optic nerve head (ONH) with various patterns of visual field (VF) loss.Citation1,Citation2 Functionally, patients with paracentral VF loss can have significant decline in quality of lifeCitation3 and delayed reaction, while patients with peripheral VF loss increase visual scanning to compensate when driving.Citation4
Clinically, the optic nerve in patients with paracentral VF loss tends to show localized damage, consisting of disc hemorrhage,Citation5 focal narrowing of the rim,Citation6 and acquired optic nerve pits.Citation7 The structural damage associated with paracentral VF loss has been quantified with spectral-domain optical coherence tomography (SD-OCT), which showed localized loss of retinal nerve fiber layer (RNFL) thickness and thinning of macular inner retinal layer compared to eyes with peripheral VF loss.Citation8
Swept-source optical coherence tomography (SS-OCT) is a novel imaging technology, with higher scanning speed, longer wavelength, and improved signal detection than SD-OCT, achieving better simultaneous imaging of both superficial and deep tissue structures.Citation9 These features improve visualization and quantification of localized and subtle glaucomatous changes of the ONH.
Novel quantitative parameters have emerged with improved imaging technologies. The minimum rim width at Bruch’s membrane opening (BMO-MRW), defined as the minimal distance between the termination of BMO and the internal limiting membrane within each radial scan of the ONH,Citation10 provides a surrogate measure for the number of axons entering the ONH.Citation11 Associations between BMO-MRW and VF sensitivity were demonstrated to be stronger than other RNFL and ONH parameters,Citation12 particularly in the later stages of glaucoma.Citation13 Another new parameter is the lamina cribrosa depth (LCD), which describes the posterior displacement of the lamina cribrosa (LC) and is defined as the average distance between a reference line connecting the two termination points of Bruch’s membrane at the ONH and the anterior LC surface.Citation14 Greater LCD was found in glaucoma patients compared to control subjects, and this parameter may vary in different optic disc phenotypes of open-angle glaucoma (OAG).Citation15,Citation16
In this study, we used SS-OCT to measure and compare the prelaminar and laminar ONH tissues in eyes with OAG and control eyes, aiming to identify novel quantitative parameters (biomarkers) associated with glaucomatous paracentral VF loss.
Subjects and methods
This was a prospective, cross-sectional study, approved by the Institutional Review Boards of Massachusetts Eye and Ear (MEE) in accordance with Health Insurance Portability and Accountability Act regulations, and it adhered to the tenets of the Declaration of Helsinki. Each study subject provided written informed consent.
Description of the study sample
Adult patients of European and African descent aged between 30 and 90 years were recruited for this study. Some subjects were part of a prior study by this group comparing SS-OCT and EDI-OCT in measuring quantitative parameters of the ONH.Citation17
Definition of OAG and control groups
Patients with OAG were recruited from the Glaucoma Consultation Service of MEE. These patients had best-corrected visual acuity of at least 20/40, open angles on gonioscopy, a clinical diagnosis of OAG with reproducible VF loss, and corresponding glaucomatous optic nerve damage. Only patients with reliable Humphrey visual field (HVF) tests (fixation loss ≤33%, false-positive rate ≤20% and false-negative rate ≤20%) were included. Patients with previous penetrating glaucoma surgeries (trabeculectomies and glaucoma drainage devices), optic disc torsion more than 15°, or tilt ratio >1.3 (maximum to minimum optic disc diameter) were excluded.Citation18,Citation19
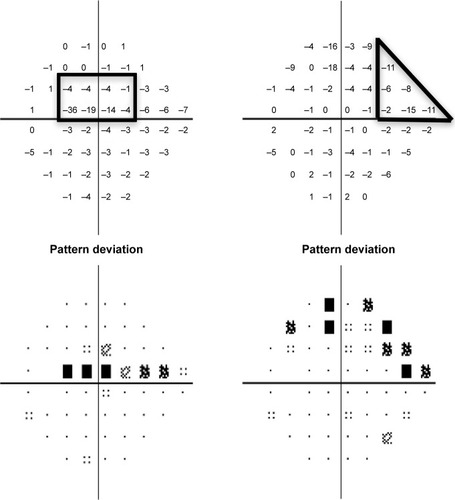
For each OAG patient, the HVF (Swedish Interactive Threshold Algorithm standard, 24-2) dated within 1 year of the imaging date was reviewed independently by two glaucoma specialists (LRP and LQS) and classified into two categories, as described previouslyCitation20 and outlined briefly here. Each defect comprised of a cluster of three or more contiguous points on the pattern deviation plot with retinal sensitivity depression worse than −5 dB at each point (). Early paracentral loss was defined as a VF defect located within the central 10°, either in the superior or in the inferior hemifield, with or without involvement of the peripheral region in the same hemifield. An isolated peripheral loss involved the Bjerrum areas, nasal step, or temporal wedge zones in the superior and/or inferior hemifield, without affecting the central 10°.
Figure 1 Examples of patterns of VF loss on HVFs (Swedish Interactive Threshold Algorithm 24-2) as defined in this study.
Abbreviations: VF, visual field; HVF, Humphrey visual field.
Control subjects were recruited from the Comprehensive Ophthalmology and Cataract Consultation Service of MEE and were age-matched to OAG cases by decade. The control eyes had best corrected visual acuity of at least 20/40, intraocular pressure (IOP) lower than 22 mmHg, and normal optic nerves (defined as cup-to-disc ratio ≤0.6 in both eyes and cup-to-disc ratio asymmetry <0.2). Patients with family history of glaucoma, any evidence or suspicion of glaucoma (such as abnormality on peripapillary RNFL profile on SD-OCT), ocular hypertension, or significant retinal pathology were excluded. Control subjects did not undergo VF testing.
Image acquisition
The eyes of all subjects were dilated to obtain images with the best quality. A commercially available SS-OCT (Deep Range Imaging OCT-1; Topcon, Tokyo, Japan) was used to image both eyes of all subjects. The device uses a wavelength-sweeping laser, with a center wavelength of 1,050 nm, and acquires 100,000 A-scans/sec with 8 μm axial resolution.Citation21,Citation22 The imaging protocol included a radial B-scan pattern, consisting of 12 sequential sections, and a five-line cross B-scan pattern, consisting of five sequential vertical and five sequential horizontal sections spaced 250 μm apart, all centered on the optic disc. Each image has 32 image frames averaged. At the same visit, peripapillary RNFL thickness was obtained with SD-OCT (Spectralis; Heidelberg Engineering, Heidelberg, Germany). Digital disc photographs (Visucam Pro NM; Carl Zeiss, Meditec, Dublin, CA, USA) were taken in subjects who did not have photos within 12 months of OCT imaging.
Imaging analysis
Two observers (EVT and DL) independently performed measurements of quantitative prelaminar and laminar parameters using customized ImageJ (ImageJ, US National Institutes of Health, Bethesda, MD, USA) plugins. The BMO-MRW was measured within the ONH from radial B-scans. As previously described,Citation17 the internal limiting membrane was automatically delineated, and BMO was manually identified. Subsequently, the minimum distance from BMO to internal limiting membrane was automatically identified and calculated on each side of the 12 radial scans (total of 24 measurements per eye). The global BMO-MRW was the average of 24 measurements; the minimal BMO-MRW () was the lowest value among these 24 measurements of BMO-MRW per eye; the minimal sector BMO-MRW was the lowest value among the 6 sectors, which were obtained by averaging the BMO-MRW measurements of all scans in each sector (Figure S1). In addition, scaled BMO-MRW normalized by disc circumference was calculated according to a published method.Citation23
Figure 2 Quantitative assessment of the ONH with SS-OCT in an eye with early paracentral loss and in an eye with isolated peripheral loss.
Abbreviations: BMO-MRW, minimum rim width at Bruch’s membrane opening; LCDH, horizontal lamina cribrosa depth; LCDV, vertical lamina cribrosa depth; ONH, optic nerve head; RNFL, retinal nerve fiber layer; HVF, Humphrey visual field; SS-OCT, swept-source optical coherence tomography; SD-OCT, spectral-domain optical coherence tomography.
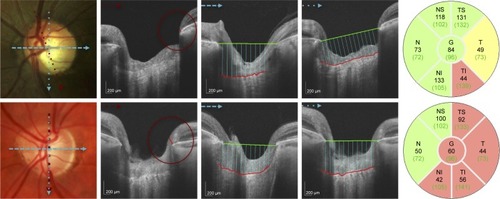
The LCD was measured in one horizontal and in one vertical scan, which were selected from all scans at 90° and 180° for the best visualization of the anterior LC surface and best centration.Citation17 After the manual delineation of the anterior surface of LC, a reference line connecting BMO was drawn. An ImageJ plugin calculated the perpendicular distance from the reference line to the anterior surface of LC every 100 μm along the reference line () and generated the mean measurement.
Average RNFL thickness and thinnest clock-hour sector of RNFL thickness were extracted from SD-OCT RNFL profile plot.
Statistical analysis
Only one eye per subject was included in the analysis. If both eyes were eligible, the right eye was used for control subjects and eyes with matching VF mean deviation (MD) were used for glaucoma patients. Statistical analysis was performed with the Statistical Package for the Social Sciences (SPSS, v.17, Chicago, IL, USA). The normality of continuous variables was assessed with the Kolmogorov–Smirnov test. Quantitative variables were expressed as mean ± standard deviation (SD) and qualitative variables as percentages. Comparison between groups was performed with one-way analysis of variance for normally distributed variables and Kruskal–Wallis test for nonnormally distributed variables. For quantitative parameters, interobserver agreement was assessed using intraclass correlation coefficient. Statistical significance was assumed at p≤0.05 level, and Bonferroni correction was applied to correct α error for multiple comparisons. Among OAG cases, a multivariate linear regression model was built with minimal BMO-MRW as the dependent variable and the type of VF loss as the main predictor. The model was adjusted for age, gender, VF MD, and BMO circumference.
Results
Forty-nine subjects (29 patients with OAG and 20 controls) were included in this study. The mean ± standard deviation age was 65.7±9.0 years for OAG patients and 66.6±7.1 years for control subjects (p=0.72). In OAG subgroups, patients with early paracentral loss were younger than patients with isolated peripheral loss (61.9±6.3 vs 69.8±9.9 years, p=0.03, ). Ninety-three percent of OAG patients and 95.0% of control subjects were White (p=0.96); no significant difference in ethnicity was found among the OAG subgroups. The mean IOP measured by Goldmann applanation tonometry on the day of imaging was 13.8±2.7 mmHg in OAG eyes, and 14.4±2.2 mmHg in controls (p=0.41); no difference was found among OAG subgroups (p>0.99). The untreated maximum IOP was available in 48 (97.9%) of 49 subjects; it was 19.8±3.4 mmHg in OAG eyes and 15.4±1.8 mmHg in controls (p=0.0001), with no difference between glaucoma subgroups (p=0.84). The HVF MD was −5.3±2.7 dB in the early paracentral loss group and −3.7±3.0 dB in the isolated peripheral loss group (p=0.15).
Table 1 Clinical characteristics among the studied groups
Interobserver agreement was very good for all measured parameters: intraclass correlation coefficient was 0.98, 0.94, 0.93, and 0.96 for global BMO-MRW, minimal BMO-MRW, horizontal LCD, and vertical LCD, respectively.Citation17 All radial images were of adequate quality for BMO-MRW measurements. In 36.2% of the radial images, the LC was not visible and the five-line images were used instead for LCD measurements.
Mean global BMO-MRW was lower in glaucomatous eyes than in control eyes (193.8±40.0 vs 322.7±62.2 μm, p=0.0001) and similar between eyes with early paracentral loss and those with isolated peripheral loss (187.6±43.4 vs 200.6±36.3 μm; p>0.99). Similar findings were obtained with scaled global BMO-MRW (). The minimal sector BMO-MRW was lowest in eyes with early paracentral loss (109.3±38.2 μm), which differed from the control group (229.1±44.1 μm, p<0.001) but not from the eyes with isolated peripheral loss (139.3±39.5 μm, p=0.17). This was also observed with scaled minimal sector BMO-MRW.
Table 2 Quantitative parameters among the studied group
The minimal BMO-MRW was 200.1±40.8 μm in control eyes and 87.7±41.2 μm in OAG eyes (p=0.0001). Eyes with early paracentral loss () had significantly lower minimal BMO-MRW than eyes with isolated peripheral loss (69.0±33.6 vs 107.7±40.2 μm, p=0.03). Similarly, low scaled minimal BMO-MRW distinguished eyes with paracentral loss from eyes with isolated peripheral loss (p=0.04) and control eyes (p=0.0001, ). The location of the minimal BMO-MRW was the temporal quadrant in 90% of the control eyes. In eyes with early paracentral loss, the minimal BMO-MRW was located in the inferior quadrant (including inferior-temporal and inferior-nasal) (80%), temporal quadrant (13.3%), or superior-temporal quadrant (6.7%) in that order; 86.7% of all minimal BMO-MRW locations corresponded to the VF defect location. In eyes with isolated peripheral loss, the minimal BMO-MRW was located in the inferior quadrant (57.1%), temporal quadrant (21.4%), superior-temporal quadrant (14.3%), and nasal quadrant (7.1%); 35.7% of all locations corresponded to the hemifield with more severe VF defect (p=0.008 compared to correspondence in early paracentral VF loss).
The mean horizontal LCD was 433.5±94.6 μm in control eyes and 440.8±109.9 μm in OAG eyes (p=0.80), while the mean vertical LCD was 448.8±105.2 μm in controls eyes and 455.7±94.3 μm in OAG eyes (p=0.82). Neither parameter was significantly different among the OAG subgroups (p>0.19 for all, ).
The average RNFL thickness measured with SD-OCT was 96.6±10.4 μm in control eyes and 73.1±12.3 μm in OAG eyes (p=0.0001, ); eyes with early paracentral loss were not significantly different than eyes with isolated peripheral loss (p=0.61); and neither was the thinnest RNFL thickness (p=0.19).
The association between minimal BMO-MRW and paracentral VF loss was further assessed in multiple regression analysis of OAG groups; eyes with isolated peripheral loss served as the reference group. Low minimal BMO-MRW was significantly associated with early paracentral loss (β=−38.3 μm; 95% confidence interval, −69.8 to −6.8 μm; p=0.02, ), after adjusting for age (p=0.86), gender (p=0.08), VF MD (p=0.21), and BMO circumference (p=0.02). A previous report suggest that linear conversion of MD is required to correlate structure with function, as MD is derived from logarithmic scale.Citation11 In our study, linearization of VF MD did not change the outcome of the multiple regression model, and thus the effect of early paracentral loss on minimal BMO-MRW remained significant (β=−36.1 μm; 95% confidence interval, −66.5 to −5.7 μm; p=0.02), after adjusting for age (p=0.74), gender (p=0.07), and linearized VF MD (p=0.17). There is an association between lower minimal BMO-MRW and lower BMO circumference (p=0.01).
Table 3 Multivariate linear regression for the measurement of minimal BMO-MRW
Discussion
Glaucomatous optic nerve damage manifests in different patterns of VF loss, sometimes involving the central vision early during the course of the disease. In this study, we focused on eyes with early paracentral loss (ie, VF loss within the central 10° with or without peripheral loss in the same hemifield) instead of isolated paracentral loss,Citation5 as glaucomatous paracentral scotomas are usually accompanied by some degrees of peripheral loss in the same hemifield. This was demonstrated by a previous study, which computationally identified VF loss patterns from a database comprised of 13,231 HVFs from the same practice.Citation24 Furthermore, systemic and genetic factors associated with paracentral scotoma have been identified using similar VF criteria.Citation20,Citation25 In this prospective study, with the aid of SS-OCT, we identified prelaminar pathology, in particular thin minimal BMO-MRW to be more common in patients with early paracentral VF loss than in those with isolated peripheral VF loss. Using multivariate regression analysis, we demonstrated that the association between thin minimal BMO-MRW and paracentral loss was independent of VF severity.
Our study supports the use of minimal BMO-MRW as a quantitative parameter in glaucoma evaluation. The parameter BMO-MRW, unlike the clinically used rim area, which is based on clinical disc margin, relies on BMO. It provides a good surrogate for the number of axons entering the ONH,Citation11 and may have better sensitivity and specificity for glaucoma detection than RNFL-based parameters.Citation26,Citation27 In this study, we found that global BMO-MRW was significantly affected in glaucomatous eyes compared to that in controls; this is consistent with the literature.Citation26 Furthermore, OAG eyes with early paracentral VF loss had significantly thinner minimal BMO-MRW compared to eyes with peripheral VF loss, whereas RNFL thickness parameters (thinnest and average), global BMO-MRW (average and scaled), and minimal sector BMO-MRW (average and scaled) were comparable between these two groups. Minimal BMO-MRW may be a unique quantitative ONH biomarker associated with early paracentral VF loss; since the BMO-MRW is measured within the optic nerve, it may be more likely to reflect local ONH changes than peripapillary RNFL thickness, as the latter is measured on average 1.7 mm away from the center of the optic nerve.Citation28 In addition, minimal BMO-MRW represents the focal ON damage corresponding to a discrete area near fixation on the VF, whereas global BMO-MRW and sector BMO-MRW cannot capture the focal thinning (Figure S2).
The multivariate analysis also showed an association between lower minimal BMO-MRW and lower BMO circumference, suggesting that focal thinning of the neuroretinal rim may be more common in smaller discs with glaucoma. Although this observation differs from a report on global BMO-MRW and healthy eyes, where BMO-MRW is lower in eyes with macrodiscs than microdiscs,Citation29 it is consistent with previous characterization of different glaucomatous optic disc phenotypes.Citation30 A disc phenotype associated with paracentral VF loss (focal glaucomatous) was found to have smaller disc size than other phenotypes (senile sclerotic and generalized cup enlargement), which rarely manifest in VF loss near fixation. It is likely that qualitative description of different glaucomatous optic disc appearances can be quantified with novel imaging parameters; minimal BMO-MRW serves as a parameter for focal glaucomatous phenotype.
In contrast to prelaminar pathology, this cross-sectional study of treated OAG patients without incisional surgery versus controls did not find a difference in LCD, among controls or OAG eyes with different VF loss patterns. Previous studies described increased LCD, attributable to posterior displacement, thinning, or remodeling of the LC, as a component of glaucomatous optic neuropathy.Citation14,Citation31–Citation33 Our method of measuring LCD was similar to a recent publication using SS-OCTCitation32 but differed from those using EDI-OCT, which averaged LCD obtained from multiple locations of the ONH.Citation14,Citation31 It is also likely that lower or higher IOP and trans-LC pressure gradient may play an important role in LCD.Citation15,Citation34,Citation35 Hence, in this study, where OAG patients on ocular hypotensive treatment and control subjects had similar IOP on the day of imaging, the difference in LCD was not significant. It is also possible that a larger sample size is needed to detect a difference between glaucoma and control subjects.Citation14,Citation32 Additional studies demonstrated thinner LC in patients with glaucoma.Citation36 We were not able to visualize the posterior surface of the LC in a consistent manner and therefore did not include LC thickness measurements.
Our findings suggest that glaucomatous ONH changes associated with early paracentral VF loss may occur primarily as focal lesions in the neuronal tissue, anterior to the LC. There may be localized ischemia affecting the papillomacular bundle of the neuronal tissue, causing severe thinning of the BMO-MRW and paracentral VF loss. This is consistent with previous reports that patients with paracentral loss are more likely to have vascular dysregulation, leading to local ischemia, such as Raynaud’s syndrome.Citation5 In addition, this is supported by clinical examination of the ONH, which shows localized changes such as disc hemorrhageCitation5 or acquired pitCitation7 associated with paracentral VF loss. Additional research is needed to confirm our findings and to optimize the detection strategy for patients at risk for paracentral VF loss.
This study has several limitations. First, it had a relatively small sample size, and the findings need to be confirmed in other studies. Second, the study population was relatively homogeneous, consisting predominantly of white subjects; ONH characteristics might be different in a glaucomatous population of other ethnicities, although a recent study did not find significant difference in BMO-MRW thickness between normal eyes of African descent and European descent.Citation37 Third, the measurement of BMO-MRW was performed manually by experienced observers with the aid of customized software. While this method was found to be reliable and reproducible in our previous study,Citation17 existing automated segmentation software for BMO-MRW may require manual correction and further refinement. Finally, given the cross-sectional design of this study, a cause and effect relation could not be established.
Conclusion
Our study showed that glaucomatous optic nerve damage can manifest in the prelaminar tissue as focal thinning of BMO-MRW; thin minimal BMO-MRW may represent a new structural biomarker associated with glaucomatous paracentral scotoma.
Acknowledgments
The authors thank Dr John Miller, Dr Neha Sangal, and Marissa Shoji for data collection; Taibo Li and Haobing Wang for assisting with measurements of optic nerve head parameters; Dr Tobias Elze for calculating linearized visual field mean deviation values; Massachusetts Eye and Ear Fluorescein Laboratory Photographers for performing the imaging protocols described in this paper; and Massachusetts Eye and Ear study coordinators.
This work was supported by the Harvard Glaucoma Center of Excellence and the Miller Research Funds at the Massachusetts Eye and Ear. Some of the results of this paper were presented at the Association for Research in Vision and Ophthalmology as a conference talk with interim findings. The poster’s abstract was published in “ARVO Annual Meeting Abstract” in Invest Ophthalmol Vis Sci: http://iovs.arvojournals.org/issues.aspx?issueid=934157&journalid=177#issueid=934157.
Supplementary materials
Figure S1 Diagram showing scans included in each sector for calculating sector BMO-MRW in a right eye.
Notes: N: 10, 11, 12, 1, 2, 3, 4; SN: 5, 6, 7; ST: 8, 9, 10; T: 11, 12, 1, 2, 3; IT: 4, 5, 6; IN: 7, 8, 9. Similarly, the corresponding scans were used for calculating sector BMO-MRW in left eyes.
Abbreviations: BMO-MRW, minimum rim width at Bruch’s membrane opening; N, nasal; SN, superonasal; ST, superotemporal; T, temporal; IT, inferotemporal; IN, inferonasal.
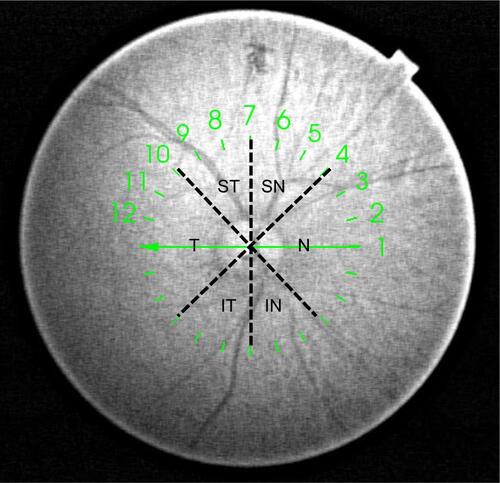
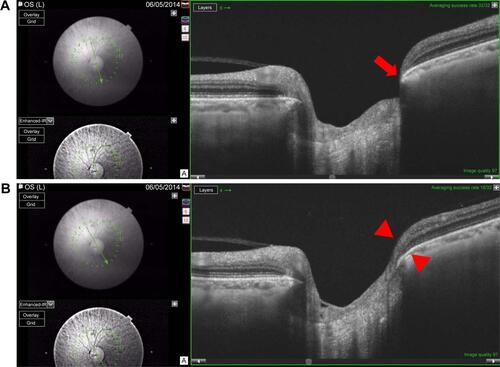
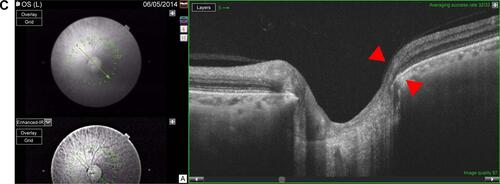
Figure S2 Example of a left eye with early paracentral loss.
Notes: The corresponding visual field test is shown in left side. The minimal BMO-MRW is 34.8 μm and the minimal sector BMO-MRW, as an average over three adjacent scans, is thicker at 92.4 μm. (A) Minimal BMO-MRW (34.8 μm) is in the inferotemporal sector (red arrow) on scan 6. (B) BMO-MRW in the inferotemporal sector (red arrowheads) is 109.3 μm on scan 5. (C) BMO-MRW in the inferotemporal sector (red arrowheads) is 133.0 μm on scan 4.
Abbreviation: BMO-MRW, minimum rim width at Bruch’s membrane opening.
Disclosure
Louis R Pasquale is supported by a Harvard Medical School Distinguished Scholar Award. Lucy Q Shen is supported by the Eleanor and Miles Shore Fellowship, Harvard Medical School. The authors report no other conflicts of interest in this work.
References
- WeinrebRNKhawPTPrimary open-angle glaucomaLancet200436394221711172015158634
- KeltnerJLJohnsonCACelloKEClassification of visual field abnormalities in the ocular hypertension treatment studyArch Ophthalmol2003121564365012742841
- AbeRYDiniz-FilhoACostaVPGracitelliCPBaigSMedeirosFAThe impact of location of progressive visual field loss on longitudinal changes in quality of life of patients with glaucomaOphthalmology2016123355255726704883
- CoeckelberghTRBrouwerWHCornelissenFWVan WolffelaarPKooijmanACThe effect of visual field defects on driving performance: a driving simulator studyArch Ophthalmol2002120111509151612427065
- ParkSCDe MoraesCGTengCCTelloCLiebmannJMRitchRInitial parafoveal versus peripheral scotomas in glaucoma: risk factors and visual field characteristicsOphthalmology201111891782178921665283
- JungKIParkHYParkCKCharacteristics of optic disc morphology in glaucoma patients with parafoveal scotoma compared to peripheral scotomaInvest Ophthalmol Vis Sci20125384813482022714895
- NduagubaCUgurluSCaprioliJAcquired pits of the optic nerve in glaucoma: prevalence and associated visual field lossActa Ophthalmol Scand19987632732779686836
- LeeJHangaiMKimuraYTakayamaKKeeCYoshimuraNMeasurement of macular ganglion cell layer and circumpapillary retinal nerve fiber layer to detect paracentral scotoma in early glaucomaGraefes Arch Clin Exp Ophthalmol201325182003201223620092
- TakayamaKHangaiMKimuraYThree-dimensional imaging of lamina cribrosa defects in glaucoma using swept-source optical coherence tomographyInvest Ophthalmol Vis Sci20135474798480723778878
- PovažayBHoferBHermannBMinimum distance mapping using three-dimensional optical coherence tomography for glaucoma diagnosisJ Biomed Opt200712404120417867793
- GardinerSKRenRYangHFortuneBBurgoyneCFDemirelSA method to estimate the amount of neuroretinal rim tissue in glaucoma: comparison with current methods for measuring rim areaAm J Ophthalmol20141573540549e1e224239775
- MizumotoKGoshoMZakoMCorrelation between optic nerve head structural parameters and glaucomatous visual field indicesClin Ophthalmol201481203120825028533
- Pollet-VillardFChiquetCRomanetJPNoelCAptelFStructure-function relationships with spectral-domain optical coherence tomography retinal nerve fiber layer and optic nerve head measure-mentsstructure-function relationships with SD-OCTInvest Ophthalmol Vis Sci20145552953296224692125
- ParkSCBrummJFurlanettoRLLamina cribrosa depth in different stages of glaucomaInvest Ophthalmol Vis Sci20155632059206425722212
- JungKIJungYParkKTParkCKFactors affecting plastic lamina cribrosa displacement in glaucoma patientsInvest Ophthalmol Vis Sci201455127709771525370516
- SawadaYHangaiMMurataKIshikawaMYoshitomiTLamina cribrosa depth variation measured by spectral-domain optical coherence tomography within and between four glaucomatous optic disc phenotypesInvest Ophthalmol Vis Sci201556105777578426325416
- LiDTaniguchiEVCaiSComparison of swept-source and enhanced depth imaging spectral-domain optical coherence tomography in quantitative characterisation of the optic nerve headBr J Ophthalmol2017101329930427297219
- JonasJBKlingFGründlerAEOptic disc shape, corneal astigmatism, and amblyopiaOphthalmology199710411193419379373129
- VongphanitJMitchellPWangJJPopulation prevalence of tilted optic disks and the relationship of this sign to refractive errorAm J Ophthalmol2002133567968511992866
- LoomisSJKangJHWeinrebRNAssociation of CAV1/CAV2 genomic variants with primary open-angle glaucoma overall and by gender and pattern of visual field lossOphthalmology2014121250851624572674
- MansouriKNuyenBN WeinrebRImproved visualization of deep ocular structures in glaucoma using high penetration optical coherence tomographyExpert Rev Med Devices2014105621628
- ParkHYShinHYParkCKImaging the posterior segment of the eye using swept-source optical coherence tomography in myopic glaucoma eyes: comparison with enhanced-depth imagingAm J Ophthalmol2014157355055724239773
- PatelNBSullivan-MeeMHarwerthRSThe relationship between retinal nerve fiber layer thickness and optic nerve head neuroretinal rim tissue in glaucomaInvest Ophthalmol Vis Sci201455106802681625249610
- ElzeTPasqualeLRShenLQChenTCWiggsJLBexPJPatterns of functional vision loss in glaucoma determined with archetypal analysisJ Royal Soc Interface201512103 pii: 20141118
- KangJHLoomisSJRosnerBAWiggsJLPasqualeLRComparison of risk factor profiles for primary open-angle glaucoma subtypes defined by pattern of visual field loss: A prospective studyInvest Ophthalmol Vis Sci20155642439244825758813
- ChauhanBCO’LearyNAlmobarakFAEnhanced detection of open-angle glaucoma with an anatomically accurate optical coherence tomography-derived neuroretinal rim parameterOphthalmology2013120353554323265804
- RebolledaGCasadoAOblancaNMuñoz-NegreteFJThe new Bruch’s membrane opening – minimum rim width classification improves optical coherence tomography specificity in tilted discsClin Ophthalmol2016102417242527980390
- SchumanJSPedut-KloizmanTHertzmarkEReproducibility of nerve fiber layer thickness measurements using optical coherence tomographyOphthalmology199610311188918988942887
- EndersPAdlerWSchaubFNovel Bruch’s membrane opening minimum rim area equalizes disc size dependency and offers high diagnostic power for glaucomaInvest Ophthalmol Vis Sci201657156596660327951592
- BroadwayDCNicolelaMTDranceSMOptic disk appearances in primary open-angle glaucomaSurv Ophthalmol199943Suppl 1S223S24310416767
- LeeEJKimTWKimMKimHInfluence of lamina cribrosa thickness and depth on the rate of progressive retinal nerve fiber layer thinningOphthalmology2015122472172925433610
- KimDWJeoungJWKimYWPrelamina and lamina cribrosa in glaucoma patients with unilateral visual field lossInvest Ophthalmol Vis Sci20165741662167027054519
- LeeSHKimTWLeeEJGirardMJAMariJMDiagnostic power of lamina cribrosa depth and curvature in glaucomaInvest Ophthalmol Vis Sci201758275576228146240
- QuigleyHAroraKIdreesSBiomechanical responses of lamina cribrosa to intraocular pressure change assessed by optical coherence tomography in glaucoma eyesInvest Ophthalmol Vis Sci20175852566257728494490
- SigalIAYangHRobertsMDBurgoyneCFDownsJCIOP-induced lamina cribrosa displacement and scleral canal expansion: An analysis of factor interactions using parameterized eye-specific modelsInvest Ophthalmol Vis Sci20115231896181220881292
- KwunYHanJCKeeCComparison of lamina cribrosa thickness in normal tension glaucoma patients with unilateral visual field defectAm J Ophthalmol20151593512518.e125498357
- RhodesLAHuisinghCEQuinnAEComparison of bruch’s membrane opening minimum rim width among those with Normal ocular health by raceAm J Ophthalmol201717411311827825982