
Abstract
Background
The bone marrow microenvironment constitutes a sanctuary for leukemia cells. Recent evidence indicates that environment-mediated drug resistance arises from a reciprocal influence between tumor cells and the surrounding stroma. The present study aimed to investigate the effect of chronic lymphocytic leukemia (CLL) cells on the metabolism of bone marrow stroma, to determine the role of this metabolic change in the stroma in vorinostat resistance of CLL cells, and thus to assess a novel strategy to target stroma and achieve the maximum therapeutic effect of vorinostat.
Methods
To evaluate this issue, we used freshly isolated CLL cells from peripheral blood samples of patients with CLL, and co-cultured them with bone marrow stromal cell lines to examine autophagy activity and metabolic changes in both CLL cells and stromal cells after vorinostat treatment.
Results
The results demonstrated that CLL cells were under intrinsic oxidative stress which was further enhanced by vorinostat treatment, and released H2O2 outside the cells. The adjacent stromal cells took up H2O2 and drove autophagy, mitophagy and glycolysis, resulting in the local production of high-energy mitochondrial fuels, which were then taken up by CLL cells to be effectively utilized through mitochondrial oxidative phosphorylation to enable more ATP production. Notably, targeting autophagic stromal cells with autophagy inhibitor remarkably decreased stromal protection against vorinostat treatment in CLL cells.
Conclusion
This study demonstrated that the stroma in the CLL microenvironment is abnormal and undergoes autophagy, and manipulation of autophagic stromal cells could serve as a novel promising strategy to circumvent stroma-mediated drug resistance in CLL cells.
Introduction
Chronic lymphocytic leukemia (CLL) is a homogeneous disease originating from the continuous and excessive accumulation of defective B cells.Citation1,Citation2 CLL has become the most common form of adult leukemia in Europe and North America, and has a drastically increasing trend in China.Citation3–Citation5 Although great progress has been made in CLL therapy for improved patient outcomes,Citation6–Citation8 CLL is still viewed as an incurable disease owing to the presence of residual drug-resistant leukemia cells that will eventually induce CLL recurrence.Citation9,Citation10 Accumulating evidence suggests that bone marrow stroma serves as the leukemia cell sanctuary and contributor to promote the survival of CLL cells and leads to drug resistance in vivo.Citation1,Citation11 Understanding the interaction between bone marrow stromal cells and CLL cells will facilitate the development of novel therapeutic strategies to inhibit the protective effect of stromal cells and eliminate residual CLL cells in vivo.
An increasing number of studies have suggested that the tumor microenvironment communicates with cancer cells through either soluble factors or adhesive interactions, and activates survival signaling pathways or antioxidant systems in cancer cells to promote cell survival.Citation12–Citation16 Although many studies have focused on the tumor microenvironment-initiated survival pathway in cancer cells, more recent studies found that the tumor-associated fibroblasts undergo cancer cell-initiated changes, which, in turn, foster the metabolic and mutagenic activities of cancer cells.Citation17–Citation19 In hematologic malignancies, leukemia cells can create bone marrow niches that disrupt the behavior of normal hematopoietic progenitor cells.Citation20 Therefore, it seems that cancer cells could shape the surrounding stromal cells to best support their survival. Understanding the changes in both leukemia cells and their niche can help us to design new therapeutic strategies to circumvent the stromal cell-mediated protection to completely kill leukemic cells, avoiding the emergence of drug resistance and relapse, and thus prolonging patient survival time.
Suberoylanilide hydroxamic acid (SAHA or vorinostat) is a histone deacetylase inhibitor that has been approved by the US Food and Drug Administration for the treatment of cutaneous T-cell lymphoma.Citation21–Citation23 Vorinostat can effectively kill cancer cells by promoting cell-cycle arrest and apoptosis, inducing cell oxidative damage, and triggering autophagic cell death and senescence.Citation23,Citation24 Preclinical trials have demonstrated the potential antitumor activity of vorinostat against leukemia cells and other hematologic malignancy cells in vitro, and improved survival in animal models of leukemia.Citation25–Citation27 Nonetheless, vorinostat exhibits only limited antitumor activity in CLL patients.Citation28,Citation29 Although several research groups, including our group, have attributed the drug-resistance CLL cell survival to stromal cell-induced antioxidant defense mechanisms,Citation30,Citation31 more details underly ing this stromal cell-mediated vorinostat resistance remain largely unknown and need to be elaborated.
Autophagy, also called cellular self-digestion, is an evolutionarily conserved dynamic catabolic process that is involved in the degradation and recycling of damaged proteins and cellular components such as whole organelles as a response to survive starvation and stress.Citation32–Citation35 Autophagy acts as an alternative energy source to maintain the energy balance for regulating cellular survival.Citation36,Citation37 Recent research demonstrated that cancer cells in the center of the tumor mass exploit autophagy to survive situations of nutrient starvation, thus contributing to tumor progression.Citation38,Citation39 On the other hand, autophagy is vital for the clearance of damaged mitochondria by mitophagy, by which the impaired mitochondria are selectively delivered into lysosomes for degradation.Citation40–Citation42 In addition, it has been widely accepted that the accumulation of ROS induces autophagy and mitophagy, which, in turn, relieve the ROS-driven oxidative damage to enhance cell survival.Citation43,Citation44 Our previous report showed that, compared to normal lymphocytes, CLL cells exhibit higher intracellular ROS levels, which are further enhanced by vorinostat treatment.Citation31 Thus, we speculated that the considerable amount of ROS originating from CLL cells after vorinostat treatment could regulate autophagy in adjacent stromal cells and thus remodel stromal cells, which, in turn, may influence CLL cell survival and drug resistance.
In brief, the aims of this study are to check the role of the autophagy and mitophagy in stromal cell-mediated protection against vorinostat-induced CLL cell death, to investigate the effect of vorinostat in combination with autophagic inhibitors in promoting CLL cell death and to evaluate its potential in removing stromal-protected CLL cells to improve CLL treatment. Our results indicated that the manipulation of stromal cell autophagy could serve as a novel promising strategy to eliminate drug resistance and sensitize CLL cells to chemotherapy. Thus, this study presents a new mechanism for stromal-mediated drug resistance in CLL cells, providing a new vision for improving CLL therapeutics.
Materials and methods
Materials
Commercially available antibodies used in this work were as follows: β-actin (Sigma-Aldrich, St Louis, MO, USA, #A5441), autophagy marker light chain 3 (LC3; Cell Signaling Technology, #12,741S, Beverly, MA, USA), cytochrome c oxidase subunit IV (COX IV; Abcam, #ab16056, Cambridge, UK), heat shock protein 60 (Hsp60; Abcam, #ab46798), glucose transporter 1 (Glut-1; Abcam, #ab652), Na,K-ATPase (Cell Signaling Technology, #3010), hexokinase-II (HK-II; Abcam, #ab37593), autophagy protein 5 (Atg5; Cell Signaling Technology, #12994), goat anti-rabbit polyclonal antibody (Pierce Biotechnology, #31210, Rockford, IL, USA) and goat anti-mouse polyclonal antibody (Pierce Biotechnology, #62-6700). Annexin V–fluorescein isothiocyanate (FITC) was purchased from BD Biosciences (San Jose, CA, USA). Vorinostat, glutathione (GSH), catalase, propidium iodide (PI), lactate, β-hydroxybutyrate, hydrogen peroxide (H2O2), 3-methyladenine (3-MA), chloroquine (CQ) and lactate assay kit were purchased from Sigma-Aldrich (St Louis, MO, USA). The β-hydroxybutyrate assay kit was purchased from Cayman Chemical Company (Ann Arbor, MI, USA). CM-H2DCF-DA, Mitotracker green, amplex red H2O2 assay kit, Lipofectamine 3000, Atg5 siRNA and Lipofectamine RNAiMAX were purchased from Thermo Fisher Scientific (Waltham, MA, USA). 3H-2-Deoxyglucose was acquired from NEN Life Science Products (Boston, MA, USA). Green fluorescent protein (GFP)–LC3 plasmid was purchased from Addgene (Cambridge, MA, USA). The CellTiter-Glo Luminescent Cell viability assay kit was purchased from Promega (Madison, WI, USA).
Cell lines
The human bone marrow cell line Stroma NKtert immortalized by hTERT,Citation45 the murine bone marrow stromal cell line KUSA-H1Citation46 and the human bone marrow stromal cell line HS5 immortalized by E6/E7Citation47 were cultured in RPMI 1640 medium (Cellgro; Mediatech, Hendon, VA, USA) supplemented with 10% FBS as described previously.Citation48 These three stromal cell lines used in this study (Stroma NKtert, murine stromal cell line KUSA and HS5 human bone marrow stromal cell line) were purchased from RIKEN and obtained from the American Type Culture Collection (Manassas, VA, USA), RIKEN Cell Bank (Ibaraki, Japan) and American Type Culture Collection, respectively.
Patients
In this study, 101 blood samples were collected from 101 CLL patients at the First Affiliated Hospital of Nanchang University. Each patient provided signed written informed consent and the study was approved by the ethics committee of the First Affiliated Hospital of Nanchang University. Clinical and biological characteristics, including age, gender, Binet stage, CD38 expression (≥30%), Zap70 expression (≥20%), IGHV mutation and p53 mutation, were recorded in all CLL patients, and are summarized in .
Isolation of CLL cells and normal lymphocytes
Primary CLL cells were obtained from the peripheral blood samples of B-CLL patients, who had been diagnosed based on clinical criteria and laboratory features according to National Cancer Institute criteria.Citation31 In all experiments, CLL cells were isolated from peripheral blood samples, which were collected from the patients by density gradient centrifugation.Citation30 In brief, 5 mL blood was slowly added to a Falcon tube containing 6 mL pre-warmed Fico/Lite LymphoH buffer (Atlanta Biological, Lawrenceville, GA, USA) and then centrifuged at 435 × g for 20 minutes at room temperature. The isolated CLL cells were washed with pre-warmed PBS and incubated in RPMI-1640 medium (Cellgro; Mediatech) supplemented with 10% FBS, penicillin (100 U/mL) and streptomycin (100 µg/mL; all Cellgro; Mediatech) overnight before experimentation. Normal lymphocytes were isolated from blood samples of five healthy donors using similar procedures.
Cell viability assays
Cell death was determined by flow cytometry after double staining cells with annexin V–FITC and PI as described previously.Citation30 Stromal cells (5×10⁴ cells/mL) were seeded in 24-well plates and allowed to adhere and grow overnight before the addition of CLL cells or normal B cells or CQ. The CLL cells were isolated from the blood samples and incubated overnight with RPMI-1640 medium supplemented with 10% FBS, penicillin (100 U/mL) and streptomycin (100 µg/mL), and then transferred (1×10⁶ cells) into 24-well plates with or without the pre-seeded stromal cells. Following co-culture for 1 day, CLL cells were treated with various compounds under the conditions indicated in the figure legends. All assays were carried out at least three times.
Measurement of cellular ROS levels and mitochondrial contents
The cellular ROS levels and mitochondrial contents were detected with a fluorescent probe of CM-H2DCF-DA and Mitotracker green, respectively. In brief, NKtert cells and CLL cells were cultured under various experimental conditions, and then incubated with 1 µM CM-H2DCF-DA for 60 minutes or with 61.6 nM Mitotracker green for 30 minutes at 37°C in the dark. After washing twice, the resulting samples were measured using flow cytometry, and the results were analyzed based on forward scatter/side scatter gating to differentiate between dead and viable cells using the built-in software.
Western blot analysis
After being cultured under various experimental conditions, NKtert cells and CLL cells were harvested and washed in cold PBS, and directly solubilized in buffered solution containing 10 mM pH 7.6 Tris–HCl, 1% SDS and protease inhibitor (Hoffman-La Roche Ltd., Basel, Switzerland, #11836170001). Membrane fractionation was performed as described previously.Citation49 The total and membrane protein concentrations were quantified using a BCA Protein Assay Kit (Pierce Biotechnology, #23225), and then adjusted to 2 µg/mL with sample buffer containing 250 mM pH 6.8 Tris–HCl, 4% SDS, 10% glycerol, 0.006% bromophenol blue and 2% mercaptoethanol. The cell lysates were heated at 95°C for 10 minutes, and equal amounts of proteins were separated on SDS–PAGE in a Mini-Protean II Dual Slab Cell (Bio-Rad Laboratories, Hercules, CA, USA). The proteins were then transferred on to nitrocellulose membranes using a Mini Trans-Blot Transfer Cell (Bio-Rad Laboratories). The transfer was performed at 4°C for 2 hours at a constant voltage setting of 110 V. The blots were blocked in 5% skimmed milk for 1 hour at room temperature. The membranes were then probed with the following primary antibodies: LC3, COX IV, Hsp60, Glut-1, Na,K-ATPase, HK-II and Atg5, all at 1:1,000 dilution, and β-actin at 1:10,000 dilution. After incubation for 2 hours at room temperature, the blots were washed three times for 10 minutes in PBS containing 0.1% Tween-20, and then incubated for 1 hour at room temperature in the following secondary antibodies: goat anti-rabbit polyclonal antibody for LC3, COX IV, Hsp60, Glut-1, Na,K-ATPase, HK-II and Atg5 detection, all at 1:3,000 dilution, and goat anti-mouse polyclonal antibody for β-actin detection at 1:20,000 dilution. The blots were then washed three times for 10 minutes with the same buffer as above and incubated in enhanced chemiluminescence detection reagents (GE Healthcare Life Sciences, Chalfont, UK) for 1 minute. The blots were then exposed to an X-OMAT AR X-ray film (Kodak, Roch-ester, NY, USA) for between 10 seconds and 5 minutes.
Plasmid transfection and confocal microscopy
NKtert cells were transfected with adenovirus harboring GFP-LC3 plasmid with Lipofectamine 3000 according to the manufacturer’s protocol. After transfection for 6 hours, the cells were changed into fresh medium and cultured for 24 hours. Then, the NKtert cells were cultured alone or with CLL cells incubated with or without vorinostat or H2O2 for another 24 hours, and the cells were fixed and examined with a Nikon Eclipse TE2000 confocal microscope. The number of autophagosomes (green dots) per cell was calculated using ImageJ software.
siRNA transfection
siRNA for Atg5 and non-targeting sequence control siRNA (NC) were transfected to NKtert cells with Lipofectamine RNAiMAX (Thermo Fisher Scientific) according to the manufacturer’s instructions. After transfection for 6 hours, the cells were changed into fresh medium and cultured for 24 hours. Then, the NKtert cells were co-cultured with CLL cells and incubated with vorinostat for another 48 hours for Western blot and apoptosis analysis.
Mitochondrial respiration activity
Mitochondrial respiration in whole cells was measured by an oxygen consumption assay, as described previously.Citation50 Following NKtert cell and CLL cell cultures under various experimental conditions, the cells were resuspended in 1 mL of fresh culture medium pre-equilibrated with 21% oxygen at 37°C, followed by applying the cells to the sealed respiration chamber of a Clark-type oxygen measuring system (Oxytherm; Hansatech Instruments, Cambridge, UK) with constant stirring.
Glucose uptake
Cellular glucose uptake was measured as described previously.Citation51 NKtert cells cultured alone or with CLL cells were treated with vorinostat. Then, the cells were washed with glucose-free medium and incubated in fresh glucose-free RPMI 1640 medium for 3 hours before incubation with 0.2 Ci/mL 3H-2-deoxyglucose for 1 hour. After washing the cells with ice-cold PBS, the glucose uptake represented by 3 hours’ radioactivity was determined by liquid scintillation counting and normalized by cell number.
Lactate release
Lactate release into the medium was measured using an assay kit from Sigma-Aldrich, based on an enzymatic–spectrophotometric method. NKtert cells cultured alone or with CLL cells were treated with vorinostat. Then, the cells were replenished with fresh medium. Aliquots of the medium were removed at the indicated time for measurement of lactate. At each time point, cell number was also counted for normalization of lactate generation.
β-Hydroxybutyrate (ketone body) release
β-Hydroxybutyrate release into the medium was measured using an assay kit from Cayman Chemical Company, based on an enzymatic–spectrophotometric method. NKtert cells cultured alone or with CLL cells were treated with vorinostat. Then, the medium was collected and the ketone body concentration was measured according to the manufacturer’s instructions. Results were normalized for total cellular protein per well.
Cellular ATP measurement
The level of cellular ATP was determined using the CellTiter-Glo Luminescent Cell viability assay kit from Promega, based on a luciferase method. CLL cells were cultured under various experimental conditions, then the cellular ATP contents were measured according to the manufacturer’s recommendations. Results were normalized according to cell number.
Determination of the effect of oxygen levels on CLL cell viability
The effect of oxygen levels on CLL cell viability was detected as described previously.Citation31 In brief, CLL cells were cultured with or without a pre-seeded NKtert cell layer, and incubated in normoxic or hypoxic conditions (2% oxygen) for 1 day at 37°C. The CLL cells were then treated with the combination of autophagy inhibitor and vorinostat under normoxia and hypoxia at 37°C. Cell viability was determined using flow cytometry following double staining with Annexin V and PI. Hypoxic culture conditions were created by incubating the cells in a sealed modular incubator chamber flushed with 2% oxygen, 5% carbon dioxide and balanced nitrogen.
Statistical analysis
All experiments were conducted on CLL cells separated from at least three patients, and stromal cells from three separated culture flasks were applied. Statistical significance was estimated using the Student’s t-test. P<0.05 was considered to indicate a statistically significant difference. Bar graphs and plots were produced on GraphPad Prism 5 software (Graph-Pad Software, La Jolla, CA, USA).
Results
Disrupting the autophagy pathway circumvents stromal protection of CLL cells
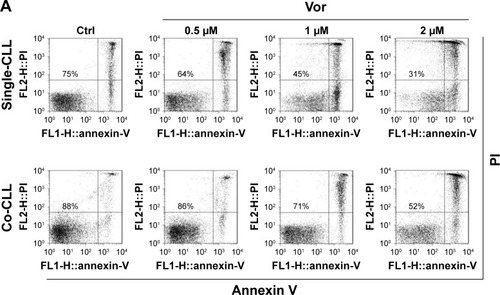
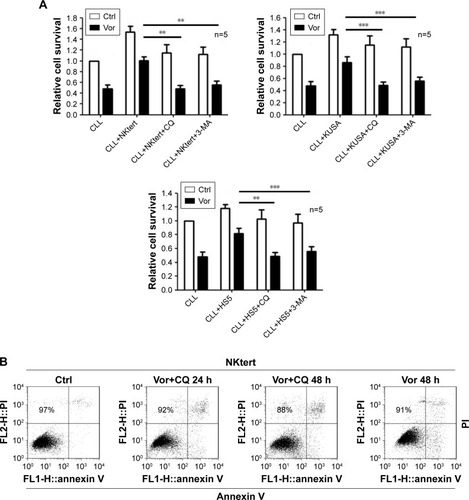
Previous studies demonstrated that vorinostat can effectively kill CLL cells for the treatment of CLL patients.Citation23,Citation24 However, the treatment effects are fairly limited owing to the presence of drug-resistant CLL cells leading to leukemia recurrence. To demonstrate that bone marrow stromal cells provide protection against spontaneous and vorinostat-induced cell apoptosis, stromal NKtert cells were co-cultured with primary leukemia cells isolated from CLL patients and treated with vorinostat. As shown in , a significantly increased apoptosis rate for single-cultured CLL cells was observed, from 25% to 69%, with the increase in vorinostat concentration from 0 to 2 µM, whereas the CLL cells co-cultured with NKtert cells exhibited an obvious decrease in the apoptosis rate at all given vorinostat concentrations, demonstrating that the stromal NKtert cells prevented CLL cells from undergoing spontaneous and vorinostat-induced apoptosis. To investigate the role of autophagy in stroma-mediated protection against vorinostat-induced apoptosis, two common small molecular chemical inhibitors, 3-MA and CQ, were used to manipulate autophagy. After treatment with vorinostat for 24 hours and 48 hours, the apoptotic cell death rate of CLL cells in the presence of NKtert cells was 14% and 34%, respectively (). However, the use of 10 µM CQ to inhibit autophagy remarkably increased apoptotic cell death of CLL cells co-cultured with NKtert cells to 37% and 45% after treatment with 2 µM vorinostat for 24 hours and 48 hours, respectively. Notably, the increase in CQ concentration to 20 µM was able to eliminate 60%–70% of CLL cells in the presence of stromal layers after treatment with vorinostat for 24 hours and 48 hours. Similar results of enhanced cell death of CLL cells co-cultured with NKtert cells with vorinostat treatment were observed when using another autophagy inhibitor, 3-MA. Similar results were also observed in experiments using more CLL samples (). These observations indicate that the presence of an autophagy inhibitor, CQ or 3-MA, could effectively enhance vorinostat-induced apoptosis in CLL cells in the presence of NKtert cells, demonstrating that autophagy inhibitors circumvent the stromal protection of CLL cells against vorinostat-induced apoptosis.
Figure 1 Autophagy inhibitors circumvent bone marrow stromal cell-mediated protection against vorinostat cytotoxicity in CLL cells.
Abbreviations: CLL, chronic lymphocytic leukemia; Ctrl, control cells without treatment; Vor, vorinostat treatment; Single-CLL, CLL cells cultured alone; Co-CLL, CLL cells co-cultured with NKtert cells; PI, propidium iodide; CQ, chloroquine treatment; 3-MA, 3-methyladenine treatment.
Vorinostat induces autophagy and mitophagy in stromal cells in the presence of CLL cells but not in CLL cells
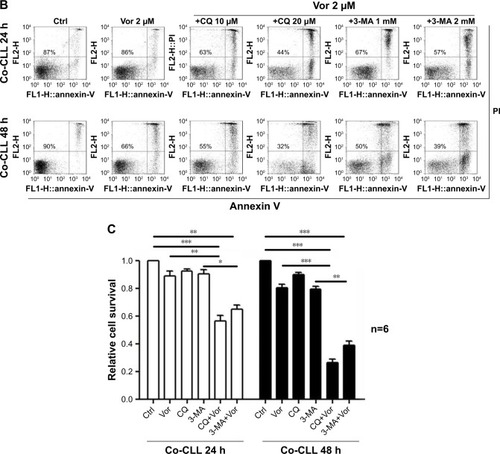
As stated above, our results showed that the stromal protection of CLL cells against vorinostat-induced apoptosis was related to autophagy. However, it remains unknown whether this autophagy-based protective effect comes from stromal cells or CLL cells. In the process of autophagy, the degree of LC3-I to LC3-II conversion correlates with the extent of autophagosome formation. We analyzed expression levels of LC3-II and LC3-I in both single- and co-cultured CLL and stromal cells with or without vorinostat treatment. In addition, to distinguish whether autophagosome accumulation is due to autophagy induction or impaired autophagic degradation, we performed autophagic flux assays using CQ to block autophagy in the late stages. Surprisingly, the results showed that no significant LC3-II signals and no further increase in LC3-II with CQ treatment were detected in either single-cultured or co-cultured CLL cells under any conditions (), indicating that autophagy in CLL cells was weak. Conversely, an obviously increased LC3-II accumulation was seen in NKtert cells co-cultured with CLL cells, which was further enhanced by vorinostat treatment for 24 hours, and the accumulation of LC3-II was further increased by CQ treatment (). Moreover, since LC3 is visualized in small puncta corresponding to autophagosomes, NKtert cells were infected with an adenovirus expressing LC3 fused to GFP (GFP-LC3) and co-cultured with CLL cells with or without vorinostat treatment, and assessed for GFP-LC3 localization. In the absence of CLL cells, as expected, GFP-LC3 was diffused within the cytoplasm with occasional puncta. When co-cultured with CLL cells, more GFP-LC3 puncta were observed, which were markedly increased after treatment with vorinostat for 24 hours (). These results indicated a clear role for CLL cells in the regulation of autophagy in NKtert cells, especially after vorinostat treatment (single-cultured CLL cells or NKtert cells showed weak autophagy). Moreover, flow cytometry analysis displayed a decreased mitochondrial mass in NKtert cells in the presence of CLL cells, which further decreased after vorinostat treatment for 48 hours (). Immunoblotting analysis for mitochondrial matrix protein Hsp60 and inner mitochondrial membrane protein COX IV, which are markers of mitochondrial mass, was used as a quantitative way to monitor the last step in the degradation process of mitophagy. Consistently, both Hsp60 and COX IV were significantly decreased in the NKtert cells co-cultured with CLL cells after treatment with vorinostat for 24 hours and 48 hours (). All these data suggested increased mitophagy and autophagy in stromal cells in the presence of CLL cells, and vorinostat treatment enhanced autophagy in stromal cells in the presence of CLL cells.
Figure 2 Vorinostat induces autophagy and mitophagy in NKtert cells co-cultured with CLL cells.
Abbreviations: CLL, chronic lymphocytic leukemia; LC3, light chain 3; Co-CLL, CLL cells co-cultured with NKtert cells; Single-CLL, S-CLL, CLL cells cultured alone; CQ, chloroquine treatment; Ctrl, control cells without treatment; V, Vor, vorinostat treatment; GFP, green fluorescent protein; Co-NKtert, NKtert cells co-cultured with CLL cells; Single-NKtert, S-NKtert, NKtert cells cultured alone; Hsp60, heat shock protein 60; COX IV, cytochrome c oxidase subunit IV.
ROS originating from CLL cells by vorinostat treatment induce autophagy and mitophagy in stromal cells
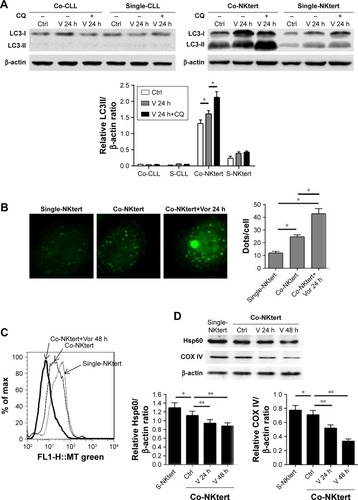
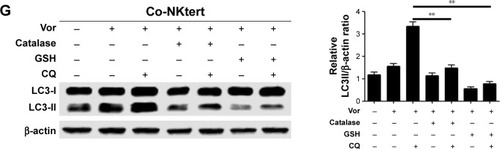
Accumulating data have implicated the important role of ROS in autophagy.Citation43 Our previous study indicated that CLL cells exhibit intrinsically high intracellular ROS levels, and yield an excessive accumulation of ROS after vorinostat treatment.Citation31 We suspected that the excessive intracellular ROS levels in CLL cells would diffuse into the extracellular space, thus causing strong oxidative stress in adjacent stromal cells. Flow cytometry analysis revealed that compared with single-cultured NKtert cells, the intracellular ROS levels increased in NKtert cells co-cultured with CLL cells, and further increased after 30 hours of vorinostat treatment (). Our previous work suggested that stromal cells alleviate oxidative stress in CLL cells.Citation31 Consistent with this, shows that there was a decreased level of ROS in CLL cells in the presence of NKtert cells, whereas vorinostat treatment increased ROS in both single- and co-cultured CLL cells. By determining the corresponding H2O2 concentration in the culture media, we found an increased H2O2 accumulation in the medium of CLL cells, which further increased after vorinostat treatment (). In contrast, the group of NKtert cells cultured alone exhibited much lower H2O2 levels in culture medium either with or without vorinostat treatment, whereas an increased H2O2 accumulation was observed in the medium from the group of CLL plus NKtert, demonstrating that the presence of CLL cells in co-cultured system caused enhanced H2O2 accumulation. In addition, compared with this group of NKtert cells cultured with vorinostat, the group with CLL in the presence of NKtert and vorinostat showed a significant increase in H2O2 accumulation, indicating that vorinostat treatment increased H2O2 concentration in the culture medium of NKtert cells only in the presence of CLL cells. These results suggest that although stromal cells decreased ROS in CLL cells, the latter still can release ROS into the medium and increase ROS levels in adjacent stromal cells after vorinostat treatment. To investigate the effects of increased ROS levels on autophagy in stromal cells, NKtert cells were treated with H2O2. As shown in , following 8 hours of incubation with H2O2, there was a significant increase in LC3-II expression in NKtert cells, which was further enhanced by CQ treatment. Consistent with this, the addition of H2O2 increased GFP-LC3 puncta in NKtert cells (), indicating autophagy induction in NKtert cells by H2O2 treatment. Further immunoblotting analysis () demonstrated that the mitochondrial Hsp60 and COX IV protein levels decreased in NKtert cells treated with exogenous H2O2 for 8 hours, and reduced further with further incubation. Collectively, these results show that the exogenous H2O2 induced mitophagy and autophagy in NKtert cells. To further validate this result, the antioxidants catalase and GSH were applied to relieve oxidative stress in stromal cells. The results in illustrate that the addition of those antioxidants decreased autophagy flux in NKtert cells co-cultured with CLL cells, further confirming that the induction of autophagy was highly related to the ROS generation in NKtert cells. Given all this, we demonstrated that oxidative stress originating from adjacent CLL cells induced autophagy and mitophagy in NKtert cells, especially after vorinostat treatment.
Figure 3 Release of H2O2 by CLL cells is essential to induce autophagy and mitophagy in bone marrow stromal cells.
Abbreviations: CLL, chronic lymphocytic leukemia; Single-NKtert, NKtert cells cultured alone; Co-NKtert, NKtert cells co-cultured with CLL cells; Co-CLL, CLL cells co-cultured with NKtert cells; Vor, vorinostat treatment; Single-CLL, CLL cells cultured alone; Ctrl, control cells without treatment; Hsp60, heat shock protein 60; COX IV, cytochrome c oxidase subunit IV; LC3, light chain 3; CQ, chloroquine treatment; GSH, glutathione.
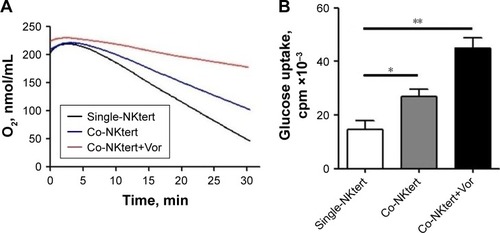
Vorinostat activates glycolysis in stromal cells in the presence of CLL cells
The autophagic NKtert cells in the presence of CLL cells demonstrated a decrease in mitochondrial mass. We speculated that the autophagic NKtert cells could not maintain the energy balance needed for cell survival. Therefore, we compared the oxygen consumption in NKtert cells with or without CLL cells. As shown in , compared to single-cultured NKtert cells, NKtert cells co-cultured with CLL cells had decreased oxygen consumption, which was further reduced after vorinostat treatment, showing that CLL cells and vorinostat treatment in the presence of CLL cells disturbed the mitochondrial oxidative phosphorylation, and lowered oxygen consumption in NKtert cells. In addition, shows that NKtert cells co-cultured with CLL cells increased glucose uptake, especially after vorinostat treatment, indicating that glycolysis in stromal cells may be increased in the presence of CLL cells and further enhanced by vorinostat treatment. To further study the effect of CLL cells and vorinostat treatment on glycolysis in NKtert cells, the expression levels of Glut-1 and the glycolytic enzyme HK-II were examined. The results in show that increased expression of Glut-1 in the membrane fraction and HK-II was observed in NKtert cells co-cultured with CLL cells, which further increased after vorinostat treatment, whereas no significant changes in the expression of Glut-1 and HK-II were detected in single-cultured NKtert cells, either with or without vorinostat treatment. Moreover, by measuring the accumulation of glycolytic products, including lactate and ketone bodies in the culture medium, we found that co-culture of NKtert cells with CLL cells induced more accumulation of lactate and ketone bodies in the culture medium than single-cultured NKtert cells. A greater accumulation of lactate and ketone was also observed in the presence of vorinostat (). These results demonstrate that autophagic NKtert cells reduced the mitochondrial oxidative phosphorylation and increased the aerobic glycolysis to overcome the energy shortage to ensure cell survival.
Figure 4 Vorinostat activates glycolysis in stromal cells cultured with CLL cells.
Abbreviations: CLL, chronic lymphocytic leukemia; Single-NKtert, NKtert cells cultured alone; Co-NKtert, NKtert cells co-cultured with CLL cells; V, Vor, vorinostat treatment; Ctrl, control cells without treatment; Glut-1, glucose transporter-1; HK-II, hexokinase-II.
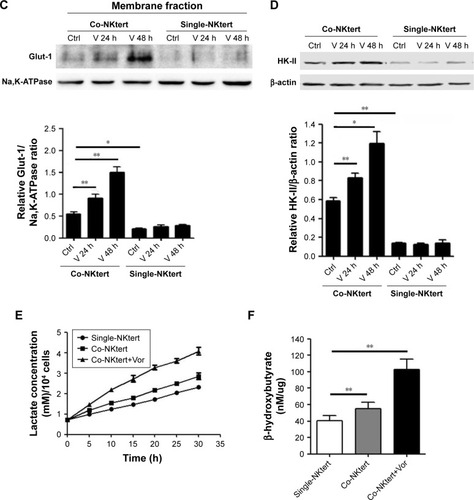
Glycolysis in stromal cells supports CLL cell survival through the maintenance of mitochondrial metabolic function and energy levels
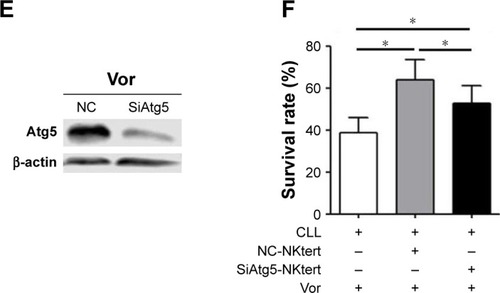
As shown in , enhanced CLL cell survival against vorinostat treatment was seen in the presence of lactate and ketone bodies, and a further increase was obtained by adding GSH, which partially offset the vorinostat-induced oxidative damage. This result indicates that the presence of lactate and ketone bodies was beneficial for CLL cell survival, and synergistically enhanced CLL cell survival was achieved in the presence of GSH. We also examined the ATP levels in CLL cells treated with vorinostat. The results in show that NKtert cells increased ATP levels in CLL cells after vorinostat treatment. Importantly, exogenous addition of lactate and ketone bodies increased ATP levels in CLL cells in a similar manner, and these levels were further enhanced in the presence of GSH. By monitoring the changes in oxygen consumption under different conditions, we found that vor-inostat treatment decreased oxygen consumption in single-cultured or co-cultured CLL cells, whereas the presence of NKtert cells resulted in increased oxygen consumption in co-cultured CLL cells with or without vorinostat treatment (). Moreover, we found that exogenous addition of lactate and ketone bodies could partially replace NKtert cells to increase oxygen consumption in CLL cells after vorinostat treatment (). These results imply that NKtert cells may support CLL cell survival by providing the energy-rich metabolites for ATP production based on mitochondrial oxidative phosphorylation in the adjacent CLL cells. Since we found that NKtert cells generate lactate and ketone bodies through glycolysis, and autophagy activated glycolysis in NKtert cells, to check the role of stromal cell autophagy in CLL cell survival, the essential autophagy gene Atg5 in the NKtert cells was selectively knocked down using siRNA (). Then, SiAtg5-NKtert cells were co-cultured with CLL cells. The results in show that SiAtg5-NKtert cells exhibited a decreased ability to protect CLL cells against vorinostat treatment compared with the Atg5-expressing NKtert cells. Overall, the glycolysis in the co-cultured NKtert cells played an important role in supporting CLL cell survival, and the inhibition of glycolysis by the interfering autophagy gene could circumvent stromal protection.
Figure 5 Glycolytic products of stromal cells maintain mitochondrial metabolic function and survival of CLL cells.
Abbreviations: CLL, chronic lymphocytic leukemia; Vor, vorinostat treatment; GSH, glutathione; PI, propidium iodide; Single-CLL, CLL cells cultured alone; Co-CLL, CLL cells co-cultured with NKtert cells; L, lactate; K, ketone body; NC, non-targeting siRNA control; NC-NKtert, NKtert cells infected with non-targeting siRNA control; SiAtg5-NKtert, NKtert cells infected with Atg5 siRNA.
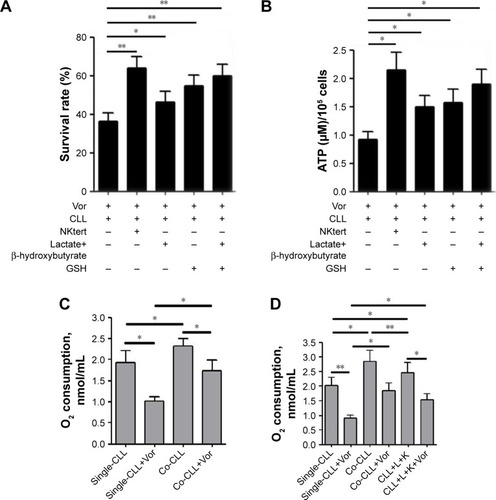
The combination of autophagy inhibitor and vorinostat circumvents stromal-mediated drug resistance in CLL cells
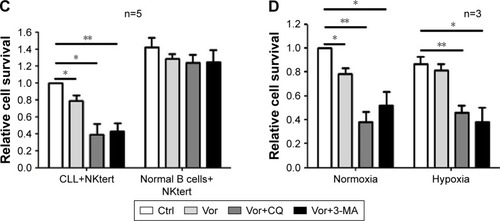
Encouraged by the above findings, we investigated a strategy to abolish stromal protection of CLL cells by inhibiting autophagy in stromal cells. Two autophagy inhibitors, CQ and 3-MA, were used in this study. As shown in , NKtert cells reduced the sensitivity of CLL cells to vor-inostat treatment, and a subtoxic concentration of CQ or 3-MA greatly enhanced vorinostat-induced cytotoxicity to a level comparable to that observed in CLL cells alone. Similar results were observed in experiments using different CLL samples and other two bone marrow stromal cell lines (HS5 and KUSA-H1) (). These results further confirmed that the stromal protection against vorinostat treatment in CLL cells was greatly related to autophagy, and the autophagy-mediated stromal protection could be circumvented by using autophagy inhibitors. In control experiments, we found that the combination of vorinostat with CQ or 3-MA caused minimal cytotoxicity in normal bone marrow stromal cells, with around 90% viable cells after treatment with vorinostat and CQ for 24 hours and 48 hours (). We also examined the cytotoxicity of this drug combination strategy in normal B cells, and found that the combination of vorinostat with CQ or 3-MA caused only a slight decrease in cell survival in normal B cells (). These results indicate that the combination of vorinostat and autophagy inhibitors resulted in only limited toxicity to normal B cells and stromal cells, with acceptable side effects. Moreover, owing to the hypoxic bone marrow environment, the effects of treatment combinations of vorinostat with CQ or 3-MA in CLL cells cultured on a stromal layer in normoxia and hypoxia were examined. Consistent with our previous report,Citation31 NKtert cells enhanced CLL viability under different oxygen concentrations, and the significant cell death induced by the combination of vorinostat with CQ or 3-MA in CLL cells was observed under both normoxic and hypoxic conditions (), suggesting that co-administration of vorinostat and autophagy inhibitors may effectively eliminate CLL cells in the hypoxic bone marrow environment.
Figure 6 The combination of autophagy inhibitor and vorinostat circumvents stromal-mediated drug resistance in CLL cells.
Abbreviations: CLL, chronic lymphocytic leukemia; CQ, chloroquine; 3-MA, 3-methyladenine; Ctrl, control cells without treatment; Vor, vorinostat treatment; PI, propidium iodide.
Discussion
Despite the development of novel regimens, the overall survival of CLL patients has not improved sufficiently. The presence of drug resistance has severely hindered the successful treatment of CLL patients, leading to poor outcomes. Previous studies have suggested that the cross-talk between CLL cells and bone marrow stroma contributes to drug resistance.Citation20,Citation48,Citation52,Citation53 For example, bone marrow stromal cells secrete soluble factors, such as SDF-1aCitation54 and IL-6,Citation55 or upregulate extracellular matrix proteins such as integrins,Citation56 which allows CLL cells to survive the insult of chemotherapy and therefore increases the probability of the development of drug resistance. Moreover, our previous work showed that stromal cells induced drug resistance by regulating the redox balance in CLL cells.Citation31 In this work, we found that CLL cells induced oxidative stress in the co-cultured stromal cells, triggering stromal autophagy, which, in turn, supported the adjacent CLL cell survival through autophagy-activated glycolysis, thus contributing to the drug resistance of CLL cells.
To date, most studies of microenvironment-mediated drug resistance in leukemia have attributed the emergence of drug resistance to stroma-induced molecular or redox signaling pathways in leukemia cells, but little is known about how leukemia cells affect stroma, how stroma respond to chemotherapy, and how these factors influence leukemia cell survival and the development of drug resistance. In recent years, studies in solid tumors have revealed that cancer cell growth alters the normal tissues and affects their metabolism, which, in turn, provides various nutrient substances for tumor cell survival.Citation57,Citation58
Studies on hemotopoietic malignancy found that leukemic cell proliferation in the bone marrow disturbs the normal stromal microenvironment, and thus results in abnormal and malignant niches.Citation20 This indicates that the stroma in leukemia patients is not normal. Here, by using a stroma–leukemia co-culture system, we found that bone marrow stroma underwent autophagy and glycolysis to feed adjacent CLL cells, especially after cytotoxic drug treatment. These findings verify that the leukemia cells and chemotherapy convert normal bone marrow stroma into leukemia-associated stroma, which could serve as an “energy factory” for leukemia cell survival and growth.
Autophagy is a process of cellular self-digestion that involves the degradation of intracellular cytoplasmic organelles and proteins.Citation59 With cell autophagy, a large number of degraded products are supplied as recycled energy inputs for both biosynthesis and energy generation to prolong cell survival under metabolic stress.Citation35,Citation38,Citation60 Mitophagy is a selective form of autophagy that is triggered by impaired mitochondria to maintain mitochondrial quality. The role of autophagy in cancer is complex, and its action depends on the cell type and the type of stress.Citation38,Citation61,Citation62 In cancer cells with defects in apoptosis, autophagy promotes cell survival, whereas other studies suggest that autophagy provides a protective function to inhibit tumorigenesis.Citation64–Citation66 Some studies suggest that autophagy occurs not only in the cancer cell, but also in adjacent normal fibroblasts in the microenvironment of solid tumors.Citation17–Citation19 More specifically, oncogenic mutations in cancer cells promote autophagy and aerobic glycolysis in stroma to promote tumor progression and metastasis. In this study, the “autophagic tumor stroma model” was proven for the first time in a leukemia microenvironment. It is generally accepted that ROS induce autophagy.Citation43,Citation44 We found that CLL cells were under intrinsic oxidative stress that was enhanced by an ROS-generating drug, and released H2O2 outside the cells. The NKtert cells in co-culture took up H2O2 and then drove the onset of autophagy, mitophagy and glycolysis, resulting in the local production of high-energy mitochondrial fuels (such as L-lactate and ketone bodies). These energy nutrients were then taken up by CLL cells to be effectively utilized by mitochondrial oxidative phosphorylation to enable more ATP production. Furthermore, our previous study demonstrated that stroma increased GSH levels in the co-cultured CLL cells to release oxidative stress and protect CLL cells to ensure their survival.Citation31 Indeed, in this study we found that the addition of exogenous GSH potentiated mitochondrial fuel-mediated upregulation of oxidative phosphorylation. A possible explanation for the synergistic effect is that GSH relieved the oxidative stress in CLL cells to some extent, which partially inhibited the oxidative damage to mitochondria and preserved functional mitochondria to effectively burn lactate or ketone bodies for oxidative mitochondrial metabolism. Given all this, this work provided a new molecular mechanism for understanding stroma-mediated protection of CLL cells.
Vorinostat, a histone deacetylase inhibitor, has been proven to kill CLL cells by inducing ROS-driven oxidative damage. Accumulating data point to an essential role for ROS in the activation of autophagy. Surprisingly, although CLL cells exhibited increased ROS levels, especially after vorinostat treatment, no obvious autophagy was observed in CLL cells. The result is consistent with our previous study, in which we demonstrated that vorinostat inhibited CLL cell survival by inducing apoptosis.Citation31 Unlike CLL cells, NKtert cells showed no detectable increase in ROS after vorinostat treatment, which may be due to the failure of the ROS-generating system or the effectiveness of the antioxidant system in NKtert cells. Accordingly, no autophagy was observed in NKtert cells after vorinostat treatment. However, a considerable amount of ROS from CLL cells in the presence of vorinostat was taken up by NKtert cells and failed to be cleared by the antioxidant system, and finally promoted autophagy in NKtert cells. Our previous study demonstrated that bone marrow stroma efficiently decreased ROS level in CLL cells through increasing GSH synthesis.Citation31 Nevertheless, in the present study, we showed that CLL cells in co-culture still maintained a considerable amount of ROS, especially after treatment with vorinostat, which caused an increased ROS level in adjacent stroma that could not be buffered, thus leading to the occurrence of stromal autophagy.
Although vorinostat has been proven to be effective to kill CLL cells in vitro, unfortunately, preclinical trials indicated that this vorinostat-induced cell killing effect is very limited in CLL patients,Citation28,Citation29 largely restricting its wider application for CLL treatment. Our previous work demonstrated that bone marrow stromal cells induce vorinostat resistance in CLL cells.Citation31 Stroma-induced signaling pathways in cancer cells are increasingly being targeted by therapeutic approaches aiming to combat tumor microenvironment- mediated drug resistance. However, since little is known about cancer-associated changes in stroma and how such changes influence the development of drug resistance in cancer, most studies have not sought to target the cancer-associated stroma. One study showed that chemotherapy of bone marrow stromal cells decreased their ability to protect primary acute myeloid leukemia cells from the drug treatment.Citation63 In the present study, we demonstrated that the treatment of stroma with autophagy pathway-specific siRNA or inhibitors, such as 3-MA or CQ, reduced the ability of stromal cells to protect CLL cells against vorinostat-induced apoptosis, and the combination of 3-MA or CQ and vorinostat had a combinatory effect to induce apoptosis in CLL cells in the presence of stromal cells. Notably, this combinatory effect killed CLL cells but spared normal B cells and stromal cells, indicating that the combination has therapeutic selectivity. Collectively, these data suggest that directly targeting leukemia-associated stroma may be an effective means of leukemia therapy, and the combination of autophagy inhibitors and vorinostat would have significant clinical impact.
Conclusion
We demonstrated that vorinostat treatment indirectly promotes autophagy, mitophagy and glycolysis of bone marrow stroma in leukemia microenvironment, and thus promotes the development of drug resistance in CLL cells. This finding broadens our understanding of microenvironment-mediated drug resistance in CLL cells and suggests that directly targeting stroma and associated signaling pathways may be an effective means of leukemia therapy.
Author contributions
WZ and HP conceived and designed the experiments; LD, LY, KZ and JZ performed the experiments; LD, RY, RH and WZ analyzed the data; and LD, WZ and HP drafted the manuscript. All authors contributed toward data analysis, drafting and revising the paper and agree to be accountable for all aspects of the work.
Acknowledgments
The present study was supported by the Jiangxi Science and Technology Department (grant no 20161BBH80074, 20171BAB215080) and the National Natural Science Foundation of China (grant no 81760052).
Supplementary material
Table S1 Clinical and biological characteristics of 101 chronic lymphocytic leukemia patients
Disclosure
The authors report no conflicts of interest in this work.
References
- ChiorazziNRaiKRFerrariniMChronic lymphocytic leukemiaN Engl J Med2005352880481515728813
- KeatingMJChiorazziNMessmerBBiology and treatment of chronic lymphocytic leukemiaHematology Am Soc Hematol Educ Program200320031153175
- PuenteXSPinyolMQuesadaVWhole-genome sequencing identifies recurrent mutations in chronic lymphocytic leukaemiaNature2011475735410110521642962
- FurmanRRSharmanJPCoutreSEIdelalisib and rituximab in relapsed chronic lymphocytic leukemiaN Engl J Med201437011997100724450857
- EichhorstBRobakTMontserratEChronic lymphocytic leukaemia: ESMO clinical practice guidelines for diagnosis, treatment and follow-upAnn Oncol201526Suppl 5v78v8426314781
- ZenzTMertensDKüppersRDöhnerHStilgenbauerSFrom pathogenesis to treatment of chronic lymphocytic leukaemiaNat Rev Cancer2010101375019956173
- MontserratERozmanCChronic lymphocytic leukaemia treatmentBlood Rev1993731641758241831
- TamCSKeatingMJChemoimmunotherapy of chronic lymphocytic leukemiaNat Rev Clin Oncol20107952153220603650
- RaiKRChiorazziNDetermining the clinical course and outcome in chronic lymphocytic leukemiaN Engl J Med2003348181797179912724486
- TamCSKeatingMJChemoimmunotherapy of chronic lymphocytic leukemiaBest Pract Res Clin Haematol200720347949817707835
- Munk PedersenIReedJMicroenvironmental interactions and survival of CLL B-cellsLeuk Lymphoma200445122365237215621749
- GibsonLFSurvival of B lineage leukemic cells: Signals from the bone marrow microenvironmentLeuk Lymphoma2002431192711908727
- ManabeAMurtiKGCoustan-SmithEAdhesion-dependent survival of normal and leukemic human B lymphoblasts on bone marrow stromal cellsBlood19948337587667507732
- Paraguassú-BragaFHBorojevicRBouzasLFBarcinskiMABonomoABone marrow stroma inhibits proliferation and apoptosis in leukemic cells through gap junction-mediated cell communicationCell Death Differ20031091101110812934084
- WangLFortneyJEGibsonLFStromal cell protection of B-lineage acute lymphoblastic leukemic cells during chemotherapy requires active AktLeuk Res200428773374215158095
- TrachoothamDZhangHZhangWEffective elimination of fludarabine-resistant CLL cells by PEITC through a redox-mediated mechanismBlood200811251912192218574029
- ChiavarinaBWhitaker-MenezesDMignecoGHIF1-alpha functions as a tumor promoter in cancer associated fibroblasts, and as a tumor suppressor in breast cancer cells: Autophagy drives compartment-specific oncogenesisCell Cycle20109173534355120864819
- MaoYKellerETGarfieldDHShenKWangJStromal cells in tumor microenvironment and breast cancerCancer Metastasis Rev2013321–230331523114846
- Martinez-OutschoornUEPavlidesSWhitaker-MenezesDTumor cells induce the cancer associated fibroblast phenotype via caveolin-1 degradation: Implications for breast cancer and DCIS therapy with autophagy inhibitorsCell Cycle20109122423243320562526
- ColmoneAAmorimMPontierALLeukemic cells create bone marrow niches that disrupt the behavior of normal hematopoietic progenitor cellsScience200832259091861186519095944
- MannBSJohnsonJRCohenMHJusticeRPazdurRFDA approval summary: Vorinostat for treatment of advanced primary cutaneous T-cell lymphomaOncologist200712101247125217962618
- GrantSEasleyCKirkpatrickPVorinostatNat Rev Drug Discov200761212217269160
- DuvicMVuJVorinostat: A new oral histone deacetylase inhibitor approved for cutaneous T-cell lymphomaExpert Opin Investig Drugs200716711111120
- ClarkeJDHsuAYuZDashwoodRHHoEDifferential effects of sulforaphane on histone deacetylases, cell cycle arrest and apoptosis in normal prostate cells versus hyperplastic and cancerous prostate cellsMol Nutr Food Res2011557999100921374800
- MarksPABreslowRDimethyl sulfoxide to vorinostat: Development of this histone deacetylase inhibitor as an anticancer drugNat Biotechnol2007251849017211407
- PetruccelliLADupéré-RicherDPetterssonFVorinostat induces reactive oxygen species and DNA damage in acute myeloid leukemia cellsPLoS One201166e2098721695163
- RichonVMGarcia-VargasJHardwickJSDevelopment of vorinostat: Current applications and future perspectives for cancer therapyCancer Lett2009280220121019181442
- BlumKAAdvaniAFernandezLPhase II study of the histone deacetylase inhibitor MGCD0103 in patients with previously treated chronic lymphocytic leukaemiaBr J Haematol2009147450751419747365
- ByrdJCMarcucciGParthunMRA phase 1 and pharmacodynamic study of depsipeptide (FK228) in chronic lymphocytic leukemia and acute myeloid leukemiaBlood2005105395996715466934
- ZhangWTrachoothamDLiuJStromal control of cystine metabolism promotes cancer cell survival in chronic lymphocytic leukaemiaNat Cell Biol201214327628622344033
- ZhangWPelicanoHYinREffective elimination of chronic lymphocytic leukemia cells in the stromal microenvironment by a novel drug combination strategy using redox-mediated mechanismsMol Med Rep20151257374738826458979
- LevineBKroemerGAutophagy in the pathogenesis of diseaseCell20081321274218191218
- MizushimaNLevineBAutophagy in mammalian development and differentiationNat Cell Biol201012982383020811354
- WhiteEKarpCStroheckerAMGuoYMathewRRole of autophagy in suppression of inflammation and cancerCurr Opin Cell Biol201022221221720056400
- MathewRWhiteEAutophagy in tumorigenesis and energy metabolism: Friend by day, foe by nightCurr Opin Genet Dev201121111311921255998
- KimKHLeeMSAutophagy – a key player in cellular and body metabolismNat Rev Endocrinol201410632233724663220
- RabinowitzJDWhiteEAutophagy and metabolismScience201033060091344134821127245
- MathewRKarantza-WadsworthVWhiteERole of autophagy in cancerNat Rev Cancer200771296196717972889
- LavieuGScarlattiFSalaGRegulation of autophagy by sphingosine kinase 1 and its role in cell survival during nutrient starvationJ Biol Chem2006281138518852716415355
- KubliDAÅbGMitochondria and mitophagyCirc Res20121111208122123065344
- KimIRodriguez-EnriquezSLemastersJJSelective degradation of mitochondria by mitophagyArch Biochem Biophys2007462224525317475204
- NovakIMitophagy: A complex mechanism of mitochondrial removalAntioxid Redox Signal201217579480222077334
- Scherz-ShouvalRElazarZRegulation of autophagy by ROS: physiology and pathologyTrends Biochem Sci2011361303820728362
- Scherz-ShouvalRShvetsEFassEReactive oxygen species are essential for autophagy and specifically regulate the activity of Atg4EMBO J20072671749176017347651
- KawanoYKobuneMYamaguchiMEx vivo expansion of human umbilical cord hematopoietic progenitor cells using a coculture system with human telomerase catalytic subunit (hTERT)-transfected human stromal cellsBlood2003101253254012393449
- MatsumotoSShibuyaIKusakariSMembranous osteogenesis system modeled with KUSA-A1 mature osteoblastsBiochim Biophys Acta200517251576315996824
- RoeckleinBATorok-StorbBFunctionally distinct human marrow stromal cell lines immortalized by transduction with the human papilloma virus E6/E7 genesBlood199585499710057849321
- KurtovaAVBalakrishnanKChenRDiverse marrow stromal cells protect CLL cells from spontaneous and drug-induced apoptosis: development of a reliable and reproducible system to assess stromal cell adhesion-mediated drug resistanceBlood2009114204441445019762485
- FischerYThomasJSevillaLInsulin-induced recruitment of glucose transporter 4 (GLUT4) and GLUT1 in isolated rat cardiac myocytesJ Biol Chem199727211708570929054401
- PelicanoHFengLZhouYNovel strategy to enhance druginduced apoptosis in human leukemia cells by a reactive oxygen species-mediated mechanismJ Biol Chem2003278378323783912853461
- HuYLuWChenGK-ras(G12V) transformation leads to mitochondrial dysfunction and a metabolic switch from oxidative phosphorylation to glycolysisCell Res201222239941221876558
- MeadsMBHazlehurstLADaltonWSThe bone marrow microenvironment as a tumor sanctuary and contributor to drug resistanceClin Cancer Res20081492519252618451212
- PanayiotidisPJonesDGaneshaguruKForoniLHoffbrandAVHuman bone marrow stromal cells prevent apoptosis and support the survival of chronic lymphocytic leukaemia cells in vitroBr J Haematol1996921971038562418
- JamesDFChoiMYBettyMMosadeghiRKippsTJPrimary chronic lymphocytic leukemia (CLL) cells survival support from NLC and SDF-1a (CXCL-12) in vitro and the effect of lenalidomide (LEN)J Clin Oncol20082615_suppl7070
- DankbarBPadróTLeoRVascular endothelial growth factor and interleukin-6 in paracrine tumor-stromal cell interactions in multiple myelomaBlood20009582630263610753844
- BhatiaRWaynerEAMcglavePBVerfaillieCMInterferon-alpha restores normal adhesion of chronic myelogenous leukemia hematopoietic progenitors to bone marrow stroma by correcting impaired beta 1 integrin receptor functionJ Clin Invest19949413843917518835
- dasSKEderSSchauerSAdipose triglyceride lipase contributes to cancer-associated cachexiaScience2011333603923323821680814
- NiemanKMKennyHAPenickaCVAdipocytes promote ovarian cancer metastasis and provide energy for rapid tumor growthNat Med201117111498150322037646
- BoyaPReggioriFCodognoPEmerging regulation and functions of autophagyNat Cell Biol201315771372023817233
- JinSWhiteERole of autophagy in cancer: Management of metabolic stressAutophagy200731283116969128
- EskelinenELThe dual role of autophagy in cancerCurr Opin Pharmacol201111429430021498118
- KondoYKanzawaTSawayaRKondoSThe role of autophagy in cancer development and response to therapyNat Rev Cancer20055972673416148885
- GarridoSMAppelbaumFRWillmanCLBankerDEAcute myeloid leukemia cells are protected from spontaneous and drug-induced apoptosis by direct contact with a human bone marrow stromal cell line (HS-5)Exp Hematol200129444845711301185
- AitaVMLiangXHMurtyVVCloning and genomic organization of beclin 1, a candidate tumor suppressor gene on chromosome 17q21Genomics1999591596510395800
- LiangXHJacksonSSeamanMInduction of autophagy and inhibition of tumorigenesis by beclin 1Nature1999402676267267610604474
- Karantza-WadsworthVPatelSKravchukOAutophagy mitigates metabolic stress and genome damage in mammary tumorigenesisGenes Dev200721131621163517606641