
Abstract
Purpose: This work focuses on the characterisation of the ablated area induced by a microwave thermal ablation (MTA) procedure. An experimental methodology for establishing a straightforward correlation between the temperature gradient and the changes in the dielectric properties of the tissue is presented and discussed. Materials and methods: Temperature measurements were performed during an ablation procedure in ex vivo bovine liver, at different distances from the antenna, whereas measurements of complex permittivity were conducted in sagittal sections of the ablated samples. The measured temperatures and dielectric properties were then correlated to obtain the dependence of the dielectric properties’ spatial variation on the temperature gradient. The obtained correlation has been validated through comparison with previously obtained experimental data. A weighted cubic polynomial function and a weighted sigmoid function have been tested for best-fit interpolation of the measured data. Results: Temperatures in the range 23–105 °C were measured during the MTA procedure, while, after the end of the MTA trials, relative permittivities in the range 7–43 and electric conductivities in the range 0.3–1.8 S/m were measured according to the distance from the antenna’s axis. The polynomial function showed better regression coefficients than the sigmoid one for both the relative permittivity (R2 = 0.9947 versus R2 = 0.9912, respectively) and the conductivity (R2 = 0.9919 versus R2 = 0.9866, respectively). However, the weighted cubic function showed an unrealistic behaviour for the relative permittivity at temperatures lower than 40 °C. Conclusions: According to the results obtained, information on the changes in the dielectric properties of the tissue under MTA treatment could be inferred from measured temperature data. Once validated by in vivo studies, the proposed methodology could be exploited to develop predictive tools for treatment planning.
Introduction
In a biological tissue the induction of temperatures higher than 42 °C (hyperthermia) can alter cell homeostasis, resulting in increased susceptibility of cells to damage by other agents such as chemotherapy and radiation [Citation1–5]. Thermal sensitivity is multifactorial and tissue specific: the total amount of heat administered for a given time required to induce cell death may vary significantly between different tissues and between normal and malignant tissues [Citation6]. Extensive reviews on basic principles of temperature and time thresholds for tissue damage can be found in the literature [Citation7,Citation8]. Cell injury occurs more rapidly as the temperature rises: tissue coagulation can be induced by focal tissue heating to approximately 50 °C for less than 5 min, while almost instantaneous cell death is achieved at temperatures of about 60 °C and above [Citation9,Citation10].
Microwave thermal ablation (MTA) is a minimally invasive therapeutic technique, alternative to surgical resection, used to remove unhealthy tissue by way of a very high and localised temperature increase induced by the absorption of electromagnetic energy at microwave (MW) frequencies [Citation11,Citation12]. For MTA, a MW interstitial antenna is inserted into the body to the target area, following natural paths (veins, orifices) or percutaneously. Then, the antenna is fed by MW power with intensities up to 100 W, lasting for about 10–20 min. At the end of the treatment an ablated zone, also known as thermal lesion, is obtained: this zone is usually defined as the area of tissue where the temperature exceeded 60 °C, and it can be recognised by imaging techniques (e.g. computed tomography).
MTA is able to achieve thermal lesions with radial extension up to 5–6 cm from the MW antenna [Citation13]. This extension allows the treatment of soft-tissue pathologies such as tumours having dimensions up to 3–5 cm with a 0.5–1-cm margin of apparently healthy tissue, to eliminate microscopic foci of disease and to compensate for the uncertainty that often exists regarding the precise location of actual tumour margins [Citation10]. MTA has developed remarkably in recent years. Nowadays it is largely employed as a minimally invasive therapy for potential eradication of hepatocellular carcinoma (HCC) and other secondary liver tumours (with particular reference to colorectal cancer metastasis) in non-surgical patients [Citation14–18].
In clinical practice, the implementation of MTA treatment planning presents challenging issues, relying on the characterisation of the MW antenna [Citation19], and on the necessity of reproducing the physical processes associated with the heating of the target tissue during treatment. The latter point is particularly challenging in MTA, due to the very high temperatures, up to 100–120 °C, reached in the target tissue: in a temperature range of 60–80 °C protein denaturation occurs [Citation20,Citation21], while as temperature approaches 100 °C tissue water content drops due to the generation of water vapour and to the diffusion of water from the treated cells [Citation22]. These structural modifications lead to changes in both dielectric and thermal properties of the tissue with increasing temperature, followed by a change of the electromagnetic (EM) power deposition, of the heat conduction within the tissue, and eventually of the size and shape of the induced thermal lesion [Citation23–26].
In this work, a straightforward experimental methodology is presented and discussed to characterise the spatial variation of tissue’s dielectric properties in the thermal lesion as a function of the temperature gradient. MTA trials were conducted in samples of ex vivo adult bovine liver tissue. Temperature measurements were performed during the ablation procedure, while measurements of the complex permittivity were performed at the end of the MTA trial. Different mathematical functions were investigated for the best fit of experimental results, and compared with recent models proposed in literature.
Materials and methods
Experimental set-up and microwave thermal ablation procedure
The experimental set-up is depicted in .
Figure 1. Experimental set-up.
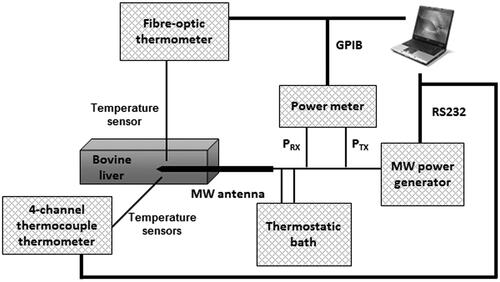
The MW antenna (manufactured by HS Hospital Service, Rome, Italy) consists of an interstitial coaxial dipole with a mini-choke to confine the energy emission in the distal zone by preventing the back-propagation of MW currents along the longitudinal axis [Citation13]. The antenna is inserted into a metal needle, and is equipped with a cooling system with water circulating from a thermostatic bath at a controlled temperature of 10 °C. MW power (2.45 GHz, continuous wave (CW)) was delivered to the antenna from a programmable MW power generator (HS Amica, HS Hospital Service). A two-channel power meter (E4419B, Agilent, Santa Clara, CA) was used to measure, through a Type N dual-coaxial reflectometer coupler (3022, Narda, Hauppauge, NY), the power delivered to and reflected by the MW antenna.
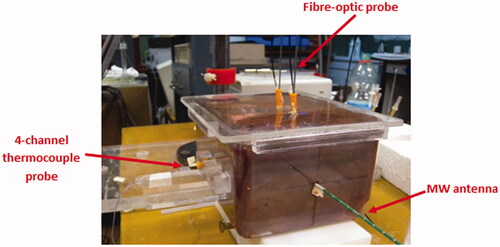
Ex vivo adult bovine liver samples were confined to a plastic box (130 × 175 × 95 mm3), made of polymethyl-methacrylate (PMMA), with holes drilled to guide the insertion of the MW antenna and of the temperature probes, as shown in . This set-up ensures accuracy and repeatability when positioning the different elements.
Figure 2. View of the plastic box with the tissue sample, temperature probes, and MW antenna.
Five MTA procedures were conducted, allowing the MW antenna to radiate a CW power of 40 W for 10 min. Software purposely developed in Labview™ and running on a personal computer (PC) managed the whole MTA session and automatically stored the measured data.
Temperature measurements
Temperature was monitored by using a fibre-optic thermometer (Luxtron 712, Santa Clara) and a four-channel thermometer equipped with a probe consisting of four type-T thermocouple sensors aligned at a mutual distance of 10 mm (TC Misure e Controlli, Turin, Italy). Temperature probes were inserted in the tissue samples through peripheral venous catheters (gauge 2.1 mm, length 48 mm) made of fluorinated ethylene propylene (FEP) polymer (BD Angiocath, Becton, Dickinson Franklin Lakes, NJ).
The temperature range of the fibre-optic thermometer is from −199.9 °C to 449.9 °C; the accuracy is ±0.1 °C root mean square (RMS) at the point of calibration, ± 0.5 °C RMS within ± 50 °C of calibration point, and ±1 °C RMS within ±100 °C of calibration point [Citation27]. The accuracy of the thermocouple sensor is ± 1 °C RMS between −40 °C and 140 °C, and ± 0.0075 × temperature (T) RMS between 140 °C and 350 °C.
The fibre-optic sensor does not interfere or couple with the MW emitted field, allowing unperturbed measurement during MTA trials. It was positioned orthogonally with respect to the antenna, and placed at a distance of about 10 mm from the antenna tip and about 4 mm from the antenna surface; this position corresponds to the area of tissue where the maximum power deposition is achieved [Citation19].
The four-channel thermocouple probe was orthogonally positioned with respect to both the MW antenna and the fibre-optic probe to minimise a potential coupling with the MW emitted field [Citation28]. The four thermocouple sensors were placed at about 10 mm from the antenna tip and measured at the distances of about 4, 14, 24 and 34 mm, respectively, from the surface of the MW antenna. In this way it was possible to measure the temperature gradient in the tissue during the MTA treatment. The positioning of the temperature probes with respect to the MW antenna is detailed in ; the accuracy of positioning is ±1 mm.
Figure 3. Detail of temperature probes orthogonally positioned with respect to the MW antenna (distances are not in scale).
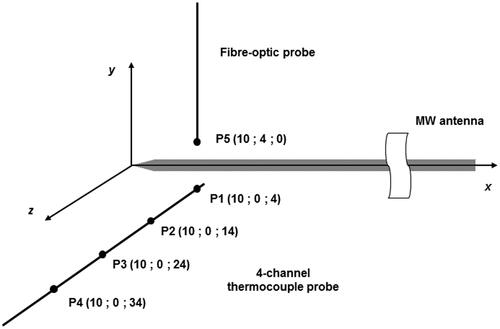
Data recorded by the thermocouple sensor placed in the measurement point P1 (see ) were double-checked by temperature data measured by the fibre-optic probe at point P5 (see ). In fact, being at the same radial distance from the MW antenna, points P1 and P5 are assumed to be at the same temperature due to the cylindrical symmetry of the MW antenna and supposing the tissue homogeneous [Citation13]. In this way it was possible to verify whether the thermocouple measurements were influenced by the presence of the MW field.
Temperatures were recorded with a sampling time of 10 s, both during the MTA procedure and for 10 min after switching off the MW power, to characterise the heating process within the tissue and to gain an insight on the heat exchange phenomena.
An optimal fitting was applied to measured temperature data by one-way non-linear regression analysis, to evaluate the temperature gradient in the zone of ablation as a function of the distance from the MW antenna’s axis.
Dielectric properties measurements
Immediately after the end of each ablation trial, the tissue sample was sectioned along the sagittal insertion plane of the MW antenna, thus exposing the thermal lesion.
The dielectric properties of the tissue were measured at 2.45 GHz using an open-ended coaxial probe (Agilent 85070E) connected to a vector network analyser (HP 8735C, Hewlett Packard, Palo Alto, CA). Measurements were remotely controlled by a specific software running on a PC, through a general-purpose interface bus (GPIB). The dielectric probe can withstand a temperature range from −40 to + 200 °C. Moreover, the probe shows a high spatial resolution thanks to its small tip (diameter 2.8 mm), and has an accuracy of measurement versus frequency and temperature of ± 5% when surrounded by at least 1 mm of tissue and inserted 5 mm deep [Citation29]. For convenience, in the following text, data on complex permittivity are provided in terms of relative permittivity (εr) and electric conductivity (σ, S/m).
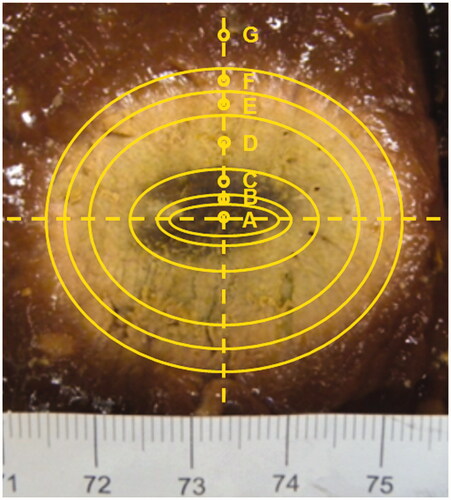
Measurements of complex permittivity were performed on the tissue’s surface at different distances from the MW antenna axis. To this end, seven ellipsoidal areas, characterised by a homogeneous level of thermal damage, were identified by visual inspection as illustrated in .
Figure 4. Sagittal cut of a liver sample along the MW antenna insertion plane after a MTA treatment and assessed isothermal lines.
Particular care was taken in order to ensure that no vessel was present in the measuring point, and that the probe’s tip was truly in contact with the tissue’s surface, to avoid possible air inclusion in the probe’s sensing area. An uncertainty of about 10% was assessed for measurements of complex permittivity, by comparing values measured with the dielectric probe contacting the tissue’s surface and with the probe inserted in the tissue at a depth of 5 mm.
A minimum of three measurements were performed in three different locations for each ellipsoidal area with homogeneous level of thermal damage. Finally, the shape and size of the thermal lesion were assessed.
To verify the reliability of the dielectric measurements performed on the tissue’s surface after the end of MTA trials, experimental results from this study were compared to the results of previous measurements performed during a MTA procedure, with the dielectric probe inserted in the tissue at a fixed location with respect to the antenna’s position [Citation24].
Modelling of the dielectric properties’ dependence on the temperature
In order to quantify the dielectric properties’ changes with the temperature, a curve fitting was performed on the measured data in a one-way non-linear weighted regression analysis with trust region algorithm. Two different mathematical functions were tested: a cubic polynomial function (Equation 1) and a sigmoid function (Equation 2):
where Y(T) represents the fitted quantity (relative permittivity or electric conductivity) as a function of the temperature, while ci (i = 1, 2, 3) and si (i = 1, 2, 3) are the regression coefficients for the cubic polynomial function and the sigmoid function, respectively.
The results of the obtained models were then compared with measured data as well as with a sigmoid model recently proposed in the literature [Citation23].
Results
Temperature measurements during MW ablation
compares the temperature patterns measured by the fibre-optic probe (point P5, ) and by the thermocouple probe (point P1, ) during the MTA trials and over 10 min after switching the MW power off. In the figure, the average values over the five experiments are reported, together with the margins of uncertainty. The standard uncertainty of temperature measurements (confidence interval (CI) 95%) was assessed to be no higher than 7.3% for the thermocouple probe, and no higher than 6.6% for the fibre-optic probe.
Figure 5. Temperature patterns (mean values and standard uncertainties (95% CI)) measured by the fibre-optic probe and by a thermocouple probe in the tissue area of maximum power deposition [Citation19] (points P1 and P5, as in ) during MTA trials (40 W, 10 min) and for 10 min after switching off the MW power.
![Figure 5. Temperature patterns (mean values and standard uncertainties (95% CI)) measured by the fibre-optic probe and by a thermocouple probe in the tissue area of maximum power deposition [Citation19] (points P1 and P5, as in Figure 3) during MTA trials (40 W, 10 min) and for 10 min after switching off the MW power.](/cms/asset/a6e2bca0-cc79-4990-9689-9ef412d915da/ihyt_a_879744_f0005_b.jpg)
As can be seen from , there is no significant difference between the temperature values measured by the two probes. This proves that the orthogonal positioning of the thermocouple probe can minimise a potential interference with the MW field, even when measuring in the proximity of the antenna, thus confirming the results previously obtained [Citation28].
In the temperature values (mean values and standard uncertainties) measured by the four-channel thermocouple probe at the 10th minute (end of the MTA procedure, just before switching off the MW power), are reported as a function of the radial distance from the MW antenna’s axis (measurement points P1, P2, P3, P4, as in ).
Table I. Temperature values measured at the end of the MTA procedure (just before switching off the MW power) as a function of the distance from the MW antenna axis (measurement points P1–P4 as in ).
An exponential function was used for optimal fitting of temperature data as a function of the distance from the MW antenna’s axis in one-way non-linear regression analysis, based on the observed trend of decay shown by measured data. The resulting best-fit equation is:
where T is the temperature (°C), r is the distance (mm) from the MW antenna’s axis, a1 = 134.37 (°C) and a2 = −0.052 (mm−1) are the regression coefficients, with R2 = 0.9965.
In the temperature data (mean values and standard uncertainty) measured at the 10th minute of the MTA procedure are reported as a function of the distance from the MW antenna’s axis, together with the best-fit exponential regression line.
Figure 6. Temperatures (mean values and standard uncertainties (95% CI)) measured at the end of the MTA procedure just before switching off the MW power () in the tissue area of maximum power deposition [Citation19], and best fit exponential regression as a function of the distance from the MW antenna axis.
![Figure 6. Temperatures (mean values and standard uncertainties (95% CI)) measured at the end of the MTA procedure just before switching off the MW power (Table I) in the tissue area of maximum power deposition [Citation19], and best fit exponential regression as a function of the distance from the MW antenna axis.](/cms/asset/378e4e29-af73-486d-a322-0f67c3fdc771/ihyt_a_879744_f0006_b.jpg)
Dielectric measurements in the thermal lesion
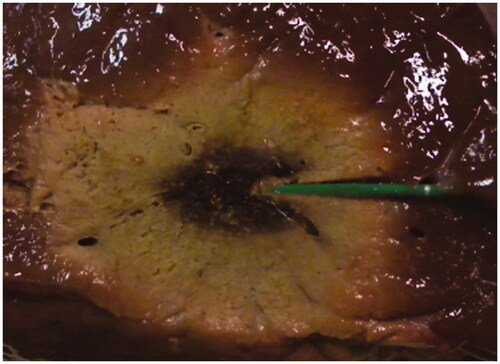
Immediately after the end of each ablation trial, the tissue sample was sectioned along the sagittal insertion plane of the MW antenna, to expose the thermal lesion. The lesion had a symmetrical ellipsoidal shape, with an average longitudinal dimension L = 43 mm ± 3 mm and an average radial dimension R = 17.5 mm ± 1.5 mm. The central coagulative region, where tissue charring occurred, showed an arrow shape, as in , due to the action of the antenna’s cooling system.
Figure 7. Sagittal cut of a liver sample along the MW antenna insertion plane after a MTA treatment (40 W, 10 min).
After locating seven ellipsoidal areas with homogeneous levels of thermal damage (see ), measurements of the complex permittivity at 2.45 GHz were performed. reports the relative permittivity (εr) and conductivity (σ, S/m) in terms of mean values and standard deviations, measured in the ellipsoidal areas of tissue with a homogeneous thermal damage, as well as the ranges of temperature reached in the same areas at the 10th minute of the MTA procedure, assessed through the best-fit Equation 3.
Table II. Dielectric parameters measured at 2.45 GHz (mean values and standard deviations) and assessed temperature ranges as a function of the distance from the MW antenna axis.
In the experimental results of (measured post) are plotted as a function of the temperature, together with previous results of temperature-dependent tissue’s dielectric properties measured during an ex vivo MTA procedure (measured real-time) [Citation24]. In Lopresto et al. [Citation24], measurements were performed during the MTA trials (30 W radiated for 10 min) with the dielectric probe inserted into the tissue at a fixed position, located at about 5 mm from the surface of the MW antenna and about 10 mm from the antenna’s tip.
Figure 8. Comparison on the experimental results (mean values and standard deviations) of the relative permittivity (A), and conductivity (B) as a function of the temperature, measured after the end of the MTA procedure at different distances from the MW antenna axis (measured post, 40 W, 10 min, ) and during a MTA procedure at a fixed location (measured real-time, 30 W, 10 min [Citation24]).
![Figure 8. Comparison on the experimental results (mean values and standard deviations) of the relative permittivity (A), and conductivity (B) as a function of the temperature, measured after the end of the MTA procedure at different distances from the MW antenna axis (measured post, 40 W, 10 min, Table II) and during a MTA procedure at a fixed location (measured real-time, 30 W, 10 min [Citation24]).](/cms/asset/98d78d00-eaa0-407f-88c5-d7d29404aba3/ihyt_a_879744_f0008_b.jpg)
As can be seen from , up to the temperature of about 100 °C a good agreement can be inferred between the two temperature-dependent experimental patterns both with reference to the relative permittivity and the conductivity. For temperatures higher than 100 °C data of real-time measurements are not available, as the temperature did not exceed 100 °C at the measurement position.
Modelling of temperature-dependent changes in the dielectric properties
Cubic polynomial functions and sigmoid functions were considered for best fitting of experimental data in , in one-way non-linear weighted regression analysis with trust region algorithm. The resulting best-fit functions are reported in Equations 1 and 2. The regression coefficients obtained for the cubic polynomial functions ci (i = 1, 2, 3) are reported in , while the regression coefficients obtained for the sigmoid functions si (i = 1, 2, 3) are reported in .
Table III. Regression coefficients and R2 for weighted cubic polynomial functions.
Table IV. Regression coefficients and R2 for weighted sigmoid functions.
shows the comparisons between the sigmoid and cubic best-fit models of the temperature-dependent patterns of the dielectric parameters with respect to the experimental data. reports the mean percentage differences of the fitted data with respect to the measured ones (), together with the experimental standard deviations. From it can be noted that the mean percentage differences are within the experimental standard deviations over all temperature ranges.
Figure 9. Sigmoid and cubic best-fit models of temperature-dependent dielectric parameters with respect to measured data (mean values and standard deviations): (A) relative permittivity, (B) conductivity (S/m).
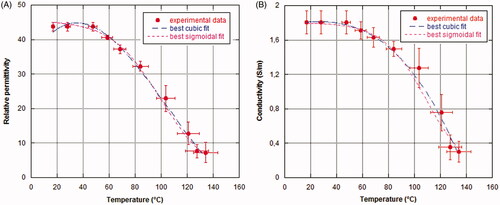
Table V. Mean percentage difference in fitting models of temperature-dependent dielectric parameters compared to percentage standard deviations of experimental data.
In the sigmoid functions derived from best fitting of measured data are compared with the sigmoid functions proposed in [Citation23]. From the figure it can be seen that for temperatures higher than 90–100 °C the sigmoid functions proposed in the literature provide very low permittivity and conductivity values with respect to the experimental values obtained by the present study.
Figure 10. Comparison between the sigmoid functions evaluated in this work and the sigmoid functions proposed by Ji and Brace [Citation23]: (A) relative permittivity, (B) conductivity (S/m).
![Figure 10. Comparison between the sigmoid functions evaluated in this work and the sigmoid functions proposed by Ji and Brace [Citation23]: (A) relative permittivity, (B) conductivity (S/m).](/cms/asset/7c6329c6-0557-4ca1-9b31-18c7a3cd8485/ihyt_a_879744_f0010_b.jpg)
Discussion
MTA induces very high temperatures in the tissue during the treatment. These temperatures lead to irreversible structural changes linked to protein denaturation [Citation20–21] as well as to the reduction of water content as the temperature approaches 100 °C [Citation22]. These occurrences in turn lead to changes in both the dielectric and thermal properties of the tissue with increasing temperature, affecting the EM power deposition, the heat conduction within the tissue, and consequently the size and shape of the induced thermal lesion [Citation23–26].
In this work the spatial variation of the dielectric properties of ex vivo bovine liver and the temperature gradient achieved in the zone of ablation during a MTA procedure were measured and correlated. The aim of the study was to propose and validate a methodology to derive the values of the dielectric properties from temperature measurements in the tissue, according to a procedure which should not be based on dielectric properties measurements performed during the MTA treatment.
To validate the proposed methodology the experimental data summarised in were compared to previous measurements of the changes of the dielectric properties with the temperature, performed during MTA trials on ex vivo bovine liver [Citation24] (). It is worth noting that the results of the present study refer to trials performed by radiating a MW power of about 40 W for 10 min and measuring the temperature increases during the MTA procedure at several locations in the tissue, as well as the dielectric properties after the end of the ablation procedure at several positions on a sagittal section of the tissue (measured post). On the other hand, the results of the previous work refer to trials performed radiating a power of about 30 W for 10 min and measuring both the temperature increases and the dielectric properties at a fixed location within the tissue during the MTA procedure (measured real-time). Accordingly, the data compared in are referring to different ablation processes and different measurement procedures; yet both approaches lead to similar results, showing that the changes in the tissue’s dielectric properties during a MTA treatment depend neither on the measurement procedure nor on the characteristics of the heating process, but rely on the temperature reached in the measurement location, which is correlated to the delivered energy. Moreover, the close agreement confirms that the observed changes are irreversible, as was demonstrated in the literature [Citation24,Citation30]. It is interesting to note here that these results hold particularly true for points located at the boundaries of the thermal lesion, where heating at mild temperatures (lower than 60 °C) was achieved.
By correlating temperature data with dielectric properties values, information on the spatial variation of tissue’s dielectric properties as a function of the temperature gradient in the thermal lesion can be provided ().
This relation can be exploited in several ways. At first, by relating the data reported in with a visual analysis of the zone of ablation (), the following considerations can be made: the light red colour zone observed in the peripheral area of the lesion (15 mm < r < 18 mm), which is usually defined a congestive zone [Citation31,Citation32], can be related to heating at mid-range temperatures (53–62 °C); the grey-white colour zone (6 mm < r < 15 mm), which is associated with the ablated area, corresponds to heating at higher temperatures (62–98 °C); the central burnt area, close to the tip of the antenna (r < 6 mm), is the coagulative region where temperatures higher than 100 °C were reached and tissue charring occurred.
Moreover, the proposed methodology being simple, it could be used to increase the amount of available data on dielectric properties’ dependence on the temperature, both with reference to the considered liver tissue and with reference to other normal as well as pathological tissues [Citation33]. Up to now, to the authors’ knowledge, only two works reported measurements of tissue dielectric properties as a function of the temperature in a MTA procedure [Citation23,Citation24].
A further field of application of the proposed methodology could be the temperature mapping by way of non-invasive measurements of the EM field. Low-invasive temperature mapping is a critical issue in thermal therapies. While magnetic resonance imaging (MRI) would be the best choice to obtain temperature data, its widespread use is limited by its cost, and by a low compatibility with the MW heating devices. On the other hand, some papers showed that in phantoms it is possible to reconstruct the dielectric properties’ values either from the measurement of a scattered EM field [Citation34,Citation35] or from the changes in the phase of an EM field in a resonator [Citation36]. Then, exploiting the temperature dependence of tissue dielectric properties, the temperature distribution has been obtained [Citation34–36]. Up to now these approaches have been investigated considering the temperature range of hyperthermia therapies. The proposed methodology could also help develop similar procedures for MTA treatments.
To help develop a quantitative model, best fitting of measured data was investigated using either weighted cubic polynomial functions or weighted sigmoid functions. The accuracy of both fitting models was evaluated by comparing the mean percentage differences of the fitted data with respect to the measured ones and considering the experimental standard deviations (). With respect to the considered fitting functions, and show that the weighted cubic polynomial functions would represent the optimal fitting compared to the weighted-sigmoid functions for both the relative permittivity (R2 = 0.9947 versus R2 = 0.9912, respectively) and the conductivity (R2 = 0.9919 versus R2 = 0.9866, respectively). However, the weighted cubic function for the relative permittivity shows an unrealistic temperature-dependent decreasing pattern (see ) for temperatures lower than 40 °C, which can be found in the tissue area outside the zone of ablation. Therefore, the weighted sigmoid fitting can be considered as a more appropriate model for predicting the temperature-dependent changes in tissue’s dielectric parameters during a MTA process.
Comparison of the obtained model with a sigmoid function recently proposed in the literature [Citation23] showed that the published sigmoid function gives lower values for the dielectric properties at the highest temperatures considered (>100 °C). This point should be investigated further, both with reference to the gathering of a larger number of measurement data at high temperatures, and with reference to the implications on the numerical modelling of the temperature increases in MTA [Citation37].
Limitations of this study are mainly linked to the validation of the proposed methodology in ex vivo experimental procedures, where only ex vivo bovine liver was employed. Successive steps should be to consider different ex vivo tissues, and moving on to in vivo animal studies. Changing the target tissue will lead to different temperature coefficients for the measured dielectric properties values, while in vivo studies could show the influence on the obtained results of the presence of blood perfusion, and the differences between healthy and malignant tissues.
Once validated with animal studies, the methodology could be employed in the clinical practice of MTA, since temperature measurements are carried out particularly when the zone to be treated is close to a critical organ, to ensure a safe temperature range in that location [Citation38]. According to the results of the present work, in vivo temperature measurements could be exploited to reconstruct a posteriori the pattern of the in vivo changes in the dielectric properties during a MTA procedure. Such information cannot be achieved through direct in vivo dielectric properties measurements, due to ethical reasons, but it is of great importance to help develop reliable numerical tools to optimise clinical protocols [Citation32,Citation39].
Conclusions
An experimental methodology for establishing a straightforward correlation between the changes in tissue dielectric properties and the temperature gradient during a MTA process is presented and discussed.
Results demonstrated that the spatial variation of the dielectric properties in the thermal lesion is correlated to the temperature gradient induced during the heating process, and that the changes in the dielectric properties neither depend on the measurement procedure nor on the MTA modalities, but rely on the maximum temperature reached.
The outcomes of this study could be exploited to develop predictive tools for treatment planning in the clinical practice of MTA.
Declaration of interest
The authors acknowledge the R&D Unit of HS Hospital Service, Rome, for having made available the MW antennas and the MW power generator. The authors alone are responsible for the content and writing of the paper.
Acknowledgements
The authors acknowledge Sergio Mancini (ENEA, Rome) for his technical support essential to accomplish the experimental work, and Caterina Merla (ENEA) for her support in the best-fit analysis.
References
- Robinson JE, Wizenberg MJ, McReady WA. Combined hyperthermia and radiation suggest an alternative approach to heavy particle therapy for reduced oxygen enhancement ratios. Nature 1974;251:521–2
- Guy AW, Lehmann JF, Stonebridge JB. Therapeutic applications of electromagnetic power. Proc IEEE 1974;62:55–75
- Douple EB, Strohbehn JW, Bowers ED, Walsh JE. Cancer therapy with localized hyperthermia using an invasive microwave system. J Microw Power 1979;14:181–6
- Overgaard J. Hyperthermia as an adjuvant to radiotherapy: Review of the randomized multicenter studies of the European Society for Hyperthermic Oncology. Strahlenther Onkol 1987;163:453–7
- Seegenschmiedt MH, Brady LW, Sauer R. Interstitial thermoradiotherapy: Review on technical and clinical aspects. Am J Clin Oncol 1990;13:352–63
- Mertyna P, Dewhirst MW, Halpern E, Goldberg W, Goldberg SN. Radiofrequency ablation: The effect of distance and baseline temperature on thermal dose required for coagulation. Int J Hyperthermia 2008;24:550–9
- Dewhirst MW, Vigilanti BL, Lora-Michiels M, Hanson M, Hoopes PJ. Basic principles of thermal dosimetry and thermal thresholds for tissue damage from hyperthermia. Int J Hyperthermia 2003;19:267–94
- Yarmolenko PS, Moon EJ, Landon C, Manzoor A, Hochman DW, Viglianti BL, et al. Thresholds for thermal damage to normal tissues: An update. Int J Hyperthermia 2011;27:320–43
- Goldberg SN, Gazelle GS, Mueller PR. Thermal ablation therapy for focal malignancy: A unified approach to underlying principles, techniques, and diagnostic imaging guidance. Am J Roentgenol 2000;174:323–31
- Ahmed M, Brace CL, Lee FT Jr, Goldberg SN. Principles of and advances in percutaneous ablation. Radiology 2011;258:351–69
- Ryan TP, Turner PF, Hamilton B. Interstitial microwave transition from hyperthermia to ablation: Historical perspectives and currents trends in thermal therapy. Int J Hyperthermia 2010;26:415–33
- Chiang J, Wang P, Brace CL. Computational modelling of microwave tumour ablations. Int J Hyperthermia 2013;29:308–17
- Cavagnaro M, Amabile C, Bernardi P, Pisa S, Tosoratti N. A minimally invasive antenna for microwave ablation therapies: Design, performances, and experimental assessment. IEEE Trans Biomed Eng 2011;58:949–59
- Hamazoe R, Hirooka Y, Ohtani S, Katoe T, Kabara N. Intraoperative microwave tissue coagulation as treatment for patients with nonresectable hepatocellular carcinoma. Cancer 1995;75:794–800
- Livraghi T, Lazzaroni S, Meloni F. Radiofrequency thermal ablation of hepatocellular carcinoma. Eur J Ultrasound 2001;13:159–66
- Schwartz M, Roayaie S, Konstadoulakis M. Strategies for the management of hepatocellular carcinoma. Nat Clin Pract Oncol 2007;4:424–32
- Callstrom MR, Charboneau JW. Technologies for ablation of hepatocellular carcinoma. Gastroenterology 2008;134:1831–5
- Feliberti EC, Wagman LD. Radiofrequency ablation of liver metastases from colorectal cancer. Cancer Control 2006;13:48–51
- Lopresto V, Pinto R, Lodato R, Lovisolo GA, Cavagnaro M. Design and realisation of tissue-equivalent dielectric simulators for dosimetric studies on microwave antennas for interstitial ablation. Phys Med 2012;28:245–53
- Chin L Sherar M. Changes in dielectric properties of ex vivo bovine liver at 915 MHz during heating. Phys Med Biol 2001;46:197–211
- Bircan C, Barringer SA. Determination of protein denaturation of muscle foods using the dielectric properties. J Food Sci 2002;67:202–5
- Yang D, Converse MC, Mahvi D, Webster JG. Measurement and analysis of tissue temperature during microwave liver ablation. IEEE Trans Biomed Eng 2007;54:150–5
- Ji Z, Brace CL. Expanded modelling of temperature-dependent dielectric properties for microwave thermal ablation. Phys Med Biol 2011;56:5249–64
- Lopresto V, Pinto R, Lovisolo GA, Cavagnaro M. Changes in the dielectric properties of ex vivo bovine liver during microwave thermal ablation at 2.45 GHz. Phys Med Biol 2012;57:2309–27
- Ai H, Wu S, Gao H, Zhao L, Yang C, Zeng Y. Temperature distribution analysis of tissue water vaporization during microwave ablation: Experiments and simulations. Int J Hyperthermia 2012;28:674–85
- Yang D, Converse MC, Mahvi DM, Webster JG. Expanding the bioheat equation to include tissue internal water evaporation during heating. IEEE Trans Biomed Eng 2007;54:1382–8
- Luxtron User’s Manual. Luxtron Model 712 Fluoroptic Thermometer Part Number 38–11490–01, revision D, March 1998
- Lopresto V, Pinto R, Zambotti A, Mancini S, Lodato R, D’Atanasio P, et al. Microwave thermal ablation: Changes in the dielectric parameters of ex vivo bovine liver during the treatment. Conf Proc EBEA 2011;5132. Abstract Collection Book of EBEA 2011 Conference. ISBN 978-88-8286-231-2
- Agilent Technologies. User’s manual. Agilent 85070E Dielectric Probe Kit 200 MHz to 50 GHz 5989-0222EN. 2011. http://cp.literature.agilent.com/litweb/pdf/5989-0222EN.pdf [Last accessed 31 January 2014].
- Brace CL. Temperature-dependent dielectric properties of liver tissue measured during thermal ablation: Toward an improved numerical model. Conf Proc IEEE Eng Med Biol Soc 2008;230–3
- Goldberg SN, Gazelle GS, Compton CC, Mueller PR, Tanabe KK. Treatment of intrahepatic malignancy with radiofrequency ablation. Cancer 2000;88:2452–63
- Chiang J, Wang P, Brace CL. Computational modelling of microwave tumour ablations. Int J Hyperthermia 2013;29:308–3
- O’Rourke AP, Lazebnik M, Bertram JM, Converse MC, Hagness SC, Webster JG, et al. Dielectric properties of human normal, malignant and cirrhotic liver tissue: In vivo and ex vivo measurements from 0.5 to 20 GHz using a precision open-ended coaxial probe. Phys Med Biol 2007;52:4701–19
- Chang JT, Paulsen K, Meaney P, Fanning M. Non-invasive thermal assessment of tissue phantoms using an active near field microwave imaging technique. Int J Hyperthermia 1998;14:513–34
- Meaney PM, Paulsen KD, Fanning MW, Li D, Fang Q. Image accuracy improvements in microwave tomographic thermometry: Phantom experience. Int J Hyperthermia 2003;19:534–50
- Ishihara Y, Ohwada H. Non-invasive temperature measurement by using phase changes in electromagnetic waves in a cavity resonator. Int J Hyperthermia 2011;27:726–36
- Cavagnaro M, Lopresto V, Pinto R. On the modelling of the temperature increase obtained in a microwave thermal ablation process. Paper presented at the BioEM2013 – Joint Meeting of the Bioelectromagnetics Society and the European BioElectromagnetics Association, Thessaloniki, Greece, 10–14 June 2013
- Li M, Yu X, Liang P, Liu F, Dong B, Zhou P. Percutaneous microwave ablation for liver cancer adjacent to the diaphragm. Int J Hyperthermia 2012;28:218–26
- Shafirstein G, Feng Y. Editorial: The role of mathematical modelling in thermal medicine. Int J Hyperthermia 2013;29:259–61