Abstract
Background. Genes upregulated by low oxygen have been suggested as endogenous markers for tumor hypoxia. Yet, most of the genes investigated have shown inconsistent results, which have led to concerns about their ability to be true hypoxia makers. Previous studies have demonstrated that expression of hypoxia induced genes can be affected by extracellular pH (pHe). Methods. Five different human cell lines (SiHa, FaDuDD, UTSCC5, UTSCC14 and UTSCC15) were exposed to different oxygen concentrations and pH (7.5 or 6.3), and gene expression analyzed with microarray (Affymetrix - Human Genome U133 Plus 2.0 Array). Results. An analysis of two of the cell lines using SAM identified 461 probesets that were able to separate the four groups “Normal oxygen, normal pH”, “Low oxygen, normal pH”, “Normal oxygen, low pH” and “Low oxygen, low pH”. From here it was possible to identify a fraction of probesets induced at low oxygen independent of pH in these two cell lines, this fraction included HIG2, NDRG1, PAI1 and RORA. Further verification by qPCR highlighted the necessity of using more cell lines to obtain a robust gene expression profiles. To specifically select pH independent hypoxia regulated genes across more cell lines, data for FaDuDD, UTSCC5, UTSCC14 and UTSCC15 were analyzed to identify genes that were induced by hypoxia in each cell line, where the induction was not affected by low pH, and where the gene was not significantly induced by low pH alone. Each cell line had 65–122 probesets meeting these criteria. For genes to be considered as target genes (hypoxia inducible pH independent), genes had to be present in three of four cell lines. Conclusion. The result is a robust hypoxia profile unaffected by pH across cell lines consisting of 27 genes. This study demonstrates a way to identify hypoxia markers by microarray, where other factors in the tumor microenvironment are taken into account.
Solid malignant tumors are characterized by an inadequate vascular system, which can give rise to microregional areas deprived in nutrients and oxygen [Citation1,Citation2]. The oxygen deficient hypoxic cells have been shown to have a significant negative impact on outcome [Citation3–7], especially in carcinomas of the uterine cervix and of the head and neck treated with radiotherapy [Citation4–6]. Several genes have demonstrated to be upregulated in hypoxic cells, including hypoxia inducible factor 1α (HIF1A), carbonic anhydrase 9 (CA9), glucose transporter 1 (GLUT1), and lactate dehydrogenase A (LDHA) [Citation8–15]. Many studies have tested these genes as endogenous reporters of hypoxia. None of these have, however, proven their ability as markers of hypoxia and to predict prognosis (reviewed in [Citation16]). In particular, studies comparing CA9 and GLUT1 both to each other, but also to more conventional measurements of tumor oxygenation status, such as polarographic measurements with the Eppendorf electrode or the binding of the exogenous immunohistochemical hypoxic marker pimonidazole hydrochloride (PIMO), have been controversial [Citation17–21].
Additional attempts to use microarray technology to discover new genes upregulated by hypoxia include an in vitro approach where Chi et al. used five different non-carcinogenic cell lines, exposed to different grades of hypoxia (2% and 0.02%) for different time periods [Citation22]. This data set was employed by Seigneuric et al., to identify both an early and a very different late hypoxia response, and to correlate the early hypoxia signature to survival in a cohort of patients with breast cancer [Citation23]. Denko et al. employed a cDNA array containing 6 800 genes to analyze six different cell lines, including the carcinoma cell lines FaDu, SiHa and C33a, under a not clearly defined “long term hypoxia” to identify 110 genes that were hypoxia-responsive [Citation24]. Winter et al. suggested in 2007 a hypoxic metagene containing 99 genes. Microarray results from 59 head and neck cancer tissue were clustered, and genes displaying similarity with a set of known hypoxia-regulated genes (e.g. CA9 and GLUT1) were included in the metagene [Citation25].
The tumors microenvironment is not only characterized by different grades of hypoxia, but also acidosis is a well-known phenomenon in many tumors. This is both due to a high rate of glycolysis – the so-called Warburg effect [Citation26] – and to the chaotic microcirculation [Citation27–30]. Studies have shown tumor pH in the range of 6.15–7.4 [Citation2,Citation31]. Previously we have demonstrated that extracellular pH influences hypoxia related gene expression to a large extent [Citation13,Citation32], with low pHe suppressing the hypoxia induced upregulation of gene expression in a number of genes, especially CA9. This may account for the non-consistent correlation these genes have previously shown to PIMO and Eppendorf measurements.
Recently, Chen et al. [Citation33] published a gene expression study with one epithelial cell line exposed to hypoxia and lactic acidosis, pH 6.7. They demonstrated a difference in gene expression in cells subjected to hypoxia and acidosis and to cells subjected to hypoxia alone.
The current study is an in vitro approach, where we have used five carcinoma cell lines (SiHa, FaDuDD, UTSCC5, UTSCC14 and UTSCC15) treated with different microenvironmental factors, and analyzed gene expression with microarray to identify a robust hypoxia profile unaffected by pH across cell lines.
Methods
Cell culture and hypoxia treatment
The human uterine cervix squamous cell carcinoma (SiHa) cell line was obtained from the American Type Culture Collection (ATCC, Rockville, MD). The head and neck squamous cell carcinomas FaDuDD, a subline of FaDu (an undifferentiated hypopharygeal SCC), UtScc5, UtScc14 and UTSCC15 (established from tumors from the tongue by Dr. Reidar Grenman, University of Turku, Finland [Citation34]), obtained from Dr. Michael Baumann. Cells were cultured in 80 cm2 flasks (NUNC) in Eagle´s minimal essential medium with glutaMAX I and Earle's balanced salt solution (Gibco) containing 1.5 g/L sodium bicarbonate, 0.1 mM non-essential amino acids, 1.0 mM sodium pyruvate, 10% fetal calf serum, 100 000 U/L penicillin, and 100 mg/L streptomycin (SiHa), or in Dulbeccos modified Eagle medium with glutaMAX I containing 1.5g/L sodium bicarbonate, 2% HEPES, 0.1 mM non-essential amino acids, 1.0 mM sodium pyruvate, 10% fetal calf serum, 100 000 U/L penicillin, and 100 mg/L streptomycin (FaDuDD, UTSCC5, UTSCC14 and UTSCC15), with 5% CO2 in a well humidified incubator. For experiments, 2 × 10⁵ cells were seeded into 60 mm glass Petri dishes three days prior to experiments, at which time cells were in the log-phase of growth. Medium was exchanged prior to hypoxia treatment. Hypoxia was achieved by continually gassing the cells in an airtight chamber for 24 hours with either atmospheric air, 5%, 1%, 0.1%, 0.01% or 0% oxygen, supplemented with 5% CO2 and nitrogen, at 37°C. To simulate acidosis, pH of the medium (without sodium bicarbonate) was buffered with 20 mM tris(Hydroxymethyl) aminomethane (TRIS) base (Sigma), 20 mM 2-(N-Morpholino)ethanesulfonic acid (MES) (Sigma) and 0.52 g/l NaHCO3 (Sigma) and titrated to 6.3 or 7.4. The pH adjusted media was applied immediately before the induction of hypoxia. Cell mortality under all conditions was below 5%.
RNA extraction and oligonucleotide microarray analysis
Immediately after removal from the airtight chamber, media was removed and 350 μl RTL buffer (Qiagen) containing 10 ml/l β-mercaptoethanol (Merch, Germany) was added to the Petri dishes. Cells were homogenized in a QiaShredder filter (Qiagen) at 10 000 rpm for two minutes. RNA was extracted using the RNeasy Mini Kit (Qiagen) according to the manufactures instructions. RNA eluted in RNase free water was quantified using a spectrophotometer (SmartSpec™ Plus, Biorad). For analysis of global expression levels the samples was analyzed on the Human Genome U133 Plus 2.0 Array (AROS Applied Biotechnology, Aarhus, Denmark). All array data was normalized using Bioconducter 4.0 with the Affy package and MAS 5.0 [Citation35]. For the gene clustering analysis, data, including probesets with known unique gene ID, was analyzed with Gene Cluster 2.11 (Michael Eisen, rana.lbl.gov/EisenSoftware.htm) using Pearsons correlation and complete linkage, Java Treeview (ver 1.1.3) and SAM (ver 3.02).
For the profiling analysis genes were considered according to the following criteria: 1) the gene has a 2-fold or higher expression at 0.1% oxygen pH 7.5 than at 5% oxygen pH 7.5 and the difference of the two is five times above noise level; 2) The gene has a 2-fold or higher expression at 0.1% oxygen pH 6.3 than at 5% oxygen pH 6.3 and the difference of the two is five times above noise level; 3) The gene has a 2-fold or higher expression at 0.1% oxygen pH 6.3 than at 5% oxygen pH 7.5 and the difference of the two is five times above noise level and 4) The gene expression level at 5% pH 6.3 is not more than 50% higher than the difference between 5% pH 7.5 and 0.1% pH 6.3. Noise level was set to 200. Analysis were done in Microsoft Excel.
Reverse transcription and Real Time Polymerase Chain Reaction (Real Time PCR)
cDNA was generated using the High Capacity cDNA Archive kit (Applied Biosystems; ABI) according to the manufacturer's instructions. Total RNA (2 μg) was reverse transcribed using random hexamer primers. To detect transcripts of interest, TaqMan Gene Expression assay (ABI) was used for HIG2 (Hs00203383), NDRG1 (Hs00608389), PAI-1 (Hs01126606), RORA (Hs00536545), TFRC (4333770F) and GUSB (4333767F). For each reaction, cDNA (corresponding to 20 ng RNA), 1x assay mix and 1x Taqman Universal PCR mastermix (ABI) in a total of 25 μl was mixed. Reactions were performed on an ABI Prism 7000 Sequence Detector (ABI). All reactions were performed in triplicate. Results were normalized to the housekeeping gene Transferrin receptor (TFRC). This housekeeping gene was selected on the basis of a TaqMan Human Endogenous control plate (ABI) on which cDNA from the different treatments was analyzed against 12 common housekeeping genes [Citation13]. The results were analyzed using the Comparative CT method.
Mouse xenografts
Xenograft tumors of the FaDuDD cell line were grown by subcutaneously injecting cells into the back of nude mice (NMRI (nu/nu)) which were whole body irradiated with 4 Gy (240 kV Philips X-ray machine) two days before injection. When the tumors had reached ∼200 mm3 in size, the mice were placed in a gas chamber and exposed to a continuous flow of either 10% O2 + 90% nitrogen (hypoxia group) or normal air (control group) at a flow rate of 1.33 L/min as previously described [Citation36]. There were six tumors in each group. After hypoxic treatment, the mice were injected intraperitoneally (i.p.) with 60 mg/kg PIMO 90 min prior to the tumors were excised. The excised tumors were snap frozen in liquid nitrogen. To extract RNA, the tumor tissue was homogenized in RTL buffer (Qiagen) containing 10 ml/l β-mercaptoethanol (Merch, Germany) through an QIAshredder homogenizer spin-column (Qiagen). RNA was extracted using the RNeasy Mini Kit (Qiagen) according to the manufactures instructions. RNA eluted in RNase free water was quantified using a spectrophotometer (SmartSpec™ Plus, Biorad).
Identification of signaling pathways
The Ingenuity Pathway Analysis software (IPA) (Ingenuity Systems, Mountain View, USA) was utilized to identify networks of interacting genes and other functional groups. A cut-off ratio of 1.5 was used to define genes. Using the IPA Functional Analysis tool, we were able to associate biological functions to the experimental results.
Results
Clustering of hypoxia treated cell lines
Two squamous cell carcinoma cell lines, SiHa (cervical cancer) and FaDuDD (head and neck cancer), treated with different grades of hypoxia and pH was analyzed by Affymetrix Gene Expression Microarray. Data for both cell lines was analyzed by unsupervised hierarchical clustering (). This demonstrated that the genes separated into two main groups, representing the two cell lines. Within each cell line, the samples then clustered into high and low pH. Finally, the clustering showed that in both cell lines and both pH groups, 21% and 5% oxygen cluster close together. The same is evident for 0% and 0.1% oxygen. For 1% oxygen there was no clear trend; in the SiHa cells, a high resemblance with 5% oxygen for both low and normal pH was observed, while in the FaDuDD cells the 1% groups with 0% and 0.1% oxygen with normal pH, but with 21% and 5% oxygen at low pH.
Figure 1. An unsupervised hierarchical clustering of normalized data from SiHa and FaDuDD cells treated with hypoxia and low pH.
Clustering of pH independent hypoxia regulated genes
Based on the unsupervised clustering of the samples, we defined four groups for further analysis, combining both cell lines, “Normal oxygen, normal pH” (21%, pH 7.5; 5%, pH 7.5), “Low oxygen, normal pH” (0.1%, pH 7.5; 0%, pH 7.5), “Normal oxygen, low pH” (21%, pH 6.3; 5%, pH 6.3), “Low oxygen, low pH” (0.1%, pH 6.3; 0%, pH 6.3) (). The samples treated with 1% oxygen did not, based on the previous unsupervised clustering, fit in to these groups, and was therefore not included in the further analysis.
Figure 2. Separating pH independent hypoxia upregulated genes in SiHa and FaDuDD cells. The grouping of samples for the multiclass SAM analysis enabling a hierarchical clustering (median centered genes, complete linkage) of data. Red is upregulated, green is down regulated.
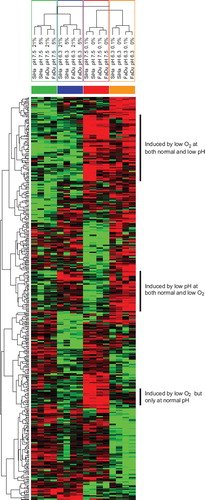
Using a multiclass Significance Analysis of Microarray (SAM) of probesets expressed above the 25% quartile in more than half of the samples and a false discovery rate of 15%, 461 probesets were identified that were able to separate the four groups. A hierarchical clustering (median centered genes, complete linkage) of samples based on the selected probesets is illustrated in . Most of the genes identified this way were genes suppressed by low pH, both at normal and low oxygen. However, it was possible to select a fraction of probesets induced at low pH independent of oxygen concentration (i.e., probesets upregulated in the two sample groups “Normal oxygen, low pH” and “Low oxygen, low pH”). It was also possible to identify a fraction of probesets induced at low oxygen only at normal pH (i.e. probesets upregulated only in the sample group “Low oxygen, normal pH”). Finally, probesets induced at low oxygen independent at pH could be identified. This group consisted of probesets upregulated in both the two sample groups “Low oxygen, normal pH” and “Low oxygen, low pH”. CA9 was found amongst the top genes upregulated at low oxygen only at normal pH. Most genes identified also came up when running a similar analysis with array data normalized with RMA (data not shown).
Follow-up of microarray results by qPCR
As a technical control of the microarray analysis, four genes that demonstrated a high SAM score in the fraction of probesets upregulated by hypoxia under both low and normal pH in both MAS and RMA normalized data sets were selected to be validated by qPCR. This was done on RNA from the same experiment as had been used for the microarray analysis (Supplemental Figure 1). These genes were Hypoxia Inducible Gene 2 (HIG2), N-myc downstream regulated gene 1 (NDRG1), SERPINE1 (PAI1) and retinoic acid-receptor-related orphan receptor A (RORA). As a biological control to determine whether the same expression patterns could be found in an in vivo system, tumor xenografts of FaDuDD cells were grown on nude mice. The mice where placed in a pressure chamber to breathe either 10% O2 (hypoxia group) or normal air (control group) for 24 hours. This has, in other tumor models, been shown to lower the tumor pO2 significantly [Citation37]. Thereafter, the whole tumor was homogenized and gene-expression was measured by qPCR for HIG2, NDRG1, PAI1, RORA and CA9. GUSB was applied as a control. As can be seen in , all five genes exhibit a higher level of gene expression in the hypoxia group compared to the control group. CA9 is the gene least upregulated, with an increase of average ∼2-fold in the hypoxia group. HIG2, NDRG1 and RORA show an average increase of ∼2.5-fold, while PAI1 shows the highest average increase of ∼4.5-fold.
Figure 3. Expression of CA9, HIG2, NDRG1, PAI-1 and RORA in FaDuDD xenograft tumors from mice exposed to either 10% oxygen (hypoxia group) or atmospheric air (control) measured by qPCR. Expression levels are normalized to expression of the housekeeping gene TFRC. Expression of GUSB is measured as control. Each point represents an individual mouse tumor; horizontal bar is the average value.
To ascertain whether the expression patterns of these genes were maintained across other cell lines, the experiments were repeated in three independent experiments using UtScc5, UtScc14 and UTSCC15 cells (). Only HIG2 demonstrated a similar pattern across the cell lines: an upregulation by hypoxia at normal pH in all five cell lines, and an even higher level of hypoxic upregulation at low pH. PAI1, NDRG1 and RORA exhibited cell specific responses.
Figure 4. Expression of HIG2, NDRG1, PAI-1 and RORA in A) UTSCC5 B) UtScc14 and C) UTSCC15 cells at different oxygen concentration at either normal pH (•) or low pH (○) measured by qPCR. Expression levels are normalized to expression of the housekeeping gene TFRC, and represented relative to expression levels at 21% O2. Results show mean (+/−. 1 S.E.) from three independent experiments.
Hypoxia profile: pH independent hypoxia regulated genes
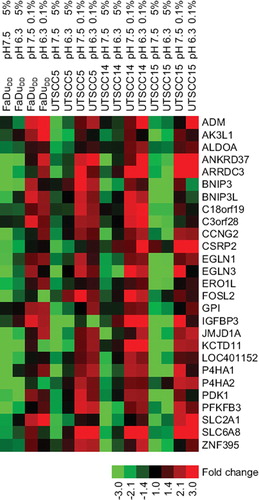
To specifically select pH independent hypoxia regulated genes across more cell lines, four treatments were applied for further microarray studies of the head and neck cancer cell lines UTSCC5, UTSCC14 and UTSCC 15: 5% oxygen, pH 7.5; 0.1% oxygen, pH 7.5; 5% oxygen, pH 6.3 and 0.1% oxygen, pH 6.3. Data for all five cell lines were analyzed to select genes based on different criteria. For genes to be considered as target genes (hypoxia inducible pH independent), expression had to be at least 2-fold upregulated in 0.1% oxygen at both normal and low pH, and there had to be at least a 2-fold difference between 5% O2 pH 7.5 and 0.1% O2 pH 6.3. Furthermore, expression at 5% O2 pH 6.3 should not exceed 50% of the difference between 5% O2 pH 7.5 and 0.1% O2 pH 7.5. When applying these four criteria, 80 probesets came up for SiHa, 65 for FaDuDD, 78 for UTSCC5, 89 for UTSCC14 and 122 for UTSCC15. When looking for common genes across the cell lines using this approach, no genes were common in all five. But when excluding SiHa from the analysis, the remaining cell lines (FaDuDD, UTSCC5, UTSCC14 and UTSCC15) had 13 probesets in common for all four cell lines. For genes to be considered robust target genes, they had to meet the above mentioned criteria in three of four cell lines. This resulted in 37 probesets, representing 27 different genes. These 27 genes are shown in a heat map in , in which the fold difference is median centered across all cell lines. It can be seen that the basal expression level of the genes is approximately equal in the four cell lines. Nine of these 27 genes were also found as target genes in SiHa cells.
Figure 5. Heat map of the 27 genes that was found as hypoxia induced, pH unaffected in three of four cell lines. The colour bar is showing the fold change relative to the median expression of each gene across all cell lines and conditions.
Pathway analysis
To study the biological context of the genes that was regulated in response to hypoxia and acidosis, the cut-off value was set to 1.5-fold difference, for both up and down-regulated genes (Genes and fold values are shown in supplemental Table). Hereby 44 genes were found upregulated and 92 down-regulated. To study whether these 136 genes interacted biologically they were analyzed via Ingenuity Pathway Analysis. These networks indicated functional relationships between gene products based on known interactions in the literature. Three major regulatory networks with an IPA score ≥18, indicating a less than 10-18 chance than the genes in the network is associated together solely due to random events, were linked to the 44 upregulated genes (), and five networks were linked to the 92 down-regulated genes (Top three networks are shown in ). The most affected canonical pathways linked to the upregulated genes were Glycolysis/Gluconeogenesis, Fructose and Mannose Metabolism, Arginine and Proline Metabolism and HIF1α Signaling. In total 30 pathways were identified for the upregulated genes.
Table I. The genetic networks affected in hypoxic, acidic cells.
Discussion
Previous studies have demonstrated that the hypoxia induced upregulation of CA9 and other genes is compromised by low pHe in SiHa and FaDuDD cells [Citation13,Citation32]. Therefore, genes that are upregulated by hypoxia independent of other factors in the microenvironment may be more consistent markers of tumor hypoxia. In this study, total gene expression of five human squamous cell carcinoma cell lines exposed to different oxygen concentrations at either normal or low pHe was analyzed by microarray to identify genes upregulated by hypoxia, independent of pHe.
In data from SiHa and FaDuDD cells, unsupervised clustering revealed a high similarity between cells treated with 21% and 5% oxygen, within each cell line. This demonstrates that when performing in vitro hypoxia experiments, both of these oxygen concentrations are suitable as controls. This is has been an issue due to normal oxygen levels in tissues being around 5% oxygen, whereas the oxygen concentration for in vitro cultures is atmospheric air, 21% oxygen. The 1% oxygen sample falls into either “high” or “low” oxygen, dependent on the cell type. Therefore, as it seems to be cell line specific, the 1% data was not included in the subsequent analyses.
Using a SAM multiclass analysis, it was possible to identify different sets of genes that were associated with the different exposures to oxygen and pH, including a fraction of genes upregulated by hypoxia independent of pH. To test the expression of these genes across more cell lines, four selected genes (PAI1, HIG2, RORA and NDRG1) were analyzed by qPCR. All four genes have previously been reported as hypoxia inducible [Citation22,Citation38–46]. In FaDuDD all four genes were induced by hypoxia both at normal and low pH, but in UTSCC5, UTSCC14 and UTSCC15 the patterns were more heterogeneous and the genes displayed only partly pH independent hypoxia induction.
An in vivo study in FaDuDD xenografts showed an upregulation in hypoxic tumors of these four genes. Furthermore, all four genes were more upregulated than CA9. This is in spite of the findings from in vitro studies that have demonstrated CA9 to be up to over 100 times upregulated under hypoxia in FaDuDD cells [Citation32]. This difference could be due to the high heterogeneity in the tumor, with areas not only characterized by low oxygen but also by low pH.
Microarray gene expression data from UTSCC5, UTSCC14 and UTSCC15 were applied, enabling a robust signature across cell lines to be identified. An analysis approach using different criteria was used, making it possible to distinguish genes that in each cell line were induced by hypoxia, where the induction was not affected by low pH, and where the gene was not significantly induced by low pH alone. Each cell line had 65–122 probesets meeting these criteria, but when looking for common probesets across the cell lines, the probesets of SiHa differed from the other cell lines. Amongst the analyzed cell lines, SiHa is the only cervical cancer, whereas the others all are head and neck cancers. SiHa has also been shown to have a predominantly non-glycolytic phenotype, as opposed to most cancer cells which have a elevated aerobic glycolysis (the Warburg effect) [Citation47]. This might influence this cell lines response to hypoxia. Hence, SiHa was excluded from the analysis. To be considered as hypoxic induced pH independent gene, it had to be common in three of the four cell lines. Thirty seven probesets, representing 27 different genes, met this criterion. These 27 genes compose a hypoxic profile not influenced by microenvironmental factors. The four genes selected from the first analysis, HIG2, PAI1, RORA and NDRG1 were not included in the 27 genes found in the second analysis. All four did, as expected, meet the criterions in the SiHa and the FaDuDD cells, but in the other cell lines HIG2 was upregulated by low pH at normal oxygen concentration. PAI1, in UTSCC 5 and 14, was not induced by low oxygen at either pH, and for RORA the upregulation was compromised at low pH. NDRG1 was included with a cut-off value at 1.5-fold, but not at 2-fold.
Functional interpretation of significant genes in the context of molecular networks and relevance to canonical pathways was generated through the use of Ingenuity Pathways Analysis. The genes consistently upregulated after hypoxic and acidic treatment was detected in pathways related to glucolysis, metabolism and HIF1α. While most genes were implicated in glucolysis and metabolism pathways, three of the upregulated genes were involved in HIF1α signaling: SLC2A1 (GLUT1), EGLN1 and EGLN3. The two latter are both prolyl hydroxylases, which contributes to HIF1α degradation at normoxia, and have previously demonstrated to be upregulated under hypoxia [Citation48].
In conclusion, this in vitro study has identified genes that in four human squamous cell carcinoma cell lines are up- or down-regulated under hypoxia without influence of low pHe. Previously used endogenous marker of hypoxia, such as CA9, can be highly influenced by low pHe. Due to the Warburg effect and the heterogeneity in tumors, regions with low oxygen levels may overlap with regions of low pHe. The genes identified here therefore represent novel candidates for endogenous markers of hypoxia, which are not influenced by these local differences in the tumor microenvironment.
Supplementary Material
Download PDF (64.9 KB)Acknowledgements
The authors would like to thank Inger Marie Horsman, Inger Marie Thuesen, Bente Kierkegaard and Alice Baden for excellent technical help. Financial support was received from the Danish Cancer Society, the Danish Medical Research Council, the Danish Council for Strategic Research, and CIRRO – The Lundbeck Foundation Centre for Interventional Research in Radiation Oncology.
Declaration of interest: The authors report no conflicts of interest. The authors alone are responsible for the content and writing of the paper.
References
- Bussink J, Kaanders JH, van der Kogel AJ. Tumor hypoxia at the micro-regional level: Clinical relevance and predictive value of exogenous and endogenous hypoxic cell markers. Radiother Oncol 2003;67:3–15.
- Vaupel P, Kallinowski F, Okunieff P. Blood flow, oxygen and nutrient supply, and metabolic microenvironment of human tumors: A review. Cancer Res 1989;49:6449–65.
- Nordsmark M, Alsner J, Keller J, Nielsen OS, Jensen OM, Horsman MR, . Hypoxia in human soft tissue sarcomas: Adverse impact on survival and no association with p53 mutations. Br J Cancer 2001;84:1070–5.
- Nordsmark M, Overgaard M, Overgaard J. Pretreatment oxygenation predicts radiation response in advanced squamous cell carcinoma of the head and neck. Radiother Oncol 1996;41:31–9.
- Hockel M, Schlenger K, Aral B, Mitze M, Schaffer U, Vaupel P. Association between tumor hypoxia and malignant progression in advanced cancer of the uterine cervix. Cancer Res 1996;56:4509–15.
- Brizel DM, Sibley GS, Prosnitz LR, Scher RL, Dewhirst MW. Tumor hypoxia adversely affects the prognosis of carcinoma of the head and neck. Int J Radiat Oncol Biol Phys 1997;38:285–9.
- Brizel DM, Scully SP, Harrelson JM, Layfield LJ, Bean JM, Prosnitz LR, . Tumor oxygenation predicts for the likelihood of distant metastases in human soft tissue sarcoma. Cancer Res 1996;56:941–3.
- Vordermark D, Brown JM. Evaluation of hypoxia-inducible factor-1alpha (HIF-1alpha) as an intrinsic marker of tumor hypoxia in U87 MG human glioblastoma: In vitro and xenograft studies. Int J Radiat Oncol Biol Phys 2003;56: 1184–93.
- Airley R, Loncaster J, Davidson S, Bromley M, Roberts S, Patterson A, . Glucose transporter glut-1 expression correlates with tumor hypoxia and predicts metastasis-free survival in advanced carcinoma of the cervix. Clin Cancer Res 2001;7:928–34.
- Airley RE, Loncaster J, Raleigh JA, Harris AL, Davidson SE, Hunter RD, . GLUT-1 and CAIX as intrinsic markers of hypoxia in carcinoma of the cervix: Relationship to pimonidazole binding. Int J Cancer 2003;104:85–91.
- Hoskin PJ, Sibtain A, Daley FM, Wilson GD. GLUT1 and CAIX as intrinsic markers of hypoxia in bladder cancer: Relationship with vascularity and proliferation as predictors of outcome of ARCON. Br J Cancer 2003;89:1290–7.
- Lukacova S, Khalil AA, Overgaard J, Alsner J, Horsman MR. Relationship between radiobiological hypoxia in a C3H mouse mammary carcinoma and osteopontin levels in mouse serum. Int J Radiat Biol 2005;81:937–44.
- Sørensen BS, Hao J, Overgaard J, Vorum H, Honore B, Alsner J, . Influence of oxygen concentration and pH on expression of hypoxia induced genes. Radiother Oncol 2005;76:187–93.
- Koukourakis MI, Giatromanolaki A, Sivridis E, Bougioukas G, Didilis V, Gatter KC, . Lactate dehydrogenase-5 (LDH-5) overexpression in non-small-cell lung cancer tissues is linked to tumour hypoxia, angiogenic factor production and poor prognosis. Br J Cancer 2003;89:877–85.
- Lukacova S, Sørensen BS, Alsner J, Overgaard J, Horsman MR. The impact of hypoxia on the activity of lactate dehydrogenase in two different pre-clinical tumour models. Acta Oncol 2007;47:941–7.
- Moon EJ, Brizel DM, Chi JT, Dewhirst MW. The potential role of intrinsic hypoxia markers as prognostic variables in cancer. Antioxid Redox Signal 2007;9:1237–94.
- Jonathan RA, Wijffels KI, Peeters W, de Wilde PC, Marres HA, Merkx MA, . The prognostic value of endogenous hypoxia-related markers for head and neck squamous cell carcinomas treated with ARCON. Radiother Oncol 2006;79:288–97.
- Lal A, Peters H, St Croix B, Haroon ZA, Dewhirst MW, Strausberg RL, . Transcriptional response to hypoxia in human tumors. J Natl Cancer Inst 2001;93:1337–43.
- Olive PL, Aquino-Parsons C, MacPhail SH, Liao SY, Raleigh JA, Lerman MI, . Carbonic anhydrase 9 as an endogenous marker for hypoxic cells in cervical cancer. Cancer Res 2001;61:8924–9.
- Takagi H, King GL, Aiello LP. Hypoxia upregulates glucose transport activity through an adenosine-mediated increase of GLUT1 expression in retinal capillary endothelial cells. Diabetes 1998;47:1480–8.
- Eriksen JG, Horsman MR. Tumour hypoxia – A characteristic feature with a complex molecular background. Radiother Oncol 2006;81:119–21.
- Chi JT, Wang Z, Nuyten DS, Rodriguez EH, Schaner ME, Salim A, . Gene expression programs in response to hypoxia: Cell type specificity and prognostic significance in human cancers. PLoS Med 2006;3:e47.
- Seigneuric R, Starmans MH, Fung G, Krishnapuram B, Nuyten DS, van EA, . Impact of supervised gene signatures of early hypoxia on patient survival. Radiother Oncol 2007;83:374–82.
- Denko NC, Fontana LA, Hudson KM, Sutphin PD, Raychaudhuri S, Altman R, . Investigating hypoxic tumor physiology through gene expression patterns. Oncogene 2003;22:5907–14.
- Winter SC, Buffa FM, Silva P, Miller C, Valentine HR, Turley H, . Relation of a hypoxia metagene derived from head and neck cancer to prognosis of multiple cancers. Cancer Res 2007;67:3441–9.
- Stubbs M, McSheehy PM, Griffiths JR, Bashford CL. Causes and consequences of tumour acidity and implications for treatment. Mol Med Today 2000;6:15–9.
- Brown JM, Wilson WR. Exploiting tumour hypoxia in cancer treatment. Nat Rev Cancer 2004;4:437–47.
- Sutherland RM. Cell and environment interactions in tumor microregions: The multicell spheroid model. Science 1988; 240(4849):177–84.
- Sutherland RM, Ausserer WA, Murphy BJ, Laderoute KR. Tumor hypoxia and heterogeneity: Challenges and opportunities for the future. Semin Radiat Oncol 1996;6:59–70.
- Tannock IF, Rotin D. Acid pH in tumors and its potential for therapeutic exploitation. Cancer Res 1989;49: 4373–84.
- Helmlinger G, Yuan F, Dellian M, Jain RK. Interstitial pH and pO2 gradients in solid tumors in vivo: High-resolution measurements reveal a lack of correlation. Nat Med 1997;3: 177–82.
- Sørensen BS, Alsner J, Overgaard J, Horsman MR. Hypoxia induced expression of endogenous markers in vitro is highly influenced by pH. Radiother Oncol 2007;83:362–6.
- Chen JL, Lucas JE, Schroeder T, Mori S, Wu J, Nevins J, . The genomic analysis of lactic acidosis and acidosis response in human cancers. PLoS Genet 2008;4: e1000293.
- Eicheler W, Zips D, Dorfler A, Grenman R, Baumann M. Splicing mutations in TP53 in human squamous cell carcinoma lines influence immunohistochemical detection. J Histochem Cytochem 2002;50:197–204.
- Gautier L, Cope L, Bolstad BM, Irizarry RA. affy–analysis of Affymetrix GeneChip data at the probe level. Bioinformatics 2004;20:307–15.
- Ehrnrooth E, von der MH, Sørensen BS, Poulsen JH, Horsman MR. The ability of hypoxia to modify the gene expression of thymidylate synthase in tumour cells in vivo. Int J Radiat Biol 1999;75:885–91.
- Lukacova S, Overgaard J, Alsner J, Horsman MR. Strain and tumour specific variations in the effect of hypoxia on osteopontin levels in experimental models. Radiother Oncol 2006;80:165–71.
- Fitzpatrick TE, Graham CH. Stimulation of plasminogen activator inhibitor-1 expression in immortalized human trophoblast cells cultured under low levels of oxygen. Exp Cell Res 1998;245:155–62.
- Pinsky DJ, Liao H, Lawson CA, Yan SF, Chen J, Carmeliet P, . Coordinated induction of plasminogen activator inhibitor-1 (PAI-1) and inhibition of plasminogen activator gene expression by hypoxia promotes pulmonary vascular fibrin deposition. J Clin Invest 1998;102:919–28.
- Koong AC, Denko NC, Hudson KM, Schindler C, Swiersz L, Koch C, . Candidate genes for the hypoxic tumor phenotype. Cancer Res 2000;60:883–7.
- Bayer C, Schilling D, Hoetzel J, Egermann HP, Zips D, Yaromina A, . PAI-1 levels predict response to fractionated irradiation in 10 human squamous cell carcinoma lines of the head and neck. Radiother Oncol 2008;86: 361–8.
- Denko N, Schindler C, Koong A, Laderoute K, Green C, Giaccia A. Epigenetic regulation of gene expression in cervical cancer cells by the tumor microenvironment. Clin Cancer Res 2000;6:480–7.
- Miki N, Ikuta M, Matsui T. Hypoxia-induced activation of the retinoic acid receptor-related orphan receptor alpha4 gene by an interaction between hypoxia-inducible factor-1 and Sp1. J Biol Chem 2004;279:15025–31.
- Chauvet C, Bois-Joyeux B, Danan JL. Retinoic acid receptor-related orphan receptor (ROR) alpha4 is the predominant isoform of the nuclear receptor RORalpha in the liver and is up-regulated by hypoxia in HepG2 human hepatoma cells. Biochem J 2002;364:449–56.
- Said HM, Stein S, Hagemann C, Polat B, Staab A, Anacker J, . Oxygen-dependent regulation of NDRG1 in human glioblastoma cells in vitro and in vivo. Oncol Rep 2009; 21:237–46.
- Chauvet C, Bois-Joyeux B, Berra E, Pouyssegur J, Danan JL. The gene encoding human retinoic acid-receptor-related orphan receptor alpha is a target for hypoxia-inducible factor 1. Biochem J 2004;384:79–85.
- Busk M, Horsman MR, Kristjansen PE, van der Kogel AJ, Bussink J, Overgaard J. Aerobic glycolysis in cancers: Implications for the usability of oxygen-responsive genes and fluorodeoxyglucose-PET as markers of tissue hypoxia. Int J Cancer 2008;122:2726–34.
- Pescador N, Cuevas Y, Naranjo S, Alcaide M, Villar D, Landazuri MO, . Identification of a functional hypoxia-responsive element that regulates the expression of the egl nine homologue 3 (egln3/phd3) gene. Biochem J 2005; 390: 189–97.