Abstract
Clinical implementation of adaptive radiotherapy strategies could benefit from extended tools for plan evaluation and selection. For this purpose we investigated the feasibility of image-based tumour control probability (TCP) modelling using the bladder as example of a tumour site with potential benefit from adaptive strategies. Material and methods. Two bladder cancer patients that underwent planning CT and daily cone beam CT (CBCT) imaging during the treatment course were included. The bladder was outlined in every image series. Following a previously published procedure, various adaptive planning target volumes (PTVs) were generated from the inter-fractional bladder variation observed during the first four CBCT sessions. Intensity modulated treatment plans delivering 60 Gy to a given PTV were generated. In addition, simultaneous integrated boost (SIB) plans giving a 10 Gy boost to the tumour were created. Using the daily CBCT images and polynomial warping, the dose in each bladder volume element was tracked fraction by fraction. TCP calculations employing the tracked accumulated dose distributions, together with radiosensitivity parameters estimated from published data on local control of bladder cancer were performed. The dependence of TCP on the simulated clonogenic cell distribution was also explored. Results. For a uniform clonogenic cell density in the whole bladder, TCP varied between 53% and 58% for the 60 Gy plans, while it was between 51% and 64% for the SIB plans. The lowest values were found when using the smallest PTVs, as they did not geometrically enclose the clinical target volume in all fractions. When increasing the clonogenic cell density in the tumour relative to that in the remaining bladder, the TCP saturated at approximately 75% for the SIB plans. Conclusion. Dose tracking and TCP calculation provided additional information to standard criteria such as geometrical coverage for the selected cases. TCP modelling may be a useful tool in plan evaluation and for selection between multiple plans.
Recent in-room imaging techniques, such as cone beam computed tomography (CBCT), have allowed for the use of new strategies in radiotherapy both in terms of patient positioning and treatment adaptation. Adaptive strategies may include soft tissue registration, individualised or multiple treatment plans and inter-fraction dose accumulation [Citation1–9]. Individualised planning target volumes (PTVs) may be generated to match the clinical target volume (CTV) for various shapes or sizes during the whole treatment course [Citation2,Citation4,Citation7].
The selection of a treatment plan of the day from multiple alternatives may not be straightforward. Inter-fraction variations in patient anatomy can cause changes in the positions of the CTV and normal tissues relative to the high dose volume. Three-dimensional imaging prior to treatment allows for selection of the most suitable plan on a daily basis, based on geometrical criteria. On the other hand, conventional treatment plans are usually based on dose volume histograms for the diseased volume and organs at risk outlined in a pre-treatment CT. Following daily imaging, doses to each volume element can be tracked using rigid or non-rigid registration and accumulated dose-volume histograms can be used to evaluate and re-plan the treatment if necessary [Citation8,Citation10]. However, neither geometrical, nor dose-volume criteria provide information on biological effects such as normal tissue complication probabilities (NTCP) or tumour control probability (TCP). Implementation of novel strategies, such as simultaneous integrated tumour boosts (SIBs), cannot fully be based on previous methods due to the lack of empirical data. Mathematical modelling of normal and tumour tissue responses may then help selecting the appropriate adaptive treatment plan or strategy.
This study investigated the use of TCP modelling used as a tool for evaluation and selection between adaptive intensity modulated radiotherapy (IMRT) plans, created based on volumetric criteria. Besides whole bladder irradiation plans, SIB plans delivering an additional 10 Gy dose to the tumour were investigated. The density of clonogenic cells in the bladder wall and tumour was varied in order to evaluate potential clinical advantages of the SIB.
Material and methods
Patient material
Two bladder cancer patients who underwent a planning CT (Phillips Mx8000 and BB16) and 27 and 21 daily CBCT (Varian OBI 1.4) scans were selected for the study. The in-plane resolution of all images was 1×1 mm and the slice thickness 3 mm. All CTVs, or bladders, were outlined by a single observer. The CBCTs were registered to the planning CT by overlapping the geometrical centres of the CTVs. Patient characteristics have been described previously [Citation7].
PTV generation
The adaptive strategies used for the study were based on a previously published method [Citation7]. Initially three PTVs for whole bladder irradiation were created: a standard plan and two adaptive plans. The standard plan was based on the ITV used at Aarhus University Hospital (AUH) which is generated by expanding the CTV as seen in the planning CT by margins of 1.0 cm inferior and lateral, 1.5 cm posterior and 2.0 cm anterior and superior. Since the additional ITV-to-PTV margin assumes set-up based on skin markers and not on bony structures the ITV (and not the PTV) was used. The first adaptive plan, AI with PTVAI, was based on the total volume occupied by (i.e. the union of) the CTV in the planning CT and the CTVs in the first four CBCT image series. The second adaptive plan, AII with PTVAII, was also based on this union, but with regions covered by the CTV only once excluded.
Resulting volumes of the standard PTV, PTVAI and PTVAII were 445 cm3, 160 cm3 and 136 cm3 for patient 1 and 438 cm3, 155 cm3 and 129 cm3 for patient 2. The standard PTV had for both patients full geometric coverage of the CTV on all the remaining daily CBCTs not used in planning. In all fractions, PTVAI geometrically covered 95% of the repeat scan CTV for both patients. It also covered 99% of the CTV in 16 of 23 repeat CBCTs for patient 1 and 15 of 16 for patient 2. Furthermore, for patient 1, PTVAII geometrically covered all 23 repeat scan CTVs to 90%, 18 scans of them to 95% and 12 scans to 99%. Correspondingly, for patient 2 PTVAII geometrically covered 95% of the repeat scan CTV in all 16 fractions and covered 13 of them to 99%. In a clinical day-to-day adaptive strategy the three different PTVs should be used in parallel, selecting the smallest PTV that covers the CTV seen on the image of the day.
For the SIB, boost volumes were created by 5 mm isotropic expansion of the tumour as contoured on the CT. This resulted in boost volumes of 25 cm3 and 45 cm3 for the patients 1 and 2 respectively. To obtain SIB PTVs, the boost volumes were added to the standard PTV and PTVAII.
IMRT plans and adaptive strategies
A total of five IMRT plans for each patient were generated as follows: The standard and the adaptive uniform dose AI and AII plans (all three for 60 Gy whole bladder irradiation) and the AII and standard SIB plans with an additional 10 Gy tumour boost. All treatment plans were created in Varian Eclipse Aria (Varian Medical Systems, Palo Alto, CA, USA) and planned for delivery over 30 fractions. Constraints on the 60 Gy plans used were minimum and maximum doses of 59 Gy and 63 Gy, respectively, to the whole PTV with the mean dose constrained to 60 Gy. The dose gradient was allowed to decrease freely within a 5 mm isotropic margin around the PTV, whereafter it was forced as low as possible without compromising target dose following standard AUH/ICRU criteria. No other normal tissue constraints were used. Doses to the 70 Gy SIB volumes were constrained similarly to the doses to the 60 Gy volumes, but without the additional isotropic 5 mm margin.
To simulate a ‘plan of the day’ treatment course the 60 Gy plans were combined by choosing the smallest PTV for each fraction fulfilling the geometric selection criteria. The two geometrical criteria applied were a minimum of 95% and 99% coverage of each individual fraction CTV. After exclusion of the four CBCTs used in planning, 23 and 16 CBCTs for each patient respectively remained for evaluation. To simulate treatment based on 30 fractions, the remaining 7 and 14 fraction dose distributions were generated based on the voxel mean doses in the existing fractions.
Dose tracking
Fraction-by-fraction dose tracking was done using polynomial warping following Arnesen et al. [Citation11] and is only briefly described here. First, the geometrical centre of the bladder was identified. Second, radial lines from the centre to the bladder wall were extended, resulting in 7 000 control points on each CTV surface. For a uniform sphere the generated intersection points would be isotropically distributed. The set of points defining the bladder wall at treatment fraction n, (Xn, Yn, Zn) was fitted to the set of points for the reference bladder in the planning CT, (X0, Y0, Z0). Coefficients for transformation between the repeat and planning structure could thus be derived. Using the polynomial warping procedure, the bladder wall is assumed to be stretched or shrunk along the radial lines extending from the centre, where the degree of stretching/shrinking is contained in the polynomial coefficients. The tumour, only visible on the CT, was assumed to be transformed according to the whole bladder deformation.
Accumulated doses were obtained by extracting the IMRT dose distribution in the CTV in a given treatment fraction, and allocating doses to the reference (CT) CTV according to the polynomial transformations. Tracked doses to a 3 mm thick bladder wall and the tumour were then extracted. After conversion of the Eclipse dose matrices in Ruby Dicom (open source software; http://dicom.rubyforge.org/), dose tracking and further simulations were done in the interactive data language (IDL, Research Systems, Inc., Boulder, USA).
Tumour control probability modelling
Assuming no cell repopulation during the therapy course, the surviving fraction of clonogenic cells in voxel i after 30 fractions is given by
where di,j is the voxel dose in fraction j, while α and β are the radiosensitivity parameters describing the LQ-survival curve [Citation12,Citation13]. Assuming Poisson statistics, the probability of finding no surviving clonogenic cells within a voxel is:
where Vvox is the voxel volume and ρi the density of clonogenic cells in the voxel. The product of all voxel control probabilities, VCPs, gives the overall tumour control probability, TCP:
TCP according to does not take variations in radiosensitivity across a patient population into account. To include inter-patient variations, the linear radiosensitivity parameter α was assumed to be normally distributed with a standard deviation σα (references in [Citation13]). Convolving with a Gaussian distribution g(α) for α thus gives the more realistic expression for TCP:
For bladder cancer, the target volume consists of the primary tumour and the bladder wall. It is likely that the density of clonogenic cells in the tumour is higher than in the wall, that is, ρtumour > ρwall. Therefore the TCP for the entire target volume becomes:

In the current work, the clonogenic cell density was assumed to be constant within the tumour and the wall, respectively. In the simulations, variations in relative clonogenic cell density between the tumour and the wall was incorporated using ρrel = ρtumour/ρwall. For a constant total number of clonogenic cells in the whole target volume consisting of the bladder wall and tumour, increasing ρrel shifts clonogenic cells from the wall into the tumour by decreasing and increasing the numbers of clonogenic cells in respective sub-volumes.
For patients 1 and 2, the tumour volumes as contoured on the CT scans, were 7 cm3 and 14 cm3. Normally, bladder cancer radiotherapy is preceded by tumour resection, and a volume of ∼10 cm3 for the remaining tumour tissue is therefore considered realistic. With a uniform clonogenic cell density of 107 cm−3, as suggested by Webb and Nahum [Citation12], the total number of clonogenic cells is thus 10 × 107=108. Pos with colleagues estimated the α/β ratio of bladder cancer to be 13 Gy [Citation14], which was adopted in the current study. To estimate α and σα a restricted non-linear least squares fit of the TCP model in to the local control data reviewed by Pos et al. [Citation14], was performed. Fitting constraints were 108 clonogenic cells and 95% and 0% local control for total doses of 100 Gy and 30 Gy, respectively. The resulting curve fit is shown in . Estimated parameter values were α=0.29 Gy−1 andσα= 0.08 Gy−1 with a corresponding Pearson's correlation coefficient of R= 0.7.
Figure 1. Local control (LC) for bladder cancer following radiotherapy. The dose is given as the equivalent dose in 2 Gy fractions, assuming ?/?=13 [Citation14]. Points correspond to clinical data (references in [Citation14]) and the solid line to the TCP model prediction ().
![Figure 1. Local control (LC) for bladder cancer following radiotherapy. The dose is given as the equivalent dose in 2 Gy fractions, assuming ?/?=13 [Citation14]. Points correspond to clinical data (references in [Citation14]) and the solid line to the TCP model prediction (Equation 4).](/cms/asset/6cf6d49f-41a9-4ffc-bb8e-da46485bd30c/ionc_a_498431_f0001_b.gif)
Results
Doses and tracking
Dose distributions for two of the plans, AII and AII with SIB, together with variations in the bladder contour in one axial slice for patient 1 are shown in . Corresponding tracked dose volume histograms for the mean bladder dose and fraction doses for the bladders contoured in the 23 CBCT scans in question are presented in . The inhomogeneity is due to the lack of geometrical coverage for some fractions. For all investigated treatment plans minimum, maximum and average doses following tracking over 30 fractions are displayed in . When used over the 23 fractions available the standard plan with the largest margin showed least dose variation.
Figure 2. Dose distributions and bladder contour variation for patient 1, A) for the AII and B) for the AII SIB plan. The white lines show the bladder contour on the same CT-plane in each of the 23 repeat CBCT scans used for evaluation.
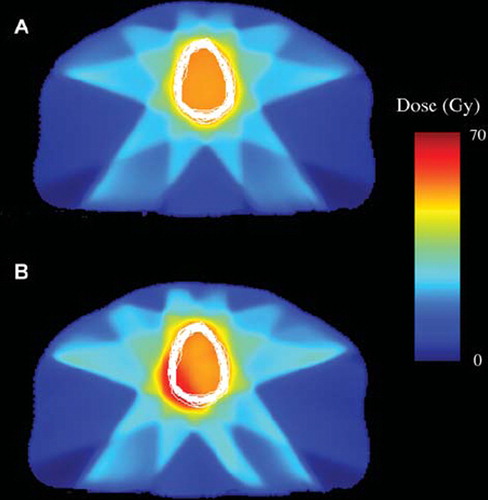
Figure 3. Tracked dose volume histograms for patient 1 for the AII plan without (upper) and with a 10 Gy SIB (lower). Black lines display the DVHs for each of the 23 CBCTs used in evaluation, while the red lines are the averages over all scans.
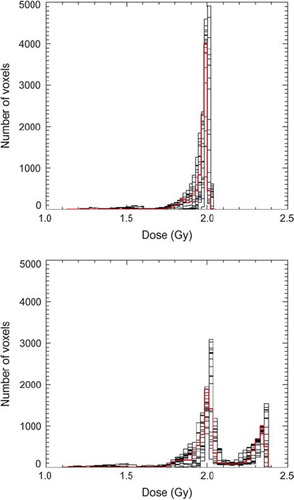
Table I. Dose characteristics and TCP estimates for the five plans considered for patient 1 and patient 2. All values are calculated as if each of the plans was used over 30 fractions. Std – standard plan, AI and AII the two adaptive plans investigated.
TCP calculations
With a homogeneous distribution of clonogenic cells in the tumour and the bladder wall the TCPs varied between 53% and 58% when using each of the 60 Gy plans (). The highest TCPs, 62% and 64% respectively, were obtained for the standard SIB plans for both patients. The lowest TCP, 51%, was obtained for the AII SIB plan for patient 2, which also had the lowest minimum dose to the bladder wall (43.8 Gy). For each fraction, choosing the smallest of the three plans that geometrically covered the repeat CTV to a minimum of 95% resulted in TCPs of 56% and 53% for patients 1 and 2 respectively. Correspondingly, with a geometrical coverage of 99% the TCP obtained was 58% for patient 1, which is equivalent to that obtained using the standard plan on all fractions. In contrast, for patient 2 the estimated TCP was 55%, which is a few percentage points lower than that achieved by use of the standard or AI plans only.
Increasing the relative density of the clonogenic cells between the wall and tumour with the parameter ρrel, resulted in the TCPs shown in . For the 60 Gy standard plans, the TCP is nearly constant, which reflects the dose homogeneity of the plans. As ρrel was increased, the number of clonogenic cells in the 70 Gy volume was increased, while correspondingly fewer remained in the bladder wall which is now irradiated to 60 Gy. Therefore, with a constant number of 108 clonogenic cells the TCP values for both patients and SIB plans reached a plateau at approximately 75%, for ρrel > 1000.
Figure 4. TCP for a varying clonogenic cell density between the bladder wall and tumour for patients 1 (upper) and 2 (lower), obtained by varying ρrel = ρtumour/ρwall for different strategies.
Discussion
In this work an image-based model for estimating the local control following radiotherapy of bladder cancer was developed. The model was applied to evaluate the clinical effect of several volume-based adaptive strategies. Clinically feasible treatment plans covering the CTV on all fractions compared with plans not fully covering the CTV on every fraction revealed differences in local control of approximately 5%. For patient 2, selecting the smallest plan on each fraction that covered the CTV to 99% resulted in a TCP of 55%, which is lower than the TCP obtained using either the standard plan or the AI plan (57%). The AII SIB plan gave a lower TCP than the AII plan for patient 2, due to the low dose minimum for the SIB plan. Therefore differences in TCP could not fully be explained by geometrical coverage, and this study has thus illustrated the usefulness of TCP modelling as a tool in adaptive plan evaluation and selection.”
The potential benefit of SIB was illustrated by varying the difference in clonogenic cell density between the bladder wall and the tumour. The improvement in TCP for the SIB plans is partly due to the 5 mm margin around the tumours. However, as ρrel is increased fewer clonogenic cells in the wall remain. Thus the contribution to the TCP value for the bladder is less from both high and low dose voxels of the bladder wall. This applies also for the AII SIB plan's underdosage of the bladder wall for some fractions, and therefore the TCP estimates for both plans become similar. As the graphs in reach a plateau, it can be concluded that whole bladder irradiation to 70 Gy would also result in a TCP of 75%. The further usefulness of treatment outcome modelling in adaptive radiotherapy is demonstrated by the strategy of combining the three 60 Gy plans, where the estimated differences would have been hard to predict based on only minimum and maximum dose and geometrical coverage.
TCP modelling is sensitive to uncertainties in the radiobiological parameters. Since the local control data in all are within a rather narrow interval, other values might have given a curve fit with almost the same goodness. The estimated α of 0.29 Gy−1 is somewhat lower than 0.35 Gy−1 as Deacon et al. calculated for bladder tumours in 1984 (references in [Citation12]). Mathematically the introduction of σα takes variations in radiosensitivity among a population into account, and therefore the observed difference in the parameter α has little impact on the resulting TCPs. The value of σα = 0.08 is identical to that estimated by Webb and Nahum for bladder cancer [Citation12]. Due to development within both diagnostics and treatment delivery and planning, comparison of clinical studies performed over a long time interval is complicated. Together with differences among the populations studied, these factors may explain why the estimate of α by Deacon et al. is slightly different from ours. Furthermore, in the TCP model used repopulation has been omitted. Repopulation would be expected to have most effect if the overall treatment time is changed. All treatment plans investigated had the same number of fractions, and repopulation would have about the same impact on all TCP estimates. Thus, since all presented TCP estimates are based on the same parameters using the same model, the internal plan ranking still applies.
Based on the two patients used in this study, escalation of the tumour dose seems promising for improving local control. In order to employ such an approach in clinical practice, visualisation of the tumour on daily images is important. For instance, Pos, Chai and Søndergaard with colleagues [Citation15–17] have found lipiodol markers feasible for tumour visualisation on CBCT. In a modelling study where the tumour boost dose was limited by normal tissue complication probabilities (NTCPs) Partridge et al. [Citation18] found a doubling of the estimated TCP for lung tumours. Based on simulations on 50 prostate cancer patients, Sanchez-Nieto found a 7–15% gain in TCP when individualising dose prescriptions based on a various NTCP criteria [Citation19]. The data used by Sanchez-Nieto was based on dose volume histograms gained form a planning CT scan only. Image-based evaluation of treatment outcome has the benefit of not only estimating effects on a single snapshot of the patient's anatomy, but including patient specific anatomical variations. The use of multiple three-dimensional images in combination with dose tracking and treatment outcome modelling, could enable patients otherwise excluded from dose escalation to still receive an improved treatment in terms of the same complication rate but improved local control. For example, a bladder cancer patient showing a large rectum at some fractions could both get reduced NTCP and improved local control.
Ideally a tool for daily adaptive plan evaluation would estimate a projected TCP day by day, based on the treatment already delivered and lead to the feasible alternatives for a given fraction. This could be possible by averaging the doses for the remaining fractions based on the mean doses delivered. If only a few accumulated dose distributions are available, i.e. during the early phase of treatment, it should be assessed whether or not the obtained results were better than those obtained from a single planning scan. Löf et al. developed a theoretical method to calculate the probability for uncomplicated tumour control as function of fraction doses [Citation20]. One shortcoming of the model used by Löf is that it does not separate between normal tissue complications and local control. In addition, for the examples given by comparing alternative treatments it may be possible to distinguish between local control and different normal tissue complication probabilities. The examples given by Löf were simplified to one-dimensional treatment geometries, most likely limited by the computer power available more than ten years ago. The strength of monitoring image-based TCP is treatment outcome estimates based on accumulated voxel doses. Thus, despite possible shortcomings in parameter estimation, TCP modelling combined with daily imaging and geometrical criteria could be a useful tool for plan evaluation and selection in adaptive radiotherapy.
Acknowledgements
Christoffer Lervåg is acknowledged for help with data conversion. This work has been supported by research grants from the Danish Cancer Society, the Danish Postgraduate School for Clinical Oncology, Varian Medical Systems (Palo Alto, California), The Danish Council for Strategic Research and CIRRO, the Lundbeck Foundation Centre for Interventional Research in Radiation Oncology.
Declaration of interest: The authors report no conflicts of interest. The authors alone are responsible for the content and writing of the paper.
References
- Redpath AT, Muren LP. CT-guided intensity-modulated radiotherapy for bladder cancer: Isocentre shifts, margins and their impact on target dose. Radiother Oncol 2006;81: 276–83.
- Burridge N, Amer A, Marchant T, Sykes J, Stratford J, Henry A, . Online adaptive radiotherapy of the bladder: Small bowel irradiated-volume reduction. Int J Radiat Oncol Biol Phys 2006;66:892–7.
- Pos F, Hulshof M, Lebesque J, Lotz H, van Tienhoven G, Moonen L, . Adaptive radiotherapy for invasive bladder cancer: A feasibility study. Int J Radiat Oncol Biol Phys 2006;64:862–8.
- Foroudi F, Wong J, Haworth A, Baille A, McAlpine J Rolfo A, . Offline adaptive radiotherapy for bladder cancer using cone beam computed tomography. J Med Imaging Radiat Oncol 2009;53:226–33.
- Vestergaard A, Søndergaard J, Petersen J, Høyer M, Muren LP. A comparison of three different adaptive strategies in image-guided radiotherapy of bladder cancer. Acta Oncol 2010;49:1069–76.
- Wright P, Redpath AT, Høyer M, Grau C, Muren LP. The normal tissue sparing potential of adaptive strategies in radiotherapy of bladder cancer. Acta Oncol 2008;47:1382–9.
- Wright P, Redpath AT, Høyer M, Muren LP. A method to individualize adaptive planning target volumes for deformable targets. Phys Med Biol 2009;54:7121–33.
- Janssens G, Orban de Xivry J, Fekkes S, Dekker André, Macq B, Lambin P, . Evaluation of nonrigid registration models for interfraction dose accumulation in radiotherapy. Med Phys 2009;36:4268–76.
- Cheung J, Aubry J-F, Yom S, Gottschalk A, Celi JC, Pouliot J. Dose recalculation and the dose-guided radiation therapy (DGRT) process using megavoltage cone-beam CT. Int J Radiat Oncol Biol Phys 2009;74:583–92.
- Yan D, Jaffray DA, Wong JW. A model to accumulate fractionated dose in a deforming organ. Int J Radiat Oncol Biol Phys 1999;44:665–75.
- Røthe Arnesen M, Eilertsen K, Malinen E. Optimal treatment margins for radiotherapy of prostate cancer based on interfraction imaging. Acta Oncol 2008;47:1373–81.
- Webb S, Nahum AE. A model for calculating tumour control probability in radiotherapy including the effects of inhomogeneous distributions of dose and clonogenic cell density. Phys Med Biol 1993;38:653–66.
- Nahum AE, Sanchez-Nieto B. Tumour control probability modelling: Basic principles and applications in treatment planning. Physica Medica 2001;17:13–23 S2.
- Pos F, Hart G, Schneider C, Sminia P. Radical radiotherapy for invasive bladder cancer: What dose and fractionation schedule to choose? Int J Radiat Oncol Biol Phys 2006;64: 1168–73.
- Pos F, Bex A, Dees-Ribbers HM, Betgen A, van Herk M, Remeijer P. Lipiodol injection for target volume delineation and image guidance during radiotherapy for bladder cancer. Radiother Oncol 2009;93:364–7.
- Chai X, van Herk M, van de Kamer JB, Remeijer P, Bex A, Betgen A, . Behaviour of lipiodol markers during image guided radiotherapy of bladder cancer. Int J Radiat Oncol Biol Phys 2010. E-pub 2010.
- Søndergaard J, Ørding Olsen K, Muren LP, Vindelev Elstrøm U, Grau C, Høyer M. A study of image guided radiotherapy of bladder cancer based on Lipiodol injection in the bladder wall. Acta Oncol 2010. E-pub 2010.
- Partridge M, Tree A, Brock J, McNair H, Fernandez E, Panakis N, . Improvement in tumour control probability with active breathing control and dose escalation: A modelling study. Radiother Oncol 2009;91:325–9.
- Sanchez-Nieto B, Nahum A, Dearnaley D. Individualization of dose prescription based on normal-tissue dose-volume and radiosensitivity data. Int J Radiat Oncol Biol Phys 2001; 49:487–99.
- Löf J, Lind B, Brahme A. An adaptive control algorithm for optimization of intensity modulated radiotherapy considering uncertainties in beam profiles, patient set-up and internal organ motion. Phys Med Biol 1998;43:1605–28.