Abstract
Purpose. To investigate the use of FDG-PET/CT before, during and after chemoradiotherapy (CRT) and diffusion-weighted magnetic resonance imaging (DW-MRI) before CRT for the prediction of pathological response (pCR) in rectal cancer patients. Material and methods. Twenty-two rectal cancer patients treated with long course CRT were included. An FDG-PET/CT was performed prior to the start of CRT, after 10 to 12 fractions of CRT and five weeks after the end of CRT. The tumor was delineated using a gradient based delineation method and the maximal standardized uptake values (SUVmax) were calculated. A DW-MRI was performed before start of CRT. Mean apparent diffusion coefficients (ADC) were determined. The ΔSUVmax during and after CRT and the initial ADC values were correlated to the histopathological findings after total mesorectal excision (TME). Results. ΔSUVmax during and after CRT significantly correlated with the pathological response to treatment (during CRT: ΔSUVmax = 59% ± 12% for pCR vs. 25% ± 27% if no pCR, p=0.0036; post-CRT: 90% ± 11 for pCR vs. 63% ± 22 if no pCR p=0.013). ROC curve analysis revealed an optimal threshold for ΔSUVmax of 40% during CRT and 76% after CRT. The initial ADC value was also significantly correlated with pCR (0.94 ± 0.12 × 10⁻³ mm2/s for pCR vs. 1.2 ± 0.24 × 10⁻³ mm2/s, p=0.002) and ROC curve analysis revealed an optimal threshold of 1.06 × 10⁻³ mm2/s. Combining the provided ΔSUVmax thresholds during and after CRT increased specificity of the prediction (sensitivity 100% and specificity 94%). The combination of the thresholds for the initial ADC value and the ΔSUVmax during CRT increased specificity of the prediction to a similar level (sensitivity of 100% and specificity of 94%). Conclusions. The combination of the different time points and the different imaging modalities increased the specificity of the response assessment both during and after CRT.
In rectal cancer, the addition of preoperative radiotherapy with or without concurrent chemotherapy to surgery has decreased locoregional recurrence rates and even increased survival [Citation1–3]. Long course chemoradiotherapy (CRT) followed by a six to eight week interval before surgery can induce significant tumor downsizing and downstaging with 10–30% of the patients showing a pathologic complete response (pCR) after CRT [Citation4–6]. Patients with a pCR on pathological evaluation, have a favorable long-term outcome [Citation4,Citation7,Citation8]. And there is also evidence that in these patients surgery might be omitted [Citation9,Citation10]. So far, the only way to accurately assess the tumor response is by histopathological examination of the resection specimen. If we were able to predict or assess the response to preoperative treatment before surgery, it would allow us to adapt and to individualize treatment. Currently treatment response is monitored mainly by evaluation of tumor size using computed tomography (CT) and magnetic resonance imaging (MRI) [Citation11,Citation12]. Functional and biological imaging modalities may provide us with additional information allowing earlier assessment of the response [Citation13]. Preliminary results using sequential [Citation18]F fluorodeoxyglucose positron emission tomography (FDG-PET) suggest that the decrease in maximal metabolic activity of the tumor in the second week of CRT can adequately assess response in rectal cancer [Citation14–16]. More recently diffusion weighted MRI (DW-MRI) has emerged as a potential tool for response prediction and assessment [Citation17–19]. DW-MRI is able to detect molecular diffusion, i.e. the Brownian motion of water molecules [Citation20]. This way it characterizes tissue and generates image contrast based on differences in water mobility, which can be quantified by the apparent diffusion coefficient (ADC). The ability to detect tumoral microstructure changes allows DW-MRI to be used for early treatment prediction and for the differentiation of viable and necrotic or inflammatory tissue. Preliminary studies in other tumors sites have shown promising results [Citation21–23]. In rectal cancer DW-MRI is increasingly investigated in the presurgical assessment and for early treatment response assessment [Citation17–19,Citation24].
The purpose of this study was on the one hand to validate the use of FDG-PET as an imaging modality for response assessment during and after CRT and on the other hand to study if DW-MRI before CRT can provide us with additional information.
Material and methods
Patient selection
Between May 2005 and August 2009, 22 patients, 17 men (mean age: 60 years; range: 40–80 years) and five women (mean age: 59.2 years; range: 48–76 years) were enrolled in this study. All patients had biopsy-proven resectable adenocarcinoma of the rectum, clinical stage T2/3-N1/2M0 on MRI and/or endorectal ultrasound. All patients were treated with a long course of CRT, consisting of 25–28 fractions of 1.8 Gy, five days per week for five to 5.5 weeks, in combination with a continuous infusion of 5-fluorouracil (225 mg/m2). In two patients weekly oxaliplatin (50 mg/m2) was added because of advanced disease or suspicion of metastatic disease. Radiotherapy was delivered through two lateral beams and one posterior beam. During CT simulation and treatment, patients were positioned in prone position on a belly board. Six to eight weeks after completion of CRT, patients underwent a total or partial mesorectal excision.
FDG-PET/CT
The FDG-PET/CT images were acquired with a Siemens Biograph 2 scanner (Siemens, Erlangen, Germany) (4 patients) or with a Siemens HiRez Biograph scanner (18 patients). The transaxial and axial PET resolution for the HiRez Biograph PET camera were 4.6 mm at 1 cm and 5.8 mm at 10 cm from the center. The Biograph 2 PET camera has a transaxial resolution of 6.3 mm and 7.4 mm and an axial resolution of 5.8 mm and 7.1 mm at 1 cm and 10 cm source distance, respectively. Patients were asked to fast for 6 h before the examination. A dose between 282 MBq (minimum) and 404 MBq (maximum) 18F-FDG was administered i.v. [injected dose = (body weight* 4) + 20]. Each examination consisted of a spiral CT scan followed by a PET acquisition in the caudocranial direction over the same anatomic extent (from L4 to the buttock folds). The emission scan was obtained in 3D mode in two or three bed positions, with a scan time of 4 min per bed position. The PET data were reconstructed using an ordered subset expectation maximization algorithm and attenuation correction derived from CT data [Citation25]. The 18F-FDG-PET signals were automatically processed so that metabolically active regions in the tumor were outlined by use of a gradient-based segmentation method [Citation26]. Additionally, all PET data were normalized for the blood glucose level (BGL) measured shortly before FDG administration [Citation27].
Magnetic resonance imaging
The MRI studies were performed on a 1.5T scanner (Sonata, Siemens, Erlangen, Germany). A T2-weighted Turbo Spin-Echo (TSE) sequence and a T1-weighted fat-suppressed TS sequence were performed in the transverse and coronal plane, oriented along the axis of the rectal tumor. DWI echo planar images (EPI) were acquired in the transverse plane (34 slices, 4 mm slice thickness, no intersection gap, FoV 38 × 38 cm2, matrix of 128 × 128, TR/TE = 4500 ms/83 ms, bandwidth of 1502 Hz/pixel, 4 signal averages). The images were acquired using six different b-values (b=0, 50, 100, 500, 750 and 1 000 sec/mm2). All diffusion-sensitizing gradients were applied in three orthogonal directions and combined to create a 3-scan trace. An apparent diffusion coefficient (ADC) map was calculated automatically by the scanner's software. Finally, a T1-weighted fat-suppressed TSE sequence was repeated with identical geometry to the DWI-sequence (34 slices, 4 mm slice thickness, no intersection gap, FoV of 38 × 31 cm2, matrix of 512 × 384, TR/TE = 991 ms/11 ms, 3 signal averages).
DWI-images analysis
The DW images were analysed on a PACS station (Agfa-Gevaert, Mortsel, Belgium) by a radiologist with six years’ experience in abdominal DWI (VV) and two radiation oncologists (ML, SR) in consensus. Regions of interest (ROI) were placed on the rectal tumors on the images acquired by a b-value of 0 s/mm2, and automatically copied to the other b-value images by the software. For solid tumors, the ROIs were placed over the entire lesion. In the case of obvious solid and necrotic components on the DWI images, ROIs were placed on the solid tumoral components according to their signal heterogeneity on the images acquired by a b-value of 1 000 s/mm2. The signal intensity (SI) was calculated for each b-value including all ROIs per delineated lesion. Subsequently, all ROIs were merged per lesion for each b-value and the average signal intensity (SI) was calculated for the entire lesion. From these averaged SI for b=0, 50, 100, 500, 750 and 1 000 s/mm2, the ADC was calculated using the following formula:
where SIi is the signal intensity measured on the i'th b-value image and bi is the corresponding b-value (bi = 0, 50, 100, 500, 750, 1 000 s/mm2). SI0 is a variable estimating the exact signal intensity for b = 0 s/mm2.
Histopathological analysis and historadiological correlation
Pathological staging served as the gold standard and was based on the TNM staging system [Citation28]. If no tumor cells were found in the resection specimen and only fibrotic mass or acellular mucin pools were present, the response was considered complete and patients was labeled as a pCR.
Statistical analysis
The software package Statistica 9® (StatSoft Inc, Tulsa, OK, USA) was used for the statistical analysis. A p-value < 0.05 was considered statistically significant. The initial ADC value and the ΔSUVmax values during and after CRT were compared with a Mann-Whitney U test between lesions with versus without pCR. Receiver-operating characteristics (ROC) analysis with the area under the curve (AUC) was employed to investigate the discriminatory capability for pCR of the initial ADC value, the ΔSUVmax during and the ΔSUVmax after CRT. For calculation of the sensitivity, specificity, accuracy, PPV and NPV, the optimal threshold was determined by giving equal weighting to sensitivity and specificity on the ROC curve.
Results
Sixty six sequential FDG-PET/CT scans and 22 DW-MRI scans were analyzed. All patients underwent surgery and pathological evaluation was performed in all of them. In six patients (27%) no residual tumoral cells were found after pathological evaluation. These patients were classified as a pCR. Five patients had a metabolic complete response on the presurgical FDG-PET/CT. Only three of these actually had a pCR (sensitivity: 50% and specificity of 88%).
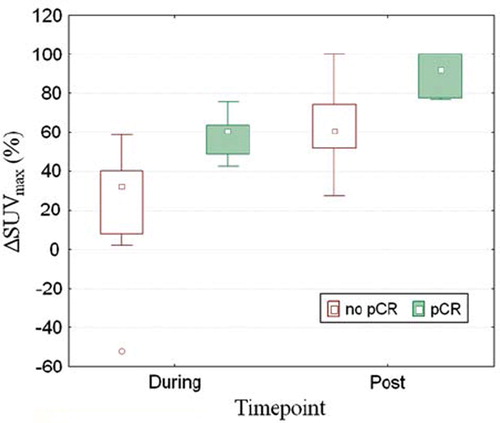
The mean ΔSUVmax during and after CRT was significantly correlated with the presence of residual tumor cells in the resection specimen (). During CRT, patients with a pCR had a mean reduction in SUVmax of 59% ± 12% whereas patient with no pCR only had a mean reduction of SUVmax of 25% ± 27% (p=0.0036). After CRT patients with a pCR had a mean ΔSUVmax of 90% ± 11, while patients with residual tumor tissue had a mean ΔSUVmax of 63% ± 22 (p=0.013). ROC curve analysis revealed that with a threshold value for ΔSUVmax > 40% we can identify all patients who will achieve a pCR after two weeks (sensitivity 100%). However, using this threshold four of 16 non pCR patients were falsely classified as pCR (specificity 75% and a relatively low positive predictive value (PPV) of 60%).
Figure 1. Box plot of ΔSUVmax during and after CRT, correlated with pCR.
Similarly in patients after CRT and before surgery an optimal threshold for ΔSUVmax of 76% can identify all pCR patients (sensitivity 100%). However, it also falsely classified four of 16 non pCR patients as a pCR (specificity 75% and a PPV of 60%).
Normalization of the SUVmax value for the blood glucose level generally increased the accuracy of the prediction with FDG. During CRT the mean ΔSUVmax was more significantly correlated with pCR after normalization than before (p=0.0036 vs. p=0.0057 respectively). This was also the case for ΔSUVmax after CRT (p=0.013 vs. p=0.017). During CRT the specificity of the prediction increased from 69 to 75% after normalization. And finally the threshold value for ΔSUVmax after CRT increased from 73 to 76% with similar accuracies.
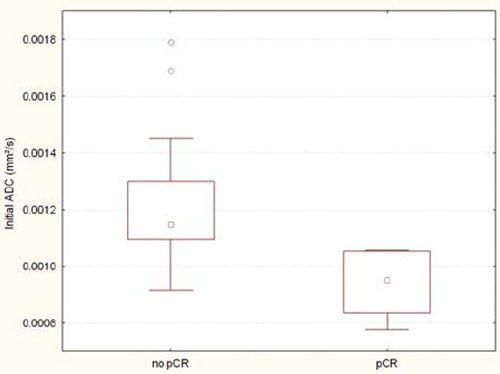
The mean initial ADC value in patients with a pCR after CRT was significantly lower than in the no pCR group (0.94 ± 0.12 × 10⁻³ mm2/s vs. 1.2 ± 0.24 × 10⁻³ mm2/s; p=0.0020) (). ROC curve analysis of the initial ADC value revealed an optimal cut-off point of 1.06 × 10⁻³ mm2/s which allowed us to adequately assess pCR with a sensitivity of 100% and a specificity of 87.5%.
Figure 2. Box plot of initial ADC value correlated with pCR.
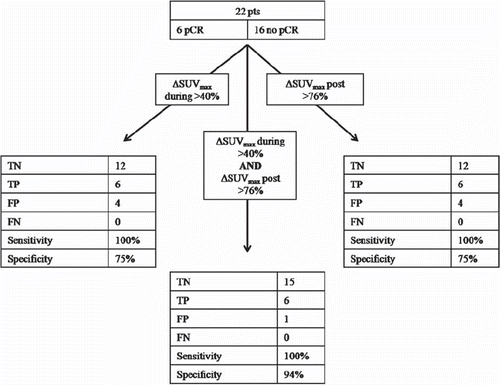
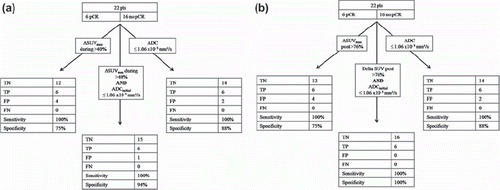
The individual analysis of the FDG-PET provided us with threshold values both during and after CRT (> 40% and > 76% respectively). If we apply both threshold values on our data set we were able to correctly classify 21 of 22 patients (). Only one patient was misclassified as a pCR while remnant tumor cells were found on pathology. This results in a sensitivity of 100% and a increased specificity and PPV of 94% and 86% respectively.
Figure 3. Accuracies of the individual and combined threshold values for ΔSUVmax during and after CRT.
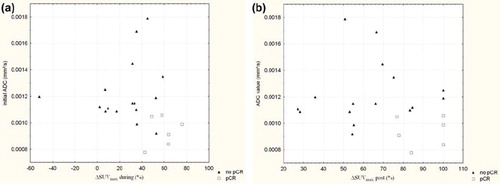
The ΔSUVmax value during and after CRT was plotted out against the initial ADC value for each individual patient ( and respectively). Patients with a ΔSUVmax > 40% during CRT without a pCR at pathology had a significantly higher initial ADC value than patients with a pCR at pathology (ADC = 1.3 ± 0.3 × 10⁻³ mm2/s vs. 0.94 ± 0.11 × 10⁻³ mm2/s, p=0.036). Similarly patients with a ΔSUVmax > 76% after CRT without a pCR had a significantly higher initial ADC value than patients with pCR (1.17 ± 0.069 × 10⁻³ mm2/s vs. 0.94 ± 0.12 × 10⁻³ mm2/s, p=0.014).
Figure 4. The ΔSUVmax during (a) and after (b) CRT set out against initial ADC values. Patient with a pCR after CRT are depicted as a (□). Patients with no pCR after CRT are depicted as (▴).
Both during and after CRT the combination of the thresholds of ΔSUVmax and ADC decreased the number of false positive results and consequently increased specificity and PPV. During CRT the combination of a ΔSUVmax > 40% and an ADC value ≤ 1.06 × 10⁻³ mm2/s allowed us to identify a pCR with a sensitivity of 100% a specificity of 94% and a PPV of 86% (). Also, the combination of the provided threshold for ΔSUVmax after CRT and initial ADC was able to correctly predict the response in all 22 patients ().
Figure 5. Accuracies of the individual and combined threshold values for the initial ADC value and the ΔSUVmax during CRT are depicted in (a). The accuracies of the individual and combined threshold values of the initial ADC value and the ΔSUVmax after CRT are depicted in (b).
Discussion
This prospective study investigated the use of two functional imaging modalities, FDG-PET and DW-MRI for the prediction and early assessment of response to CRT in rectal cancer. These data suggest a potential benefit in combining different time points of FDG-PET analysis and combining different functional imaging modalities. Our data largely confirm earlier reports that FDG-PET/CT measurements can be used for response assessment during and after CRT. Three studies already reported on the use of sequential FDG-PET/CT imaging during and after preoperative CRT for rectal cancer [Citation14–16]. Despite the various differences in study set-up, scan type, pathological evaluation and metabolic evaluation the main message in these three studies is similar. The metabolic response to CRT in rectal cancer with FDG-PET/CT is correlated with the histopathological response and may be useful for early assessment in rectal cancer. These studies provide more or less similar cut-off values, however differences in study set up make a direct comparison of the results impossible. Interestingly, normalization for the blood glucosis level increased the significance of the correlation with pCR both during and after CRT, and even increased specificity with the provided threshold during CRT. This observation is similar to recent findings by Janssen et al. [Citation29]. Although this normalization is a rough correction of the provided PET data, the increased accuracy in both studies suggests the necessity of minimizing the potential errors of the PET analysis and adequate standardization of the scanning protocol to utilize the full predictive power of FDG-PET.
Another essential difference between studies is the histopathological evaluation of the resection specimen. Both by Janssen et al. and Cascini et al. tumor regression grading (TRG) was used to identify responders from non responders [Citation14,Citation15]. In this study we chose to correlate the metabolic response and the ADC value with pCR. A pCR after neoadjuvant CRT in rectal cancer is a well established prognostic factor associated with increased local control and overall survival rates [Citation4,Citation7,Citation30]. Several reports also discuss TRG as a prognostic factor, however the exact correlation of each grade with prognosis is less clear and the exact division of responders and non-responders is highly debated [Citation8,Citation31,Citation32]. Using the database of the large randomized German trial Rodel et al. found that the prognosis of patients with TRG 4 is better than patients with TRG 2-3 and this in turn is better than TRG 0-1 [Citation31]. This implies that the TRG 0-2 vs. TRG 3-4 division as used by Janssen et al. and Cascini et al. might not be the correct way to discriminate responders from non-responders. Furthermore, in this trial TRG 4 patients still do better than TRG 2-3, so treatment intensification will still be warranted in these intermediate responders. In a recent article Bujko et al. investigated 131 patients and found that TRG in patients with residual cancer had no prognostic value for the incidence of nodal disease and for DFS [Citation32]. Finally it should be noted that the interest in early response evaluation in rectal cancer is fueled by the consideration that organ preservation is possible in patients with a pCR after CRT. Considering the higher risk of lymph node involvement in ypT1+ patients organ preservation can only be undertaken safely in patients with a pCR, we believe this should be the main clinical endpoint for early response evaluation [Citation33]. A potential drawback using FDG-PET for response assessment is that it cannot differentiate between tumor and inflammation. Indeed, both Janssen et al. and Rosenberg et al. found that peritumoral inflammation resulted in false negative results [Citation14,Citation16]. This can indirectly be seen in our dataset as well. Although sensitivity is very high with the provided cut-off point, specificity is actually too low for clinical use. If we want to increase our specificity by increasing the cut-off value sensitivity rates rapidly drop suggesting a lot of false negative results with only a minor increase in specificity. That is why we believe other functional imaging modalities can be useful. The ability of DW-MRI to generate image contrast based on differences in water mobility makes it well suited to differentiate viable tumor tissue from inflammation.
In this limited number of patients the initial ADC value shows a very good correlation with pCR. The initial ADC is significantly lower in patients with a pCR compared to patients with no pCR after CRT. The reason for this lies in the tissue cellularity. High ADC values imply a less restrictive environment such as interstitial edema and necrosis. Necrosis is associated with an acidic microenvironment and a low oxygen concentration which influences the response to radiotherapy and chemotherapy [Citation34,Citation35]. There is also evidence that it reflects a more aggressive tumor behavior [Citation36]. Dzik-Jurasz et al. were among the first to find a strong negative correlation between the mean pretreatment tumor water ADC and the percentage shrinkage of the tumor after chemotherapy and chemoradiotherapy in rectal cancer [Citation17]. More recently Sun et al. came to a similar observation in 37 patients with rectal cancer where they saw that pretreatment the mean tumor ADC in the downstaged group was lower than that in the non downstaged group [Citation18].
Despite the small number of patients, we notice a substantial increase of the specificity and PPV when we combine the ΔSUVmax during and after CRT for each patient. This suggests that while one single SUVmax at one time point is prone to variations inherent to FDG-PET, the evolution of the SUVmax values during CRT is quite similar in patients with a pCR after CRT compared to patients without a pCR. The great disadvantage of determining the ΔSUVmax prior to surgery is that this time point does not allow for treatment adaptation. By combining two different imaging modalities, providing us with complementary functional information of tumor we increased the accuracy of the prediction to a similar level, but at an earlier time point. In this study the combination of initial ADC calculations and sequential FDG-PET yielded higher accuracies than the individual investigations. This provided us with an similar accuracy at an earlier timepoint than the combination of FDG-PET. But even more than FDG-PET, DW-MRI needs adequate standardization and validation before large prospective multicenter trials can be undertaken to investigate its real value. Also a greater understanding of the underlying histopathological changes correlated with the ADC values is necessary to truly understand the meaning of the provided ADC values. But in a recent publication Sun et al. demonstrated that sequential ADC calculation during and after CRT also allow for an accurate prediction of tumor downstaging [Citation18]. Also in this study you can debate on the optimal pathological evaluation of response. Especially considering the fact that ADC calculations will detect remnant tumor cells as regions of low ADC value, regardless of the presence of T-downstaging or not. But these results definitely warrant further investigation on the role of DW-MRI at the different time points during treatment of rectal cancer. We are currently only in the phase of exploring the possibilities of DW-MRI in clinical oncology and rectal cancer. And before it can be implemented many questions still require answering.
In general we can state that the integration of functional and molecular imaging modalities into the treatment paradigm, together with the numerous potential molecular markers will provide us with a bulk of information on each individual patient. A good cooperation between clinics and statistics will be necessary to mine these data and provide a predictive model enabling the prediction of the response for each individual patient allowing to optimize and individualize treatment.
Conclusion
FDG-PET/CT is a reliable and adequate tool to predict the response of rectal cancer to preoperative long course CRT. However for routine use in clinical practice accuracy will need to improve. The association of the information at different time points and with other imaging modalities such as DW-MRI, appear to overcome these drawbacks and might provide us with a workable and accurate model on which future studies on treatment adaptation can be based.
Declaration of interest statement: All authors have read and approved the manuscript; we have no conflicts of interest to declare or financial support from industry sources to disclose.
References
- Kapiteijn E, Marijnen CA, Nagtegaal ID, Putter H, Steup WH, Wiggers T, . Preoperative radiotherapy combined with total mesorectal excision for resectable rectal cancer. N Engl J Med 2001;345:638–46.
- Folkesson J, Birgisson H, Pahlman L, Cedermark B, Glimelius B, Gunnarsson U. Swedish Rectal Cancer Trial: Long lasting benefits from radiotherapy on survival and local recurrence rate. J Clin Oncol 2005;23:5644–50.
- Bosset JF, Collette L, Calais G, Mineur L, Maingon P, Radosevic-Jelic L, . Chemotherapy with preoperative radiotherapy in rectal cancer. N Engl J Med 2006;355:1114–23.
- Valentini V, Coco C, Cellini N, Picciocchi A, Fares MC, Rosetto ME, . Ten years of preoperative chemoradiation for extraperitoneal T3 rectal cancer: Acute toxicity, tumor response, and sphincter preservation in three consecutive studies. Int J Radiat Oncol Biol Phys 2001;51:371–83.
- Bosset JF, Calais G, Mineur L, Maingon P, Radosevic-Jelic L, Daban A, . Enhanced tumorocidal effect of chemotherapy with preoperative radiotherapy for rectal cancer: Preliminary results—EORTC 22921. J Clin Oncol 2005; 23:5620–7.
- Capirci C, Rampin L, Erba PA, Galeotti F, Crepaldi G, Banti E, . Sequential FDG-PET/CT reliably predicts response of locally advanced rectal cancer to neo-adjuvant chemo-radiation therapy. Eur J Nucl Med Mol Imaging 2007;34: 1583–93.
- Capirci C, Valentini V, Cionini L, De PA, Rodel C, Glynne-Jones R, . Prognostic value of pathologic complete response after neoadjuvant therapy in locally advanced rectal cancer: Long-term analysis of 566 ypCR patients. Int J Radiat Oncol Biol Phys 2008;72:99–107.
- Vecchio FM, Valentini V, Minsky BD, Padula GD, Venkatraman ES, Balducci M, . The relationship of pathologic tumor regression grade (TRG) and outcomes after preoperative therapy in rectal cancer. Int J Radiat Oncol Biol Phys 2005;62:752–60.
- Habr-Gama A, Perez RO, Nadalin W, Sabbaga J, Ribeiro U, Jr., Silva E Sousa AH Jr., . Operative versus nonoperative treatment for stage 0 distal rectal cancer following chemoradiation therapy: Long-term results. Ann Surg 2004;240: 711–7.
- Bujko K, Richter P, Kolodziejczyk M, Nowacki MP, Kulig J, Popiela T, . Preoperative radiotherapy and local excision of rectal cancer with immediate radical re-operation for poor responders. Radiother Oncol 2009;92:195–201.
- Kim YH, Kim DY, Kim TH, Jung KH, Chang HJ, Jeong SY, . Usefulness of magnetic resonance volumetric evaluation in predicting response to preoperative concurrent chemoradiotherapy in patients with resectable rectal cancer. Int J Radiat Oncol Biol Phys 2005;62:761–8.
- Denecke T, Rau B, Hoffmann KT, Hildebrandt B, Ruf J, Gutberlet M, . Comparison of CT, MRI and FDG-PET in response prediction of patients with locally advanced rectal cancer after multimodal preoperative therapy: Is there a benefit in using functional imaging? Eur Radiol 2005;15: 1658–66.
- Roels S, Slagmolen P, Nuyts J, Lee JA, Loeckx D, Maes F, . Biological image-guided radiotherapy in rectal cancer: Is there a role for FMISO or FLT, next to FDG? Acta Oncol 2008;47:1237–48.
- Janssen MH, Ollers MC, Riedl RG, van den Bogaard J, Buijsen J, van Stiphout RG, . Accurate prediction of pathological rectal tumor response after two weeks of preoperative radiochemotherapy using (18)F-Fluorodeoxyglucose-positron emission tomography-computed tomography imaging. Int J Radiat Oncol Biol Phys 2010;77:392–9.
- Cascini GL, Avallone A, Delrio P, Guida C, Tatangelo F, Marone P, . 18F-FDG PET is an early predictor of pathologic tumor response to preoperative radiochemotherapy in locally advanced rectal cancer. J Nucl Med 2006;47: 1241–8.
- Rosenberg R, Herrmann K, Gertler R, Kunzli B, Essler M, Lordick F, . The predictive value of metabolic response to preoperative radiochemotherapy in locally advanced rectal cancer measured by PET/CT. Int J Colorectal Dis 2009; 24:191–200.
- Dzik-Jurasz A, Domenig C, George M, Wolber J, Padhani A, Brown G, . Diffusion MRI for prediction of response of rectal cancer to chemoradiation. Lancet 2002;360:307–8.
- Sun YS, Zhang XP, Tang L, Ji JF, Gu J, Cai Y, . Locally advanced rectal carcinoma treated with preoperative chemotherapy and radiation therapy: Preliminary analysis of diffusion-weighted MR imaging for early detection of tumor histopathologic downstaging. Radiology 2010;254:170–8.
- Hein PA, Kremser C, Judmaier W, Griebel J, Pfeiffer KP, Kreczy A, . Diffusion-weighted magnetic resonance imaging for monitoring diffusion changes in rectal carcinoma during combined, preoperative chemoradiation: Preliminary results of a prospective study. Eur J Radiol 2003;45:214–22.
- Koh DM, Collins DJ. Diffusion-weighted MRI in the body: Applications and challenges in oncology. AJR Am J Roentgenol 2007;188:1622–35.
- Chenevert TL, Stegman LD, Taylor JM, Robertson PL, Greenberg HS, Rehemtulla A, . Diffusion magnetic resonance imaging: An early surrogate marker of therapeutic efficacy in brain tumors. J Natl Cancer Inst 2000;92:2029–36.
- Vandecaveye V, Dirix P, De Keyzer F, Op de Beek K, Vander Poorten V, Roebben I, . Predictive value of diffusion-weighted magnetic resonance imaging during chemoradiotherapy for head and neck squamous cell carcinoma. Eur Radiol 2010.
- Eccles C, Haider MA, Dawson LA. In reply to letter to the editor by Dr Willems et al. re: Eccles et al. Change in diffusion weighted MRI during liver cancer radiotherapy: Preliminary observations. Acta Oncol 2010;49:256–57.
- Kremser C, Judmaier W, Hein P, Griebel J, Lukas P, de VA. Preliminary results on the influence of chemoradiation on apparent diffusion coefficients of primary rectal carcinoma measured by magnetic resonance imaging. Strahlenther Onkol 2003;179:641–9.
- Comtat C, Kinahan P, Defrise M, Michel C, Townsend DW. Fast reconstruction of 3D PET data with accurate statistical modeling. IEEE Trans Nucl Sci 1998;45:1083–9.
- Geets X, Lee JA, Bol A, Lonneux M, Gregoire V. A gradient-based method for segmenting FDG-PET images: Methodology and validation. Eur J Nucl Med Mol Imaging 2007;34:1427–38.
- Beaulieu S, Kinahan P, Tseng J, Dunnwald LK, Schubert EK, Pham P, . SUV varies with time after injection in (18)F-FDG PET of breast cancer: Characterization and method to adjust for time differences. J Nucl Med 2003;44: 1044–50.
- Sobin LH, Wittekind CH. International Union Against Cancer (UICC): TNM classification of malignant tumours. 6th. New York: Wiley; 2002.
- Janssen MH, Ollers MC, van Stiphout RG, Riedl RG, van den BJ, Buijsen J, . Blood glucose level normalization and accurate timing improves the accuracy of PET-based treatment response predictions in rectal cancer. Radiother Oncol 2010;95:203–8.
- Habr-Gama A, Perez RO, Nadalin W, Nahas SC, Ribeiro U, Jr., Silva E Sousa AH Jr., . Long-term results of preoperative chemoradiation for distal rectal cancer correlation between final stage and survival. J Gastrointest Surg 2005; 9:901–9.
- Rodel C, Martus P, Papadoupolos T, Fuzesi L, Klimpfinger M, Fietkau R, . Prognostic significance of tumor regression after preoperative chemoradiotherapy for rectal cancer. J Clin Oncol 2005;23:8688–96.
- Bujko K, Kolodziejczyk M, Nasierowska-Guttmejer A, Michalski W, Kepka L, Chmielik E, . Tumour regression grading in patients with residual rectal cancer after preoperative chemoradiation. Radiother Oncol 2010.
- Mignanelli ED, Campos-Lobato LF, Stocchi L, Lavery IC, Dietz DW. Downstaging after chemoradiotherapy for locally advanced rectal cancer: Is there more (tumor) than meets the eye? Dis Colon Rectum 2010;53:251–6.
- Majno G, Joris I. Apoptosis, oncosis, and necrosis. An overview of cell death. Am J Pathol 1995;146:3–15.
- Gray LH, Conger AD, Ebert M, Hornsey S, Scott OC. The concentration of oxygen dissolved in tissues at the time of irradiation as a factor in radiotherapy. Br J Radiol 1953;26: 638–48.
- Leek RD, Landers RJ, Harris AL, Lewis CE. Necrosis correlates with high vascular density and focal macrophage infiltration in invasive carcinoma of the breast. Br J Cancer 1999;79:991–5.