Abstract
Background. Non-invasive visualization of tumor biological and molecular processes of importance to diagnosis and treatment response is likely to be critical in individualized cancer therapy. Since conventional static 18F-FDG PET with calculation of the semi-quantitative parameter standardized uptake value (SUV) may be subject to many sources of variability, we here present an approach of quantifying the 18F-FDG uptake by analytic two-tissue compartment modeling, extracting kinetic tumor parameters from dynamic 18F-FDG PET. Further, we evaluate the potential of such parameters in radiotherapy response assessment. Material and methods. Male, athymic mice with prostate carcinoma xenografts were subjected to dynamic PET either untreated (n=8) or 24 h post-irradiation (7.5 Gy single dose, n=8). After 10 h of fasting, intravenous bolus injections of 10–15 MBq 18F-FDG were administered and a 1 h dynamic PET scan was performed. 4D emission data were reconstructed using OSEM-MAP, before remote post-processing. Individual arterial input functions were extracted from the image series. Subsequently, tumor 18F-FDG uptake was fitted voxel-by-voxel to a compartment model, producing kinetic parameter maps. Results. The kinetic model separated the 18F-FDG uptake into free and bound tracer and quantified three parameters; forward tracer diffusion (k1), backward tracer diffusion (k2), and rate of 18F-FDG phosphorylation, i.e. the glucose metabolism (k3). The fitted kinetic model gave a goodness of fit (r2) to the observed data ranging from 0.91 to 0.99, and produced parametrical images of all tumors included in the study. Untreated tumors showed homogeneous intra-group median values of all three parameters (k1, k2 and k3), whereas the parameters significantly increased in the tumors irradiated 24 h prior to 18F-FDG PET. Conclusions. This study demonstrates the feasibility of a two-tissue compartment kinetic analysis of dynamic 18F-FDG PET images. If validated, extracted parametrical maps might contribute to tumor biological characterization and radiotherapy response assessment.
Positron emission tomography (PET) using the glucose analogue fluorine-18 (18F)- fluorodeoxyglucose (FDG) has for many years been utilized in oncology. The application of this non-invasive imaging modality is not confined to tumor detection and staging, but may also be applied for monitoring therapy responses [Citation1,Citation2], and as a corollary of this, the technique can provide prognostic stratification [Citation3,Citation4]. The development of 18F-FDG PET has provided cancer medicine with a valuable non-invasive metabolism-visualization modality.
The application of 18F-FDG in tumor imaging is based on a phenomenon called the Warburg effect or aerobic glycolysis, in which glucose is converted into lactic acid in the presence of oxygen, being a specific metabolic abnormality in cancer cells [Citation5]. After intravenous injection, 18F-FDG is transported into the cytosol by glucose transporters (GLUTs), where it is trapped as FDG phosphate. In malignant tumors, particularly one of the isoforms, GLUT1, is frequently overexpressed, but overexpression of GLUT3 and GLUT12 has also been reported [Citation6]. Intracellularly, 18F-FDG is enzymatically phosphorylated by the enzyme hexokinase (HK), whose mitochondrial form is substantially elevated in rapidly proliferating tumors. As a result of the Warburg effect, glucose-starved tumor cells will have increased blood flow and glucose transport, increased glucose phosphorylation, and decreased rates of dephosphorylation [Citation6,Citation7].
Conventional static 18F-FDG PET employs coincidence detection at a certain time period after 18F-FDG injection and is not time resolved. This technique allows visual identification of regions presenting elevated 18F-FDG uptake, and calculation of the semi-quantitative parameter standardized uptake value (SUV). Although SUV has been shown to correlate to cancer malignancy, SUV is subject to many sources of variability which are not controlled for, or not even taken into account. These include PET system quality control accuracy, image reconstruction algorithm and filtering, body composition, time interval between tracer injection and PET, length of uptake period, plasma glucose level and partial volume effects [Citation8–10]. On the other hand, dynamic 18F-FDG PET employs time resolved coincidence detection, and biologically relevant information from kinetic analysis of the 18F-FDG uptake may subsequently be extracted. Such tracer kinetic characteristics may not be obtained by static acquisition.
Identification of the most malignant and aggressive regions of tumors are of outmost importance in radiotherapy planning and evaluation [Citation11]. Kinetic analysis of dynamic image series may provide parametrical maps depicting tumor properties of relevance for treatment selection and guidance. For instance, concomitant radiosensitization and/or dose escalation strategies appear attractive. Many of these dose escalation strategies are based on SUV, but more biologically relevant target regions may be obtained from kinetic analysis.
New tracers for PET applications are constantly being developed [Citation12,Citation13]. Although these tracers, if validated, are targeting specific processes of high importance, they may at first be expensive and unavailable to most users. In contrast, the full potential of dynamic 18F-FDG has not yet been realized. The feasibility of employing parameters extracted from kinetic modeling of dynamic image series is in our opinion under-investigated. Also, 18F-FDG is often the only tracer being available at many PET centers today. Besides the practical advantages of this tracer, it benefits from the relatively long physical half-life and quite low positron range of 18F, and has a lower cost than the more specific tracers.
The purpose of this work was to establish an analytic tool for extraction of kinetic parameters from dynamic 18F-FDG PET series, and to explore the potential of such parameters in radiotherapy response assessment.
Material and methods
Animals, xenografts and anesthesia
Male, BALB/c nude mice (30–35 g, 6–8 weeks old) were used in this study. The Institutional and National Committee on Research on Animal Care approved the protocol, and the experiment was performed according to Interdisciplinary Principles and Guidelines for the Use of Animals in Research, Marketing and Education (New York Academy of Science, New York, NY).
Xenografts were generated by subcutaneous (s.c.) implantation of (∼2 mm)3 tumor tissue from the human androgen-sensitive CWR22 xenograft into the animals flanks. Procedures for implantation, growth and harvesting of CWR22 xenografts in mice were followed according to previous reports [Citation14,Citation15]. Animals were included into the study when their shortest tumor diameter reached 8 mm.
Animals were anesthetized with s.c. injections of a mixture of 2.4 mg/ml tiletamine and 2.4 mg/ml zolazepam (Zoletil vet, Virbac Laboratories, Carros, France), 3.8 mg/ml xylazine (Narcoxyl vet, Roche, Basel, Switzerland), and 0.1 mg/ml butorphanol (Torbugesic, Fort Dodge Laboratories, Fort Dodge, IA), diluted 1:5 in sterile water. A dose of 50 μl/10 g of body weight was given prior to radiation (to both untreated and irradiated animals) and PET acquisitions.
Radiotherapy
Eight of the 16 tumors received a single radiation dose of 7.5 Gy 24 h prior to PET imaging. The radiation was delivered by a 60Co source (Mobaltron 80, TEM Instruments, Crawley, UK) at a dose rate of 0.8 Gy/min. Groups of four mice were simultaneously irradiated by positioning their tumors in the four corners of a 10 × 10 cm radiation field, whilst keeping the rest of their bodies outside the radiation field. The cobalt source produces a megavolt beam that gives an initial dose buildup with depth, resulting in a maximum radiation dose at 4 mm depth. To achieve a homogeneous dose deposition within the tumor volume, a 5 mm thick polystyrene bolus was placed on top of the tumor.
PET imaging
Dynamic 18F-FDG PET was performed at a small animal PET scanner (microPET Focus 120, Siemens Medical Solutions, Erlangen, Germany). After 10 h of fasting, the anesthetized animals received i.v. bolus injections of 10–15 MBq 18F-labelled FDG (GE Healthcare AS, Oslo, Norway) in heparinized saline, before a 1 h dynamic PET scan was performed. Attenuation and scatter correction was obtained by a 10 min transmission scan with a 68Ge point source. 4D emission data were reconstructed using OSEM-MAP (2 OSEM iterations, 18 MAP iterations, β= 0.5, matrix size=128 × 128 × 95) [Citation16,Citation17], producing images with a voxel size of 0.87 × 0.87 × 0.80 mm3. The reconstructed time frames were 10 s during the initial 5 minutes, whereas the following time frames were 30 s. Further post-processing was executed in Interactive Data Language (IDL) v6.2 (Research Systems Inc., Boulder, CO).
Arterial input functions
Both the xenograft and the heart were imaged simultaneously within the same field-of-view, and thus, the arterial input function (AIF) could be determined individually for each animal. First, a 3D image series representing mean 18F-FDG concentration taken over the initial uptake phase (0–1 minute) was generated from the dynamic PET series. Second, a seed point was manually located centrally in the heart, before region growing was performed within a sphere of 3 mm radius. Third, the grow region was refined by automatically excluding voxels where the time-activity curves (TACs) had characteristics differing from those expected from standard AIFs, defined as when the peak intensity of the TAC was less than four times the plateau level intensity of the TAC. Fourth, the AIF was determined by fitting a biexponential function (AIF=A exp(−Bt) + C exp(−Dt)) to the mean TACs in the refined grow region by the use of Levenberg-Marquardt least squares minimization (MPFIT; http://purl.com/net/mpfit) [Citation18].
Kinetic modeling
Region-of-interests (ROIs) were manually delineated around individual tumors in the reconstructed dynamic PET images. Before kinetic modeling, a semi-quantitative measure was calculated to compare intra-group TACs and particularly differences in TACs between untreated and irradiated animals. Differences in injected dose of 18F-FDG were corrected for by calculating normalized tumor TACs, i.e. the tumor TAC divided by the area under the plasma activity curve (i.e. the AIF).
The TAC in each tumor voxel was subjected to a two-tissue compartment kinetic model to describe the distribution and uptake of 18F-FDG in tissue. The model was adopted from the work by Kamasak et al. [Citation19], who applied this model in direct reconstruction of kinetic parameters from PET sinogram data. This model is similar to that originally proposed by Phelps et al. in 1979 [Citation20]. In the model, CP (pmol/ml) is the concentration of 18F-FDG in plasma, i.e. the AIF, and CT (pmol/ml) is the 18F-FDG concentration in tumor. The concentration of 18F-FDG in tumor can be separated into two tissue compartments; the concentration of unbound or not metabolized 18F-FDG (CF (pmol/ml)), and the concentration of bound or metabolized 18F-FDG (CB (pmol/ml)). The kinetic parameters k1 (min−1), k2 (min−1), k3 (min−1) and k4 (min−1), describe the exchange rates of 18F-FDG between these compartments. Whereas the parameters k1, k2, and k4 are first order rate constants, k3 is an apparent first-order constant describing the glucose metabolism in proportion to the concentration of 18F-FDG, dependent on the number of binding sites not being rate-limited. Using this compartment model, kinetic parameters could be extracted from the TAC of each tumor voxel by applying the following first order differential equations:
The solutions of these equations are:
where ⊗ is the convolution operator and α1 and α2 are real valued constants:
Using IDL, CF(t) + CB(t)=CT(t) was fitted to the TACs using Levenberg-Marquardt least squares minimization. Signal intensity of individual tumor voxels was smoothed over the neighboring 3 × 3 × 3 voxels before fitting. The goodness of fit between the raw data and the fitted function was evaluated by calculations of correlation coefficients (r2) in each tumor voxel. Inter-tumor variability in goodness of fit was compared by calculation of median tumor r2. Inter-tumor and intra-tumor variations in kinetic parameters were assessed by calculations of median values and range for untreated and irradiated tumors.
Statistics
Statistical analysis was performed in SigmaStat v 3.5 (Systat software, Inc., Chicago, IL). Differences between groups were analyzed using two-sided Mann-Whitney U-tests and a significance level of 5%.
Results
Qualitative assessment of PET images
Rapid 18F-FDG uptake was detected in the heart and liver, whereas 18F-FDG accumulation in the tumor was slower. The static images obtained at the last part of dynamic PET acquisitions revealed heterogeneous cumulative 18F-FDG uptake in the tumors. The dynamic PET scan lasted for 60 min, a duration that was found to be too short to assess the degradation of tracer in this xenograft model, and consequently, estimation of the k4 parameter was not possible in this study.
Arterial input functions
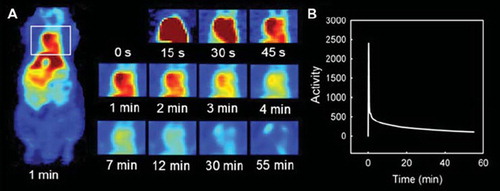
The heart could be identified in the PET images of all animals, allowing determination of individual AIFs. Representative PET images of 18F-FDG uptake in the cardiac ventricle of one animal as function of time after 18F-FDG injection are shown in . In , the corresponding AIF can be seen.
Figure 1. 18F-FDG uptake in one animal's heart at different time points (A). The resulting AIF determined by fitting a biexponential function to the mean TAC of the identified 3D region of the heart (B).
Quantitative kinetic modeling and radiotherapy response assessment
After correcting for differences in injected dose of 18F-FDG, substantially different shapes of the normalized TACs were detected in irradiated tumors compared to untreated tumors (). Significant differences were detected both in the initial phase of the 18F-FDG uptake (t=1 min, p=0.029; t=1 min 15 s, p=0.001; t=1 min 30 s, p=0.014) and at the end of the dynamic scan (t=27.5 min, p=0.029; t=35 min, p=0.009; t=45 min, p=0.009; t=55 min, p=0.009).
Figure 2. Mean and SEM TACs of eight untreated tumors and eight irradiated tumors, corrected for differences in injected dose of 18F-FDG by normalizing the tumor TACs by the area under the AIF. Differences between the two groups were significant in the initial uptake phase (t=1 min, p=0.029; t=1 min 15 s, p=0.001; t=1 min 30 s, p=0.014) and at the end of the dynamic scan (t=27.5 min, p=0.029; t=35 min, p=0.009; t=45 min, p=0.009; t=55 min, p=0.009).
By applying kinetic modeling, 18F-FDG uptake was separated into free (not metabolized) and bound (metabolized) tracer. Model fitting produced parametrical images of all tumors and allowed quantification of the three kinetic parameters k1, k2 and k3 in all tumor voxels. In , two tumor ROIs with high and low 18F-FDG uptake, respectively, are delineated. These visual differences corresponded to different TACs, unveiling also different free and bound components, as seen in and . The kinetic parameters of the low uptake regions was k1=0.098 min−1, k2=0.425 min−1, and k3=0.048 min−1, whereas in the high uptake region the parameters were k1=0.189 min−1, k2=0.616 min1, and k3=0.072 min−1. The goodness of fit (r2) between raw data and fitted function ranged from 0.91 to 0.99 (median=0.97). Parametrical maps of k1, k2, k3 and r2 of six slices through an irradiated CWR22 xenograft are shown in , together with median, minimum and maximum tumor values of each parameter.
Figure 3. Tumor regions with high and low uptake of 18F-FDG (A). Different TAC was detected in the high uptake region (B) and the low uptake region (C), including different free and bound components. The kinetic parameters of the high uptake region were k1=0.189 min−1, k2=0.616 min−1, and k3=0.072 min−1, whereas in the low uptake region the parameters were k1=0.098 min−1, k2=0.425 min−1, and k3=0.048 min−1.
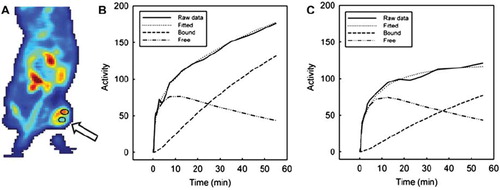
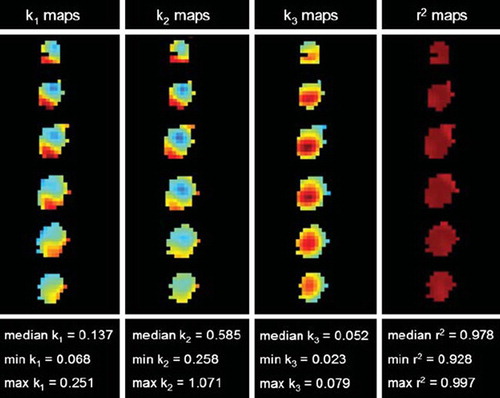
Figure 4. Parametrical maps of k1, k2,k3 and r2 extracted from the kinetic analysis of dynamic 18F-FDG PET. Six slices of an irradiated CWR22 xenograft are shown, together with the tumor's corresponding median and range values for each parameter (in units of min−1 for k1, k2 and k3).
Untreated tumors demonstrated homogeneous intra-group median values of all three kinetic parameters (k1, k2 and k3). In contrast, the tumors exposed to a 7.5 Gy radiation dose 24 h prior to 18F-FDG PET showed heterogeneous intra-group parameter variations (). Compared to the untreated tumors, the median values of all kinetic parameters were significantly increased in the irradiated tumors (k1, p=0.028; k2, p=0.010; k3, p=0.028). There were no significant differences in r2 between untreated and irradiated tumors (p=0.515).
Figure 5. Homogeneous intra-group median values of the k1 (min−1) (A), k2 (min−1) (B) and k3 (min−1) (C) parameters in the untreated xenografts (black), whereas k1 (p=0.028), k2 (p=0.010) and k3 (p=0.028) values changed significantly after irradiation (white).
Discussion
In this study we have implemented and evaluated the feasibility of a kinetic two-tissue compartment model for analysis of dynamic 18F-FDG PET images. Perturbations in the tumor microenvironment were elicited by irradiating CWR22 xenografts, and subsequently reflected by elevated TACs and significantly increased k1, k2 and k3 values, as compared to the untreated xenografts.
Before kinetic modeling, we performed a semi-quantitative calculation of tumor 18F-FDG uptake, which may be comparable to the conventional SUV. The tumor TACs were normalized to the area under the plasma activity curve, thereby removing variability occurring due to differences in injected doses of 18F-FDG. The normalized TACs for the two groups evidenced a large difference in 18F-FDG uptake between untreated and irradiated tumors, with the irradiated tumors presenting an increased rate of dynamic 18F-FDG uptake, thus, this semi-quantitative measure deduced useful information on the tumor's treatment response. The stronger p-values found between the untreated and irradiated tumors for this semi-quantitative measure, as compared to the kinetic parameters, indicate that this measure is a good and maybe better measure of treatment response. However, we believe that kinetic parameters, separately and in combination, may provide valuable biological information that may help explaining the differences in normalized tumor TACs, by taking underlying pharmacokinetic mechanisms into account.
A prerequisite for performing high-quality compartmental modeling of radiotracer uptake in PET is accurate determination of the arterial input function (AIF). Previous studies on kinetic modeling has often involved ex vivo estimation of a mean AIF from repeated arterial blood sampling. In addition to radiation exposure to the staff, this procedure is technically challenging in small animals, also being limited by the small volume of blood that can be withdrawn without affecting these small animals’ physiological function. In our study, 18F-FDG uptake in tumor and heart was imaged simultaneously, allowing three-dimensional individual AIFs to be derived. However, a shortcoming in our study is that our AIFs have not been compared to results from arterial blood sampling. Thus, further investigations to verify the validity of the AIFs are needed.
Using the individually acquired AIFs, the TACs from both untreated and irradiated tumors were well fitted to the kinetic model, as demonstrated by goodness of fit values above 0.91 in all tumors. 18F-FDG uptake is increased in hyperglycolyzed regions, but the exact mechanisms are complicated and influenced by several microenvironmental parameters, such as the GLUT activity, intracellular 18F-FDG phosphorylation capability, but also by tumor oxygenation status, blood flow and permeability [Citation6,Citation7,Citation21]. Changes in any of these factors will consequently affect the uptake pattern of 18F-FDG, and thus, also the parameters extracted from kinetic analysis. The forward (k1) and backward (k2) diffusion of 18F-FDG are known to be perfusion-dependent constants, and k1 has previously been shown to significantly correlate with blood flow in a dynamic PET study evaluating chemotherapy in breast cancer [Citation22]. After irradiation, blood vessels become more permeable, allowing injected substances to more easily diffuse into the extravascular space [Citation23]. Since blood flow in general, and permeability in particular, increases 18F-FDG uptake, the elevated k1 and k2 in our irradiated tumors ( and ) could have been caused by increased permeability.
The k3 parameter, reflecting the rate of 18F-FDG phosphorylation, was also significantly increased in the irradiated tumors as compared to the untreated. Two tumors with substantially higher k3 values than the other tumors in the irradiation group might have contributed strongly to this result. Thus, further investigations are needed in order to conclude. Increased expression of GLUTs and glycolytic enzymes, for example HKs, increases the 18F-FDG phosphorylation, which will affect the k3 parameter. Studies have shown that metabolic alterations are strongly correlated to hypoxia. Since tumor hyperglycosis, reflected by expression of GLUTs and HKs, is driven by activation of the master regulator of oxygen homeostasis under hypoxic conditions, the hypoxia-inducible factor (HIF-1), the 18F-FDG uptake in tumors might indirectly reflect hypoxia [Citation24]. Co-expression of HIF-1α with GLUTs and HKs has been reported [Citation25], supporting the hypothesis that regions with increased hypoxia may have elevated k3 values. Zhao et al. have in an experimental study found that regional expression levels of GLUT1, GLUT3 and HK enzymes were elevated in HIF-1α expressing tumor regions, which was suggested to be the cause of intense 18F-FDG uptake in the same regions [Citation5]. Positive correlation between 18F-FDG uptake and hypoxia as detected by pimonidazole staining has also previously been found [Citation21,Citation26,Citation27]. Known irradiation-induced changes in tumor biology 24 h post-irradiation include acute hypoxia, which might be one of the factors explaining the high k3 parameter values in irradiated tumors. Other studies fail to demonstrate such a correlation between 18F-FDG uptake and hypoxia. However, we believe that application of kinetic modeling and extraction of the k3 parameter may be a more reliable biomarker of tumor hypoxia than SUV and 18F-FDG uptake in general, but this hypothesis necessitates further investigations.
Hypoxia is a common feature of biologically aggressive tumors that more likely metastasize and represent worse prognosis. If these aggressive tumor regions could be reliably identified it may have consequences for treatment planning and evaluation [Citation28–30]. In particular, intensity modulated radiotherapy (IMRT) and selective boosting of regions showing e.g. high k3 values may prove valuable. Currently, advances in radiotherapy delivery technology allow realization of image adapted three-dimensional dose distributions based on PET images and kinetic parameter maps [Citation11]. However, so far no large studies have investigated the potential use of such kinetic parameter maps in radiotherapy design, monitoring and/or prediction, representing an under-investigated application that warrants further evaluation.
In conclusion, this study has investigated the performance of a kinetic two-tissue compartment model in analysis of dynamic 18F-FDG PET images in a preclinical model. The extracted parametrical maps and the interpretation of these require a rigorous validation involving correlation to histopathology. Upon validation, this analytic tool may non-invasively depict beneficiary information about tumor microenvironmental status and changes following therapy, and thereby facilitate treatment adaptation.
Acknowledgements
The authors thank Professor F. Saatcioglu at Department of Molecular Biosciences, University of Oslo, for providing the CWR22 xenograft model. Financial support received from the South-Eastern Norway Regional Health Authority (grant 2009070 to K. Røe and grant 2010079 to L. B. Nilsen) and the Norwegian Cancer Society (grant 80114001 to T. Seierstad).
Declaration of interest: The authors report no conflicts of interest. The authors alone are responsible for the content and writing of the paper.
References
- Greco C, Ling C. Broadening the scope of image-guided radiotherapy (IGRT). Acta Oncol 2008;47:1193–200.
- Bjurberg M, Gustavsson A, Ohlsson T, Brun T. FDG-PET in the detection of residual disease and relapse in patients with Hodgkin's lymphoma. Experience from at Swedish centre. Acta Oncol 2006;45:743–9.
- Bomanji JB, Costa DC, Ell PJ. Clinical role of positron emission tomography in oncology. Lancet Oncol 2001;2:157–64.
- Fletcher JW, Djulbegovic B, Soares HP, Siegel BA, Lowe VJ, Lyman GH, . Recommendations on the use of 18F-FDG PET in oncology. J Nucl Med 2008;49:480–508.
- Warburg O. On the origin of cancer cells. Science 1956;123:309–14.
- Plathow C, Weber WA. Tumor cell metabolism imaging. J Nucl Med 2008;49(Suppl 2):S43–S63.
- Zhao S, Kuge Y, Mochizuki T, Takahashi T, Nakada K, Sato M, . Biologic correlates of intratumoral heterogeneity in 18F-FDG distribution with regional expression of glucose transporters and hexokinase-II in experimental tumor. J Nucl Med 2005;46:675–82.
- Krak NC, Boellaard R, Hoekstra OS, Twisk JW, Hoekstra CJ, Lammertsma AA. Effects of ROI definition and reconstruction method on quantitative outcome and applicability in a response monitoring trial. Eur J Nucl Med Mol Imaging 2005;32:294–301.
- Boellaard R, Krak NC, Hoekstra OS, Lammertsma AA. Effects of noise, image resolution, and ROI definition on the accuracy of standard uptake values: A simulation study. J Nucl Med 2004;45:1519–27.
- Keyes JW Jr. SUV: Standard uptake or silly useless value? J Nucl Med 1995;36:1836–9.
- Sovik A, Malinen E, Olsen DR. Strategies for biologic image-guided dose escalation: A review. Int J Radiat Oncol Biol Phys 2009;73:650–8.
- Kumar R, Dhanpathi H, Basu S, Rubello D, Fanti S, Alavi A. Oncologic PET tracers beyond [(18)F]FDG and the novel quantitative approaches in PET imaging. Q J Nucl Med Mol Imaging 2008;52:50–65.
- Pantaleo MA, Nannini M, Maleddu A, Fanti S, Ambrosini V, Nanni C, . Conventional and novel PET tracers for imaging in oncology in the era of molecular therapy. Cancer Treat Rev 2008;34:103–21.
- Wainstein MA, He F, Robinson D, Kung HJ, Schwartz S, Giaconia JM, . CWR22: Androgen-dependent xenograft model derived from a primary human prostatic carcinoma. Cancer Res 1994;54:6049–52.
- Nagabhushan M, Miller CM, Pretlow TP, Giaconia JM, Edgehouse NL, Schwartz S, . CWR22: The first human prostate cancer xenograft with strongly androgen-dependent and relapsed strains both in vivo and in soft agar. Cancer Res 1996;56:3042–6.
- Qi J, Leahy RM. Resolution and noise properties of MAP reconstruction for fully 3-D PET. IEEE Trans Med Imaging 2000;19:493–506.
- Qi J, Leahy RM, Cherry SR, Chatziioannou A, Farquhar TH. High-resolution 3D Bayesian image reconstruction using the microPET small-animal scanner. Phys Med Biol 1998; 43:1001–13.
- Markwardt CB. Non-linear least squares fitting in IDL with MPFIT. “Astronomical” data analysis software and systems XVIII”, editorsBohlender D, Dowler P, Durand D. ASP Conference Series 2008; 411. Quebec, Canada. 251–4.
- Kamasak ME, Bouman CA, Morris ED, Sauer K. Direct reconstruction of kinetic parameter images from dynamic PET data. IEEE Trans Med Imaging 2005;24:636–50.
- Phelps ME, Huang SC, Hoffman EJ, Selin C, Sokoloff L, Kuhl DE. Tomographic measurement of local cerebral glucose metabolic rate in humans with (F-18)2-fluoro-2-deoxy-D-glucose: Validation of method. Ann Neurol 1979;6:371–88.
- Pugachev A, Ruan S, Carlin S, Larson SM, Campa J, Ling CC, . Dependence of FDG uptake on tumor microenvironment. Int J Radiat Oncol Biol Phys 2005;62: 545–53.
- Tseng J, Dunnwald LK, Schubert EK, Link JM, Minoshima S, Muzi M, . 18F-FDG kinetics in locally advanced breast cancer: Correlation with tumor blood flow and changes in response to neoadjuvant chemotherapy. J Nucl Med 2004;45:1829–37.
- Baker DG, Krochak RJ. The response of the microvascular system to radiation: A review. Cancer Invest 1989;7:287–94.
- Dierckx RA, Van De Wiele C. FDG uptake, a surrogate of tumour hypoxia? Eur J Nucl Med Mol Imaging 2008;35: 1544–9.
- Dang CV, Semenza GL. Oncogenic alterations of metabolism. Trends Biochem Sci 1999;24:68–72.
- Clavo AC, Brown RS, Wahl RL. Fluorodeoxyglucose uptake in human cancer cell lines is increased by hypoxia. J Nucl Med 1995;36:1625–32.
- Burgman P, Odonoghue JA, Humm JL, Ling CC. Hypoxia-induced increase in FDG uptake in MCF7 cells. J Nucl Med 2001;42:170–5.
- Kim Y, Tomé WA. Dose-painting IMRT optimization using biological parameters. Acta Oncol 2010 (in press).
- Røe K, Muren LP, Rørvik J, Olsen DR, Dahl O, Bakke A, . Dynamic contrast enhanced magnetic resonance imaging of bladder cancer and implications for biological image-adapted radiotherapy. Acta Oncol 2008;47:1257–64.
- Toma-Dasu I, Dasu A, Brahme A. Dose prescription and optimisation based on tumour hypoxia. Acta Oncol 2009; 48:1181–92.