Abstract
Introduction. High resolution beam delivery may be required for optimal biology-guided adaptive therapy. In this work, we have studied the influence of multi leaf collimator (MLC) leaf widths on the treatment outcome following adapted IMRT of a hypoxic tumour. Material and methods. Dynamic contrast enhanced MR images of a dog with a spontaneous tumour in the nasal region were used to create a tentative hypoxia map following a previously published procedure. The hypoxia map was used as a basis for generating compartmental gross tumour volumes, which were utilised as planning structures in biologically adapted IMRT. Three different MLCs were employed in inverse treatment planning, with leaf widths of 2.5 mm, 5 mm and 10 mm. The number of treatment beams and the degree of step-and-shoot beam modulation were varied. By optimising the tumour control probability (TCP) function, optimal compartmental doses were derived and used as target doses in the inverse planning. Resulting IMRT dose distributions and dose volume histograms (DVHs) were exported and analysed, giving estimates of TCP and compartmental equivalent uniform doses (EUDs). The impact of patient setup accuracy was simulated. Results. The MLC with the smallest leaf width (2.5 mm) consistently gave the highest TCPs and compartmental EUDs, assuming no setup error. The difference between this MLC and the 5 mm MLC was rather small, while the MLC with 10 mm leaf width gave considerably lower TCPs. When including random and systematic setup errors, errors larger than 5 mm gave only small differences between the MLC types. For setup errors larger than 7 mm no differences were found between non-uniform and uniform dose distributions. Conclusions. Biologically adapted radiotherapy may require MLCs with leaf widths smaller than 10 mm. However, for a high probability of cure it is crucial that accurate patient setup is ensured.
Biological parameters like hypoxia, proliferation, clonogen density and angiogenesis are known to influence the response of tumours to radiotherapy [Citation1]. Developments in imaging technology may provide assessment of the spatial distribution of these parameters [Citation2]. Thus, biologically adaptive radiotherapy employing non-uniform tumour dose distributions may be advantageous when the dose distribution reflects the radioresistance throughout the target volume [Citation3,Citation4]. The spatial variation of the biological parameters may be on a sub centimetre scale though [Citation5,Citation6], and the need for high resolution dose delivery may be crucial for optimal tumour control [Citation7].
Multi leaf collimators (MLCs) with leaf widths between 1.6 mm and 10 mm for conventional linear accelerators are now commercially available. The potential advantages of reduced leaf width have been elucidated in numerous works. In one data modelling study it was found that for single treatments, degradation of the physical dose distribution could be expected if the leaf width exceeded 1.5–1.8 mm [Citation8]. Another modelling study found improvements in target volume coverage and dose to region at risk for leaf widths down to 2 mm [Citation9]. Studies of different patient cases showed that smaller leaf widths may for some patients give improved target volume coverage and reduced doses to organs at risk, for other cases only small differences in tumour control probability (TCP) and normal tissue complication probability (NTCP) were seen [Citation10–12].
However, these findings are for conventional IMRT with intended uniform tumour dose distributions. To our knowledge, no studies have investigated the influence of MLC leaf width on biologically adapted IMRT plans employing non-uniform tumour dose distributions.
The present work aimed at exploring the effect of varying MLC leaf widths on a heterogeneous tumour model. Three different MLCs were used for IMRT planning of a canine patient presenting a highly heterogeneous hypoxia map. Different IMRT plans were generated covering relevant, clinical plan settings, and the resulting dose plans were evaluated on the basis of dosimetric properties and radiobiological effect estimates.
Material and methods
Imaging and planning
The section below has been described in detail elsewhere [Citation13]. Briefly, a female canine patient with a spontaneous osteosarcoma in the nasal region was used as a model for this dose planning study. The gross tumour volume was outlined in contrast enhanced MR images, and segmented into four compartments based on the tissue contrast concentration. The contrast enhancement served as a tentative marker for the partial oxygen pressure (pO2) in the tissue, and the tumour compartments were thus related to varying degrees of hypoxia [Citation13]. Compartment 1, 2, 3 and 4 have mean oxygen concentrations of about 30 mm Hg, 13 mm Hg, 2.3 mm Hg and 0.2 mm Hg, respectively. The compartments may thus be described as normoxic, moderately hypoxic, hypoxic and extremely hypoxic [Citation13]. The compartmental information was transferred to pre-contrast MR images of the dog's head and the resulting images (voxel size 0.35 × 0.35 × 5 mm) were converted to the CT DICOM standard.
In the current project IMRT planning was done using the VSIM virtual simulator (v 2.2) and KonRad inverse planning module (v 2.2.18) under the Coherence platform (Siemens Medical Solutions, Germany). The images containing the compartmental tumour information were imported to the virtual simulator, and the four compartments were defined by a manual contouring procedure in the VSIM module. The tumour was located close to the left orbital cavity and only the right eye was therefore defined as an organ at risk.
Three different types of MLCs were available for the dose planning. These were a Siemens ModuLeaf collimator with 2.5 mm leaf width at isocentre, a Siemens 160 MLC with 5 mm leaf width, and a Siemens 82 leaf collimator with 10 mm leaf width. Four different field arrangements were set up for each MLC, corresponding to three, five, seven and nine coplanar, equally spaced fields, with the isocentre located at the volume centre of the tumour. Each field arrangement was optimised with three, five, seven and ten step-and-shoot intensity levels, resulting in a total of 48 dose plans. Particular attention was given to seven fields and seven intensity levels, as this is the setting of choice at our clinic, usually providing satisfactory IMRT dose distributions with a practicable number of segments. A margin of 5 mm encompassing the entire tumour volume was always used, where the target dose to the margin was set equal to the prescribed dose in Compartment 1 (, margin contour line not shown). Six MV photons were used, and the mean tumour dose was 54 Gy over 18 fractions (3 Gy/fraction).
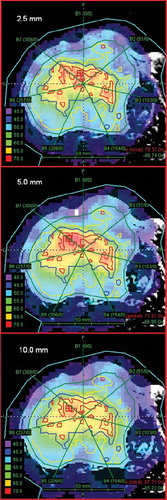
Figure 1. Coronal CT images through the central part of the tumour, with dose distribution as overlay for the seven fields and seven step-and-shoot intensity levels dose plan. Top image: 2.5 mm MLC. Middle image: 5 mm MLC. Bottom image: 10 mm MLC. Contour colours, with prescribed dose in brackets: Compartment 1: green (48.1 Gy), Compartment 2: yellow (53.8 Gy), Compartment 3: blue (63.4 Gy), Compartment 4: red (70.3 Gy).
Tumour dose redistribution and radiobiological modelling
In order to optimise the tumour control under a fixed integral dose, the dose to the tumour was redistributed according to [Citation13–16]
where dmean is the mean tumour dose (in this case 3 Gy), νi the fractional volume of compartment i and di the corresponding prescribed dose. The model used for estimating the TCP and the underlying radiobiological parameters has been described in detail elsewhere [Citation13]. TCP is a function of a number of variables and parameters:
where n is the number of fractions, {fi(d)}4i=1 is the set of compartmental dose distributions (obtained from the IMRT planning), N0 is the number of tumour clonogens at start of treatment, α and β the linear and quadratic component of cell survival, σα the inter patient standard deviation in α, and {OERi}4i=1 the set of compartmental oxygen enhancement ratios.
Compartmental TCPs, that is the probability of controlling a given compartment, could also be estimated using the modelling above. Furthermore, the equivalent uniform dose (EUD) to each compartment was calculated [Citation17]:
Plan evaluation
The set of compartmental doses {di}4i=1 (Equation 1) giving an optimum TCP for this patient () was found using a method based on Lagrange multipliers [Citation16]. The compartmental doses were 48.1 Gy, 53.8 Gy, 63.4 Gy and 70.3 Gy for compartments 1–4, respectively, and these doses were entered as target doses to the treatment planning module. Dose volume histograms (DVHs) for the 48 IMRT plans were analysed using custom made software in Interactive Data Language (IDL) (v 6.2, ITT Visual Information Solutions, Boulder, USA), giving estimates of compartmental EUDs and TCPs, and of the total TCP.
Table I. Dosimetric and radiobiological parameters for three different MLC types1.
For the seven fields and seven step-and-shoot intensity levels plan, random setup errors were generated in the coronal (CT) plane for each of the 18 fractions. The IMRT dose matrix was shifted relative to the CT images according to normally-distributed (Gaussian) random numbers, generated by IDL. A mean total TCP value was calculated for 50 iterations, which gave convergent values. Systematic setup errors were also introduced, as shifts in the positive and negative directions along the lateral and vertical axes in the coronal plane. Mean TCP values were calculated for the four shift directions. Setup errors in the AP direction were not implemented due to the coarse image resolution of 5 mm in this direction.
Results
Dose distributions for the coronal isocentre plane are shown in for the three MLC types. Seven treatment fields and seven step-and-shoot intensity levels were used in this example. Based on visual inspection, the dose distribution for the most hypoxic compartment (Compartment 4, red contour lines) was shown to be more conformal for the 2.5 and 5 mm MLCs than for the 10 mm MLC. There seemed to be only small differences between the MLCs in dose coverage for Compartment 1, 2 and 3. Neither of the MLCs was able to dose paint the small, single Compartment 4-region at the most posterior (upper) part of the tumour with adequate dose.
Differential DVHs are presented in for the three MLCs, and mean doses and standard deviations are presented in . Again, seven treatment fields and seven step-and-shoot intensity levels were employed. For Compartment 4, the 10 mm MLC histogram was clearly shifted towards lower doses compared to the 2.5 mm MLC, and the mean dose was reduced by 3.9 Gy (5.9%). For Compartment 3 there was a minor shift towards lower doses for the 10 mm MLC, while the dose was shifted slightly towards higher doses for Compartment 1 and 2. For the 5 mm MLC there was likewise a shift towards lower doses in Compartment 4 compared to the 2.5 mm MLC, with a reduction in mean dose of 1.2 Gy (1.8%). For Compartment 1, 2 and 3 there were only minor differences in mean doses between the 2.5 mm and the 5 mm MLCs. The variation in dose (SD) within each compartment was consistently higher for the 5 mm and 10 mm MLCs compared to the 2.5 mm MLC.
Figure 2. Differential DVHs from the seven fields and seven step-and-shoot intensity levels dose plan. Each panel represents one compartment, and shows data for the 2.5 mm MLC (solid lines), 5 mm MLC (dashed lines) and 10 mm MLC (dotted lines).
Compartmental EUDs are also presented (). The EUD for each compartment was in most cases reduced with increased leaf width. This was in contrast to the compartmental mean dose, which in Compartment 1 was highest for the 10 mm MLC. TCP values, both for each tumour compartment and for the tumour as a whole, are presented in detail in . The three MLC types gave almost equal TCP for Compartment 1 and 2, but there were increasing differences in TCP for Compartment 3 and 4. For Compartment 4, the 2.5 mm MLC gave 4 percentage points higher TCP compared to the 5 mm MLC, and 15 percentage points higher TCP compared to the 10 mm MLC. The compartmental differences were reflected in the TCP for the tumour as a whole, where the 2.5 mm MLC gave 5 percentage points higher TCP than the 5 mm MLC, and 15 percentage points higher TCP than the 10 mm MLC.
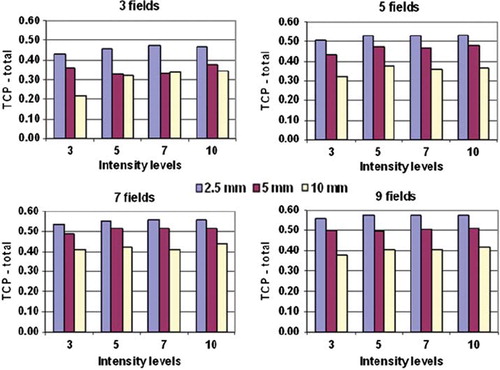
TCP values for the three different MLCs are presented in , resulting from varying the number of treatment fields and the number of step-and-shoot intensity levels. There was in most cases an increase in TCP for all MLCs when increasing the number of fields and intensity levels. In general, the 2.5 mm MLC gave the highest TCP values, and the 10 mm MLC gave the lowest. The highest TCP values were obtained for the 2.5 mm MLC using the 9-field technique, but the differences from the 7-field technique were small. In contrast, for the 5 mm and 10 mm MLCs the 7-field setup gave marginally higher TCP values than the 9-field setup.
Figure 3. TCP values for the whole tumour for the three MLC types. Each panel shows one field setup with four different step-and-shoot intensity levels.
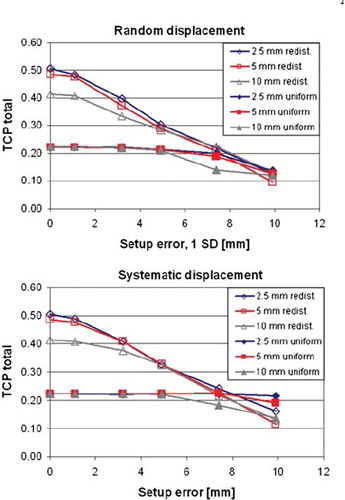
The TCP values referred above were based on ideal treatment conditions, i.e. no setup errors of the patient at treatment. Simulated setup errors in the coronal plane are shown in for the seven fields and seven intensity levels treatment plan. Data are shown both for the case of redistributed, non-uniform tumour dose, as presented so far, and also for the case of intended uniform dose distribution. Increasing the systematic and random setup errors consequently reduced the TCP for the redistributed case. When the random and the systematic error exceeded 5 mm there was no longer any difference in TCP between the MLC types. For the case of uniform dose distribution there were no variations in TCP for setup errors smaller than 5 mm. Further, for errors above 7–8 mm there were small differences in TCP between the redistributed and uniform treatment plan.
Figure 4. TCP calculations resulting from shifting the tumour relative to the dose matrix in the coronal plane. Data shown are for the seven fields and seven step-and-shoot intensity levels dose plan, with redistributed and uniform dose distributions. The abscissa for the random displacement panel (top) represents one standard deviation.
Discussion
In the current work, the quality dependence of hypoxia dose painting plans on MLC leaf width was investigated. The hypoxia distribution in the tumour model employed was very heterogeneous, and the MLC of 10 mm leaf width gave dose distributions clearly inferior to MLCs of 2.5 mm and 5 mm leaf width. For such irregular hypoxia patterns it therefore appears that dose painting should be performed with a small “brush”, rather than with a large one.
shows a plane through the tumour for seven fields and seven step-and-shoot intensity levels. Highly heterogeneous compartments are demonstrated, partly split up into minor subvolumes. The 2.5 mm and the 5 mm MLCs performed better than the 10 mm MLC, especially in distributing higher doses to peripheral subvolumes of Compartment 3 and 4. This was further supported by the mean dose, standard deviation, EUD and TCP data (), where all parameters for Compartment 3 and 4 indicated a benefit of using 2.5 mm or 5 mm leaf widths over 10 mm. Doses to compartments 1 and 2 were also quite heterogeneous ( and ), but the mean doses did meet the prescriptions, however.
Comparing and , a small difference in maximum TCP was found for the given IMRT settings and 0 mm setup error. The data in were generated by dose-volume histograms, while the data in were calculated based on the high-resolution dose matrix generated by the dose planning system. This was expected to give small differences in the evaluated dose distributions, and has no consequences for the current conclusions.
As stated by others [Citation18], even an 5% increase in TCP could be appraised clinically important, and the 15% increase in tumour control observed in the current study may therefore be regarded as a considerable gain. The validity of this calculated raise in tumour control could potentially be tested by a limited number of 50 patients in a randomised clinical trial [Citation19]. However, all patients included in such a trial must in this case present highly hypoxic tumours, as the gain in TCP is reduced with decreasing degree of hypoxia. Furthermore, we have assumed that the tumour hypoxia was constant throughout the treatment, which was an oversimplification [Citation14]. Also, the methods for assessing hypoxia and prescribing dose to radioresistant compartments are still under investigation, and there is for the time being no consensus on a standardisation of biological target volume definition [Citation2,Citation18,Citation20].
In accordance with other works [Citation14,Citation16,Citation20,Citation21], a substantial gain in TCP was obtained by changing from a uniform (TCPtotal = 0.22) to a redistributed dose distribution. An absolute increase of 19% in total tumour control was demonstrated even for the worst case of redistributed dose (the 10 mm MLC). Ten millimetre leaf width will still be the MLC of choice at many radiotherapy departments in the coming years, and the current data indicates advantageous effects of implementing non-uniform dose distribution even for MLCs with this leaf width.
The treatment setups with five, seven and nine fields and five, seven and ten step-and-shoot intensity levels had fairly the same relative TCP distribution between the MLCs (). The difference in tumour control between 5 mm and 10 mm leaf width was around 10% (7–12%). By reducing the leaf width from 5 mm to 2.5 mm, an additional 5% (4–7%) gain was reached. The 2.5 mm MLC has drawbacks, however, due to the add on functionality and limited field size compared to an integrated MLC. An even more important issue could be the increased amount of monitor units (MU) required for the 2.5 mm MLC. For the setups referred above, the MU increased by a mean factor of 1.8 and 2.5 compared to the 5 mm and 10 mm MLCs, respectively (data not shown; the variations between the different setups were smaller than 10%). The large increase in monitor units for the 2.5 mm MLC may be caused by the abrupt increase in output factors for small segments with sides of equivalent squares below 20 mm [Citation22]. Furthermore, when changing from uniform to redistributed dose distribution, a relative increase in MU of 1.6, 1.8 and 2.2 was seen for the 10 mm, 5 mm and 2.5 mm MLCs, respectively. Increased integral dose was a matter of discussion when changing from 3D conformal radiotherapy (3D-CRT) to IMRT [Citation23–25]. Adding considerable head scatter dose to normal tissue by reducing MLC leaf width or applying redistributed dose distributions could therefore be controversial, and should be further evaluated.
From it can also be inferred that using more than 5 step-and-shoot intensity levels has no impact on the TCP, which was in accordance with our previous study [Citation13]. Increasing the number of intensity levels had minor consequences for the MUs for the current case (data not shown). The number of field segments, on the other hand, increased linearly with the increase in intensity levels. This would extend the treatment time, which is normally not desirable.
For the current case, introducing systematic or random setup errors larger than 2 mm gave reduced tumour control when adapting non-uniform dose distributions to the hypoxia maps (). Above 7 mm setup error, the tumour control was reduced to a level equal to that from a uniform dose distribution. Likewise, the TCP gain obtained with smaller leaf widths was reduced when taking setup errors into account. Above 4–5 mm setup error there was no difference between the MLCs. State-of-the-art image guidance using cone-beam CT (CBCT) may provide patient setup with overall accuracy of 1.5–2.5 mm for head and neck cancers [Citation26–28], and local setup errors (for regions of interest within the CBCT field of view) may be in the order of 3 mm [Citation27]. Such errors impact the potential gain in TCP shown for the current tumour model. In accordance with a previous study [Citation14], this indicated that dose redistribution should only be considered when high setup accuracy can be ensured.
The PET/CT scanner has been addressed increasingly important in radiotherapy [Citation29,Citation30], and is an image modality of choice for providing hypoxia maps [Citation2,Citation31]. Still, the voxel resolution of around 5 mm provided by the PET/CT scanner is far too large to map the true spatial pO2 variations in the tissue [Citation32], which could be below 0.15 mm [Citation5,Citation6]. This is also the case for the current tumour model, with compartmental subvolumes down to about 1 × 1 × 5 mm3, and the absolute TCP values may thus be overestimated [Citation5]. This does not affect the conclusions of this work, however, which primarily evaluates the relative differences between the MLCs.
The scope of the current work has been to assess the effect of different MLC leaf widths on tumour control for non-uniform dose distributions. For the single patient case evaluated, there was a considerable gain in tumour control by treating with leaf widths of 5 mm compared to a 10 mm MLC, and even higher gain when adopting 2.5 mm leaf widths. This applied to idealised treatment conditions, however, with minimal setup errors present. A large increase in monitor units was also experienced when using the 2.5 mm MLC.
Declaration of interest: The authors report no conflict of interest. The authors alone are responsible for the content and writing of the paper.
References
- Steel GG. Basic clinical radiobiology, 3rd London: Hodder Arnold Publication; 2002.
- Sovik A, Malinen E, Olsen DR. Strategies for biologic image-guided dose escalation: A review. Int J Radiat Oncol Biol Phys 2009;73:650–8.
- Chao KSC, Bosch WR, Mutic S, Lewis JS, Dehdashti F, Mintun MA, . A novel approach to overcome hypoxic tumor resistance: Cu-ATSM-guided intensity-modulated radiation therapy. Int J Radiat Oncol Biol Phys 2001;49: 1171–82.
- Ling CC, Humm J, Larson S, Amols H, Fuks Z, Leibel S, . Towards multidimensional radiotherapy (MD-CRT): Biological imaging and biological conformality. Int J Radiat Oncol Biol Phys 2000;47:551–60.
- Petit SF, Dekker A, Seigneuric R, Murrer L, van Riel NAW, Nordsmark M, . Intra-voxel heterogeneity influences the dose prescription for dose-painting with radiotherapy: A modelling study. Phys Med Biol 2009;54:2179–96.
- Tanderup K, Olsen DR, Grau C. Dose painting: Art or science? Radiother Oncol 2006;79:245–8.
- Roe K, Muren LP, Rorvik J, Olsen DR, Dahl O, Bakke A, . Dynamic contrast enhanced magnetic resonance imaging of bladder cancer and implications for biological image-adapted radiotherapy. Acta Oncol 2008;47:1257–64.
- Bortfeld T, Oelfke U, Nill S. What is the optimum leaf width of a multileaf collimator? Med Phys 2000;27:2494–502.
- Shepard DM, Olivera G, Angelos L, Sauer O, Reckwerdt P, Mackie TR. A simple model for examining issues in radiotherapy optimization. Med Phys 1999;26:1212–21.
- Wu VWC. Effects of multileaf collimator parameters on treatment planning of intensity-modulated radiotherapy. Med Dosim 2007;32:38–43.
- Ding MS, Newman F, Chen CH, Stuhr K, Gaspar LE. Dosimetric comparison between 3dcrt and Imrt using different multileaf collimators in the treatment of brain tumors. Med Dosim 2009;34:1–8.
- Fiveash JB, Murshed H, Duan J, Hyatt M, Caranto J, Bonner JA, . Effect of multileaf collimator leaf width on physical dose distributions in the treatment of CNS and head and neck neoplasms with intensity modulated radiation therapy. Med Phys 2002;29:1116–9.
- Malinen E, Sovik A, Hristov D, Bruland OS, Olsen DR. Adapting radiotherapy to hypoxic tumours. Phys Med Biol 2006;51:4903–21.
- Sovik A, Malinen E, Skogmo HK, Bentzen SM, Bruland OS, Olsen DR. Radiotherapy adapted to spatial and temporal variability in tumor hypoxia. Int J Radiat Oncol Biol Phys 2007;68:1496–504.
- Sovik A, Malinen E, Bruland OS, Bentzen SM, Olsen DR. Optimization of tumour control probability in hypoxic tumours by radiation dose redistribution: A modelling study. Phys Med Biol 2007;52:499–513.
- Yang Y, Xing L. Towards biologically conformal radiation therapy (BCRT): Selective IMRT dose escalation under the guidance of spatial biology distribution. Med Phys 2005; 32:1473–84.
- Niemierko A. Reporting and analyzing dose distributions: A concept of equivalent uniform dose. Med Phys 1997;24: 103–10.
- South CP, Evans PM, Partridge M. Dose prescription complexity versus tumor control probability in biologically conformal radiotherapy. Med Phys 2009;36:4379–88.
- Pettersen MN, Aird E, Olsen DR. Quality assurance of dosimetry and the impact on sample size in randomized clinical trials. Radiother Oncol 2008;86:195–9.
- Thorwarth D, Eschmann SM, Paulsen F, Alber M. Hypoxia dose painting by numbers: A planning study. Int J Radiat Oncol Biol Phys 2007;68:291–300.
- Kim Y, Tome WA. Is it beneficial to selectively boost high-risk tumor subvolumes? A comparison of selectively boosting high-risk tumor subvolumes versus homogeneous dose escalation of the entire tumor based on equivalent EUD plans. Acta Oncol 2008;47:906–16.
- Sauer OA, Wilbert J. Measurement of output factors for small photon beams. Med Phys 2007;34:1983–8.
- Bentzen SM. Theragnostic imaging for radiation oncology: Dose-painting by numbers. Lancet Oncol 2005;6: 112–7.
- Hall EJ, Wuu CS. Radiation-induced second cancers: The impact of 3D-CRT and IMRT. Int J Radiat Oncol Biol Phys 2003;56:83–8.
- Yang RJ, Xu SP, Jiang WJ, Wang JJ, Xie CB. Dosimetric comparison of postoperative whole pelvic radiotherapy for endometrial cancer using three-dimensional conformal radiotherapy, intensity-modulated radiotherapy, and helical tomotherapy. Acta Oncol 2010;49:230–6.
- Johansen J, Bertelsen A, Hansen CR, Westberg J, Hansen O, Brink C. Set-up errors in patients undergoing image guided radiation treatment. Relationship to body mass index and weight loss. Acta Oncol 2008;47:1454–8.
- van Kranen S, van Beek S, Rasch C, van Herk M, Sonke JJ. Setup uncertainties of anatomical sub-regions in head-and-neck cancer patients after offline Cbct guidance. Int J Radiat Oncol Biol Phys 2009;73:1566–73.
- Bertelsen A, Nielsen M, Westberg J, Jensen HR, Brink C. The representitativeness of patient position during the first treatment fractions. Acta Oncol 2009;48:259–66.
- Vanderstraeten B, Duthoy W, De Gersem W, De Neve W, Thierens H. [F-18]fluoro-deoxy-glucose positron emission tomography ([F-18]FDG-PET) voxel intensity-based intensity-modulated radiation therapy (IMRT) for head and neck cancer. Radiother Oncol 2006;79:249–58.
- Gregoire V. Is there any future in radiotherapy planning without the use of PET: Unraveling the myth. Radiother Oncol 2004;73:261–3.
- Grosu AL, Piert M, Molls M. Experience of PET for target localisation in radiation oncology. Br J Radiol 2005;78: 18–32.
- Toma-Dasu I, Dasu A, Brahme A. Dose prescription and optimisation based on tumour hypoxia. Acta Oncol 2009; 48:1181–92.