Abstract
Purpose. Evaluating a method for anatomic changes assessment and actually delivered doses during head and neck (H&N) cancer radiotherapy (RT) utilizing volumetric images from cone-beam CT (CBCT) and a commercially available deformable image registration (DIR) software. Material and methods. Thirty-three daily acquired CBCT image sets and the planning CT of one H&N cancer patient were retrospectively transferred from a standard treatment planning system (TPS) to the DIR software. The planning CT was deformed to each CBCT and the contours delineated for planning purposes were propagated. Transfer of each deformed planning CT back into the TPS enabled re-calculation of the actual daily delivered dose distribution based on online image-guidance. For both normal tissues and target volumes the deformed contours were visually evaluated and dose-volume histogram (DVH) parameters were calculated. Results. The workflow of the method took 45 minutes to estimate delivered dose for each treatment fraction. Propagated deformed contours were acceptable for evaluating changes in anatomy. Based on daily DVH parameters the actual delivered dose could be monitored. Conclusion. A proof-of-principle method to quantitatively monitor anatomical changes and delivered dose during the course of fractionated RT for H&N cancer has been demonstrated. This provides a tool for exploring adaptive re-planning strategies.
Radiotherapy (RT) is the primary treatment of squamous cell carcinoma of the head and neck (H&N), often in combination with surgery and/or chemotherapy. Using intensity-modulated RT (IMRT) in the management of H&N tumours, it is now possible to individualize the dose distribution to maximize dose to tumour volumes while simultaneously sparing normal tissues [Citation1–3]. The increasingly conformal dose distributions are strongly dependent on patient geometry and any changes during the treatment course may lead to dosimetric changes such as underdosage of target and/or overdosage of normal tissues. Patient immobilization and in-room image-guidance are applied to minimize the contribution from setup uncertainties, but considerable anatomic changes caused usually by tumour shrinkage and/or weight loss [Citation4], may result in additional discrepancies between planned and delivered dose [Citation5–10]. To obtain a satisfactory target coverage and normal tissue sparing, re-planning to adapt to the new anatomy may be required [Citation11–13]. Much of the current research aims at creating evidence for the potential clinical benefit of adaptive radiotherapy (ART) [Citation14,Citation15].
Anatomic changes can be assessed using multiple conventional kV CT scans during the treatment course [Citation4–6,Citation13]. However, this method is in general not feasible for daily image-guided radiotherapy (IGRT). Volumetric imaging on a daily basis using mega-voltage CT (MVCT) has provided a reliable method for assessment of dosimetric changes in the parotid glands during the course of RT [Citation8,Citation9]. The integration of a radiographic and tomographic imaging system with a conventional linear accelerator [Citation16] has been a milestone in IGRT [Citation17]. Many RT clinics, including our own institution, now use gantry-mounted commercial kV cone-beam CT (CBCT) systems for daily patient positioning. However, the quality of images obtained with CBCT is still inferior to conventional CT with respect to the dose-computational properties due to the presence of scattered radiation which deteriorate the Hounsfield unit (HU) values. To avoid this problem, Yang et al. have demonstrated the use of deformable image registration (DIR) to deform the original planning CT to the anatomy of a CBCT image set and calculate the dose on this instead, i.e. performing a so-called deformed electron density mapping (DEDM) [Citation18].
In this study, we have investigated a method to assess the consequences of anatomic changes in the course of H&N IMRT on the delivered dose to both the target and critical organs using the combination of daily kV CBCT images, a commercially available DIR software and a standard treatment planning system (TPS).
Material and methods
Imaging materials and procedures
Thirty-three CBCT image sets taken during the course of radical radiotherapy in a 60-year-old male with T1N2M0 oropharyngeal cancer treated with accelerated IMRT (66 Gy in 33 fractions, 6 fractions per week) were used as a template for deformation of planning CT and propagation of the contours delineated for planning purposes. The case was retrospectively selected from a series of 45 patients diagnosed with locally advanced H&N cancer and treated with daily CBCT image-guidance between March and October 2009. The selection criteria were (Citation1) complete body outline and adequate coverage of target volumes and normal structures by the field-of-view (FOV) in the CBCT images, (Citation2) standard treatment plan configuration with a midline position of the isocenter, and (Citation3) bilateral nodal involvement. Besides the complete CBCT image sets for one patient used in this study, the method was tested in nine other H&N patients on CBCT scans from the last treatment fraction (no data included).
The CBCT image sets were acquired with the gantry-mounted on-board-imager (OBI v. 1.4, Varian Medical Systems, Palo Alto, CA, USA). For online patient positioning a rigid volumetric image registration was performed, matching the kV CBCT to the planning CT using the bone window (HU values above 200) and a region-of-interest (ROI) including the cervical spine and the base of the skull. In this 3D-match only translational shifts were considered. The CBCT image sets and the online registrations were accessible in our TPS (Eclipse v. 8.2.24, Varian Medical Systems) for retrospective evaluation.
The standard CBCT acquisition mode was applied for the daily imaging (x-ray tube parameters: 100 kV, 40 mA, 10 ms) utilizing the full fan with bow-tie filter and half scan acquisition which rotated the gantry between 20 and 180 degrees, i.e. the kV x-ray source rotated behind the patient between 290 and 90 degrees, respectively. The axial FOV had a diameter of 25 cm with isocenter-centered cranial-caudal coverage of 17.5 cm. Default image reconstruction parameters were set to create CBCT images with a slice distance of 3 mm and an in-slice pixel size of 0.49 × 0.49 mm. In-house measurements using the methodology of Song et al. [Citation19] and Kan et al. [Citation20] showed an upper limit for the imaging dose by the applied IGRT scheme of 0.25 Gy for the spinal cord and 0.29 Gy for the brainstem and the skin at irradiated site.
The IMRT treatment plan was based on a fan-beam helical CT scan (Phillips Mx8000 IDT 16, Philips Medical Systems, Eindhoven, The Netherlands) with 3 mm slice spacing and a pixel size of 0.98 × 0.98 mm taken typically one week before treatment start (planning CT, pCT).
Workflow for deformable registration, contour propagation and dose calculation
The workflow and methodology for the deformable registration and contour propagation is illustrated in , with the following four points ((a) – (d)) corresponding to those in the figure:
Figure 1. Workflow diagram illustrating the different steps to obtain dose and volume parameters from daily CBCT image sets (total number N) using a treatment planning system (left) and a deformable image registration software (right). See text for details. pCT = planning CT; CBCTfxX = cone-beam CT acquired at fraction X; structuresX = structures propagated from planning CT to image set acquired at fraction X; pCTdeftoCBCTfxX = planning CT deformed to anatomy of cone-beam CT acquired at fraction X.
(a) The original pCT including delineated target and normal tissue structures and the acquired CBCT from each treatment fraction (fx1 to fxN) were manually exported using the DICOM protocol of the TPS.
(b) The data were subsequently imported into the commercially available image registration software Velocity Advanced Imaging (VAI) (v. 2.1.1., Velocity Medical Solutions, Atlanta, GA, USA). In VAI each CBCT was used as a reference image to which the pCT was registered. Initially a rigid automatic match based on the bony anatomy was performed followed by a non-rigid DIR which created a voxel-to-voxel displacement map between the two image sets. The DIR algorithm used in VAI is based on B-Spline regularization combined with a multi-resolution mutual information similarity metric, as described in detail and evaluated quantitatively by Lawson et al. [Citation21] for registrations between CT and CBCT. The registration was done in iterative steps to control the node spacing in the deformation grid and the deformation constraints in different ROIs depending on the extent of deformations. Using a blended view of the image sets, continuous visual inspection of the deformations was used to qualitatively ensure that they were consistent with the anatomic boundaries between the various structures and volumes in the region covered. The final deformation map of the registration of the pCT to each CBCT was applied to the original planning contours, thus facilitating a contour propagation from the pCT to the CBCT images. The contours on the CBCT were again visually checked.
(c) For each treatment fraction (fxX; X = 1,..,N), the final result in the DIR software was a deformation of the pCT (denoted pCTdeftoCBCTfxX) to the CBCT (CBCTfxX) with a corresponding structure set (structuresX), all of which was transferred in DICOM format back to the TPS.
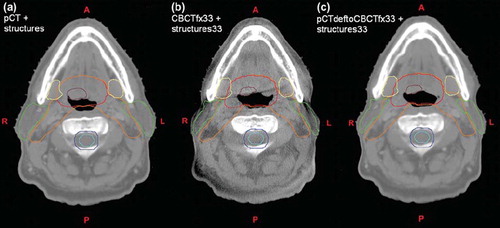
(d) In the TPS, the re-sampled export of the deformed pCT facilitated registration to the original pCT via the daily online registration (as the corresponding CBCT). In this way the fluences of the original treatment plan was copied and re-calculated on the daily anatomy on deformed pCT images (i.e. the DEDM approach), aligning the isocenter according to the online registration. shows an example of corresponding axial slices for the result of deformation and contour propagation between the pCT and the CBCT from fraction 33.
Figure 2. Three corresponding axial slices showing (a) planning CT with structures; (b) cone-beam CT acquired at fraction 33 with propagated structures from planning CT after deformable image registration; (c) planning CT deformed to anatomy of cone-beam CT acquired at fraction 33. Structures shown are clinical target volume 1 (CTV1) (brown); CTV2 (red); CTV3 (orange); spinal cord (cyan) with planning risk volume (blue); parotid (green) and submandibular (yellow) glands.
Considered volumes and the treatment plan
For the IMRT course, three clinical target volumes (CTVs) had been defined; CTV1 encompassed the gross tumour volume (GTV) of primary tumour (PT) and metastatic lymph node tumour (LN), CTV2 – high-risk elective volume based on CTV1 with individually constructed margin, and CTV3 consisting of the combination of CTV2 and regional lymph node regions with potential risk of sub-clinical disease [Citation22]. Five millimeter CTV to PTV margin was used. The prescribed dose was 66, 60 and 50 Gy in 33 fractions to PTV1, PTV2 and PTV3, respectively, using a simultaneous integrated boost (SIB) technique. The IMRT treatment plan consisted of seven co-planar 6 MV photon beams. The organs-at-risk (OARs) delineated included brainstem, spinal cord, parotid glands, submandibular glands and larynx. The brain stem and spinal cord planning risk volumes (PRVs) were constructed by adding 5 mm margin to them.
All delineations were conducted and evaluated by the radiation oncologist (BAW). The deformed contours of spinal cord, parotid glands and submandibular glands propagated to the 33 fractional CBCT image sets were evaluated by assessing the concordance with anatomical position and shape of the corresponding structures on CBCT according to the following scale: 1. good - contour accurate, 2. acceptable - minor inconsistency, and 3. unacceptable - major corrections needed. Simultaneously, propagated contours of the three CTVs were reviewed for consistency with the surrounding anatomy, as no structural information existed for direct evaluation of the targets on the CBCT scans.
Results
The workflow performance
The performance of the workflow depicted in depends primarily on two elements of the process; the DIR and the ease of export and import between two commercial software systems. The time consumption for the DIR of the pCT to each CBCT was 22 minutes (median; range 7–43 minutes). This includes the time from the first rigid registration to the last of typically four to eight iterations of the deformable registration process. There was no statistically significant difference in the registration time throughout the treatment fractions (p-value =0.42). Each of the three steps of initial export/import, contour propagation and re-sampled export, and import in TPS took 5 minutes on average for each fraction. With additional 7 minutes for plan alignment and dose calculation, the whole process to obtain the daily DVH for the H&N case was completed in approximately 45 minutes (not included contour review by radiation oncologist). The test of the method in nine other patients on last fraction CBCT scans gave similar results.
Review of the propagated deformed contours
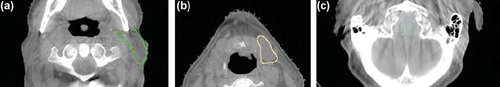
The propagated normal structures were evaluated on 33 CBCT images (165 contours). All 165 contours were scored as satisfactory representatives for the purpose of extracting DVH parameters. The majority of the contours were considered acceptable (128 contours, 77.5%), whereas the rest (37 contours, 32.5%) were good. shows deformed contours superimposed on CBCT images, which were scored acceptable – minor inconsistency. The similar review of the propagated contours for the three target volumes (99 contours) showed acceptable results.
Figure 3. Axial CBCT slices with examples of propagated deformed contours evaluated as acceptable. (a) Left parotid with minor inconsistent segmentation. (b) Left submandibular gland contour going slightly into level II nodal volume. (c) Inconsistent overlap between spinal cord (cyan) and brain stem (light green).
Results for the daily dose and volume parameters
The ratio of the volume and mean dose to the initially planned for the parotid glands are shown in . The volume decreased approximately 30% from planning to the last treatment fraction for both glands whereas the correspondingly daily mean dose increased to a level of 115% during the last half of the RT course. Unlike the volumetric changes, the daily dose distribution will be affected by the daily patient positioning incorporated. For both parameters a considerable change was seen around fraction 11. illustrates the accumulation of the daily delivered mean dose to the parotid gland volumes relative to the planned total mean dose, showing an 11% and 9% increase for the left and right parotid gland, respectively. Simultaneously, the center-of-mass (COM) distance between the glands decreased by 5 mm from planning to the last fraction. In a similar way for the submandibular glands, small changes in the mean dose were observed despite a decrease in volume of almost 20% for both glands (data not shown). From week 1 to week 6 of treatment the patient experienced a relative weight loss of 7%.
Figure 4. Parotid glands: (a) Ratio of volume and mean dose for each fraction to initial treatment planning. (b) Ratio of accumulated daily mean dose to initially planned total mean dose (indicated by straight line). Insert shows dose difference between accumulated and planned mean dose.
The dose to the most critical normal tissues, such as the spinal cord and the brain stem, are parameters to monitor carefully during the treatment course. illustrates the maximum dose represented by D1% to these organs and their PRVs for each fraction. More or less constant values were observed throughout the RT course which was anticipated through the daily IGRT based on bone match.
Figure 5. Maximum dose to spinal cord (SC) and brain stem (BS) with associated planning risk volumes (PRVs) for each fraction represented by dose to the maximum 1% of the volume (D1%).
For the targets, and show the volumes of the three CTVs as treatment progressed on absolute and relative scale, respectively. The two largest CTVs (CTV2 at 60 cm3 and CTV3 at 270 cm3 on pCT) showed a steady decrease in volume with a 10–20% reduction at the end of RT. A similar reduction was observed for the smallest high-dose CTV1 (7.7 cm3 on pCT) which, however, showed increased fraction-to-fraction variability towards the end. A zoom of the absolute volume scale is depicted in illustrating the behavior of the CTV1 again together with that of the GTV PT and GTV LN. The variability in CTV1 is seen to follow closely that of GTV PT, which is the part of the CTV1 next to the air cavity. The dosimetric consequences of the volume reductions were increased dose coverage as seen from the relative volumes receiving at least 95% and 99% of the prescription dose for the three respective CTVs in .
Figure 6. Target volumes: (a) Absolute volume of the three CTVs over time. (b) Absolute volume of CTV1, GTV primary tumour and GTV lymph nodes over time (c) Ratio of volume for each fraction to the initial treatment planning. (d) Fractional volume receiving 95% and 99% of prescription dose which equals 66 Gy (100%), 60 Gy (90.9%) and 50 Gy (75.8%) for CTV1, CTV2 and CTV3, respectively (note break on y-axis). Abbreviations: CTV = clinical target volume; GTV = gross tumour volume; PT = primary tumour; LN = lymph nodes; VXX% = fractional volume (%) receiving XX% of prescribed dose.
Discussion
The described method can be used to derive dose and volume parameters from daily CBCT images acquired for setup correction. This allows for a daily evaluation of actual DVH parameters for both target and normal tissue. Clinical data of this kind are required for development of adaptive strategies for re-planning H&N cancer patients with respect to action thresholds, timing and frequency.
The average time consumption in DVH generating was 45 minutes per treatment fraction, which is unsuitable for online application with the patient on the treatment couch. This would require the complete process for treatment evaluation to be performed in less than 5–10 minutes. Our approach consisted of two parts of similar time span - export/import, contour propagation, dose calculation etc., and performing the DIR. While the first, method and/or system related step, could be easily reduced to a few minutes or less by integrating the DIR software into the TPS and automation of the procedure, the latter part will be dependent on the performance of the DIR software [Citation23], the DIR algorithm and on the degree of deformation present in each specific image set. Besides that, our small test in nine other H&N cancer patients gave no indications of that the approach was unsuitable for the population in general. Although not yet ready for online use, the described method can be utilized for offline investigations of individual, patient specific thresholds for adaptation based on DVH parameters.
DVH parameters monitored throughout the RT course are shown in . The volumetric shrinkage of the parotid glands resulted in medial displacement of their COM positions towards the high dose region with proportional dose increase, which is in agreement with previous reports [Citation4–10,Citation12,Citation13]. The most significant changes could be seen around fraction 11 followed by a more steady progression of both parotid volume and dose (), thus it suggests that re-planning at this time point could improve the dose distribution with respect to parotid sparing. As the submandibular glands were located in the high dose region and were not originally spared, small changes in mean doses were observed. In the general efforts to reduce xerostomia after RT, however, the monitoring of DVH parameters could elucidate the sparing potential of the submandibular glands.
The volumes of the various CTVs decreased gradually over time in accordance with previous reports [Citation4,Citation13], which resulted in increased dose coverage (). Considerable variability should be expected in the shrinkage patterns of the GTV [Citation4] as seen for CTV1 and GTV PT in the present case. Although redefining the target in concordance with tumour shrinkage can result in reducing the toxicity, it also bears the risk of underdosing microscopic disease and thereby jeopardizing local control [Citation24]. Future studies will show if reduction of CTV-PTV margin to increase the sparing potential of normal tissue affects the therapeutic effect.
We have evaluated the deformation of the pCT to the daily CBCT images by visual inspection during the process and after the propagation of contours. Since a good agreement both in shape and position on the daily CBCT scans were observed for the various structures, we have assumed that the accuracy of the DIR was acceptable for the purpose of evaluating DVH parameters. The uncertainty in normal tissue contours arising from DIR is expected to be similar to that between delineations from different observers [Citation9]. Furthermore, daily patient setup errors can contribute to uncertainty in delivered dose as much as accuracy of DIR [Citation6,Citation7]. It should be stressed, however, that the performed DIR in this study is not validated for sub-millimetre registration accuracy and therefore it should be used with caution, for example, dose accumulation.
The CBCT image modality used in the present study is a versatile and efficient tool for IGRT. However, two pending problems need to be improved for CBCT-based ART: the inconsistency in HU due to scatter and the limited FOV in the cranial-caudal direction. The former was avoided by DEDM after DIR between CBCT and pCT in this study, but for future application developments in the reconstruction process should solve this to enable direct re-planning on CBCT. The limited FOV prevents direct dose reconstruction (and re-planning) if the complete treated anatomy region is not covered. At least two methods have been proposed to solve this. Ding et al. acquired two consecutive CBCT scans with a couch displacement in between; a subsequent merge yielded the enhanced FOV [Citation25]. Another method was exploited by Lee et al. in which slices from the pCT was used to extend daily MVCT image sets after DIR [Citation8,Citation9]. A similar approach would be preferable to integrate into the method described in this work, which would require software developments outside the commercial systems used here. However, until these problems have been solved, the approach to adaptive re-planning can be through a conventional CT scan triggered by unanticipated changes during the treatment course disclosed by the present method using daily CBCT.
In conclusion, a proof-of-principle method to quantitatively monitor changes in anatomy and delivered dose during the course of fractionated RT for H&N cancer has been demonstrated. Using daily CBCT and deformable registration, offline adaptive strategies are feasible. For online approaches, the presented setup is, however, still too time consuming and needs further improvements and integration of software.
Acknowledgements
Supported by CIRRO – The Lundbeck Foundation Center for Interventional Research in Radiation Oncology, the Danish Council for Strategic Research, the Danish Cancer Society and Varian Medical Systems (Palo Alto, CA, USA).
Declaration of interest: This study has been supported by Varian Medical Systems, Palo Alto, CA, USA. The authors alone are responsible for the content and writing of the paper.
References
- Cozzi L, Fogliata A, Bolsi A, Nicolini G, Bernier J. Three-dimensional conformal vs. intensity-modulated radiotherapy in head-and-neck cancer patients: Comparative analysis of dosimetric and technical parameters. Int J Radiat Oncol Biol Phys 2004;58:617–24.
- Lee N, Puri DR, Blanco AI, Chao KS. Intensity-modulated radiation therapy in head and neck cancers: An update. Head Neck 2007;29:387–400.
- Gregoire V, De Neve W, Eisbruch A, Lee N, Van den Weyngaert D, Van Gestel D. Intensity-modulated radiation therapy for head and neck carcinoma. Oncologist 2007;12:555–64.
- Barker JL Jr, Garden AS, Ang KK, O'Daniel JC, Wang H, Court LE, . Quantification of volumetric and geometric changes occurring during fractionated radiotherapy for head-and-neck cancer using an integrated CT/linear accelerator system. Int J Radiat Oncol Biol Phys 2004;59:960–70.
- Robar JL, Day A, Clancey J, Kelly R, Yewondwossen M, Hollenhorst H, . Spatial and dosimetric variability of organs at risk in head-and-neck intensity-modulated radiotherapy. Int J Radiat Oncol Biol Phys 2007;68:1121–30.
- O'Daniel JC, Garden AS, Schwartz DL, Wang H, Ang KK, Ahamad A, . Parotid gland dose in intensity-modulated radiotherapy for head and neck cancer: Is what you plan what you get? Int J Radiat Oncol Biol Phys 2007;69:1290–6.
- Han C, Chen YJ, Liu A, Schultheiss TE, Wong JY. Actual dose variation of parotid glands and spinal cord for nasopharyngeal cancer patients during radiotherapy. Int J Radiat Oncol Biol Phys 2008;70:1256–62.
- Lee C, Langen KM, Lu W, Haimerl J, Schnarr E, Ruchala KJ, . Assessment of parotid gland dose changes during head and neck cancer radiotherapy using daily megavoltage computed tomography and deformable image registration. Int J Radiat Oncol Biol Phys 2008;71:1563–71.
- Lee C, Langen KM, Lu W, Haimerl J, Schnarr E, Ruchala KJ, . Evaluation of geometric changes of parotid glands during head and neck cancer radiotherapy using daily MVCT and automatic deformable registration. Radiother Oncol 2008; 89:81–8.
- Cheung J, Aubry JF, Yom SS, Gottschalk AR, Celi JC, Pouliot J. Dose recalculation and the Dose-Guided Radiation Therapy (DGRT) process using megavoltage cone-beam CT. Int J Radiat Oncol Biol Phys 2009;74:583–92.
- Hansen EK, Bucci MK, Quivey JM, Weinberg V, Xia P. Repeat CT imaging and replanning during the course of IMRT for head-and-neck cancer. Int J Radiat Oncol Biol Phys 2006;64:355–62.
- Kuo YC, Wu TH, Chung TS, Huang KW, Chao KS, Su WC, . Effect of regression of enlarged neck lymph nodes on radiation doses received by parotid glands during intensity-modulated radiotherapy for head and neck cancer. Am J Clin Oncol 2006;29:600–5.
- Wu Q, Chi Y, Chen PY, Krauss DJ, Yan D, Martinez A. Adaptive replanning strategies accounting for shrinkage in head and neck IMRT. Int J Radiat Oncol Biol Phys 2009;75:924–32.
- Grau C, Muren LP, Høyer M, Lindegaard J, Overgaard J. Image-guided adaptive radiotherapy – integration of biology and technology to improve clinical outcome. Acta Oncol 2008;47:1182–5.
- Greco C, Ling CC. Broadening the scope of image-guided radiotherapy (IGRT). Acta Oncol 2008;47:1193–200.
- Jaffray DA, Siewerdsen JH, Wong JW, Martinez AA. Flat-panel cone-beam computed tomography for image-guided radiation therapy. Int J Radiat Oncol Biol Phys 2002;53:1337–49.
- Verellen D, De Ridder M, Tournel K, Duchateau M, Reynders T, Gevaert T, . An overview of volumetric imaging technologies and their quality assurance for IGRT. Acta Oncol 2008;47:1271–8.
- Yang Y, Schreibmann E, Li T, Wang C, Xing L. Evaluation of on-board kV cone beam CT (CBCT)-based dose calculation. Phys Med Biol 2007;52:685–705.
- Song WY, Kamath S, Ozawa S, Ani SA, Chvetsov A, Bhandare N, . A dose comparison study between XVI and OBI CBCT systems. Med Phys 2008;35:480–6.
- Kan MW, Leung LH, Wong W, Lam N. Radiation dose from cone beam computed tomography for image-guided radiation therapy. Int J Radiat Oncol Biol Phys 2008;70:272–9.
- Lawson JD, Schreibmann E, Jani AB, Fox T. Quantitative evaluation of a cone-beam computed tomography-planning computed tomography deformable image registration method for adaptive radiation therapy. J Appl Clin Med Phys 2007;8:2432.
- Gregoire V, Levendag P, Ang KK, Bernier J, Braaksma M, Budach V, . CT-based delineation of lymph node levels and related CTVs in the node-negative neck: DAHANCA, EORTC, GORTEC, NCIC,RTOG consensus guidelines. Radiother Oncol 2003;69:227–36.
- Østergaard Noe K, De Senneville BD, Elstrøm UV, Tanderup K, Sørensen TS. Acceleration and validation of optical flow based deformable registration for image-guided radiotherapy. Acta Oncol 2008;47:1286–93.
- Eisbruch A, Gregoire V. Balancing risk and reward in target delineation for highly conformal radiotherapy in head and neck cancer. Semin Radiat Oncol 2009;19:43–52.
- Ding GX, Duggan DM, Coffey CW, Deeley M, Hallahan DE, Cmelak A, . A study on adaptive IMRT treatment planning using kV cone-beam CT. Radiother Oncol 2007; 85:116–25.