Abstract
Background. Diffusion weighted imaging (DWI) has gained interest as an imaging modality for assessment of tumor extension and response to cancer treatment. The purpose of this study is to assess the impact of the choice of b-values on the calculation of the Apparent Diffusion Coefficient (ADC) for locally advanced gynecological cancer and to estimate a stable interval of diffusion gradients that allows for best comparison of the ADC between patients and institutions. Material and methods. Six patients underwent a high resolution single shot EPI based DWI scan with 16 different diffusion gradients on a 3 Tesla Philips Achieva MR-scanner. Data analysis was performed by applying a monoexponential and a biexponential model to the acquired data. The biexponential function models the effect of both perfusion and diffusion. Results and conclusion. ADC changes of up to 40% were seen with the use of different b-values. Using a lower b-value ≥ 150 s/mm2 and an upper b-value ≥ 700 s/mm2 limited the variation to less that 10% from the reference ADC value. By eliminating the contribution of perfusion the uncertainty of quantitative ADC values were significantly reduced.
Diffusion is related to the Brownian or random motion of water molecules. Using pure water at body temperature (37°C) as a reference standard, the average displacement of water molecules during a 50 ms time is approximately 30 μm [Citation1]. Because this is comparable to or greater than the dimensions of cells, there is a high probability that water molecules will interact with cells and their hydrophobic membranes and macromolecules will slow down the motion of water. As such, the observed or “apparent” diffusion of water within tissues is typically several-fold less than in pure water. Diffusion as measured by MRI can be exploited to gain information about the underlying physiological properties such as cellular density and cell type [Citation2–4]. This information has relevance in oncology for a wide number of reasons. It has potential to be used for tumor staging since the cellular properties of a tumor is distinctively different from that in normal healthy tissue [Citation5]. It may be used as an early non-invasive way of monitoring tumor response to cancer treatment [Citation6–8]. Also, the quantitative nature of the Apparent Diffusion Coefficient (ADC) parameter allows for absolute comparison between patients and institutions. Much work has been done in this area, but most studies have used a set of diffusion sensitization values (also known as b-values) that makes it difficult to compare these reports. The main reason for this is that a simplified model has usually been applied to an underlying physiology that is far more complex. The monoexponential approach assumes that the diffusing water molecules are present in a homogeneous surrounding, but this is often not the case. The more general approach is known as the Intravoxel Incoherent Motion (IVIM) [Citation9–11]. This method suggests that the water present in tissue is divided into two non-exchanging compartments – intra-vascular and extra-vascular. The extra-vascular compartment consists of water inside and between cells that move relatively slowly. This motion is what constitutes “apparent diffusion”. The intra-vascular compartment contains the water molecules inside the blood vessels. This water travels further distances per unit time than extra-vascular water because intra-vascular water flows along with the blood. This second motion has been called “pseudo-diffusion”, but has also been referred to as perfusion [Citation12]. It is this perfusion contribution to the signal attenuation curve that is often neglected in data analysis. It has been shown that it is possible to exclude these fast perfusion-based effects by increasing the minimum diffusion gradient [Citation13]. By using b-values ≥ 150 s/mm2 the ADC values will not be influenced by perfusion and will depend monoexponentially on b-values [Citation1,Citation6]. The purpose of this study was therefore to determine the dependence of ADC values on the choice of b-values and quantify the deviation from the ADC when influenced by perfusion for DW MRI in locally advanced gynecologic cancer.
Material and methods
Patients
Patients with gynecological cancer who were candidates for curative radiotherapy or combined cisplatin-based chemoradiation therapy were eligible for this study. The tumor staging was done according to the International Federation of Gynecology and Obstetrics (FIGO) guidelines [Citation14]. Patient relevant data is summarized in .
Table I. Patient specific data.
MR imaging
The data acquisition was done using a 3T MR-scanner (Philips Achieva 3T-X) using single shot EPI based DWI in six patients prior to radiotherapy. Five patients had locally advanced cervical cancer and one had vaginal cancer. Parameters for the MR diffusion sequence was: TR = 2 000 ms, TE = 81 ms, the number of averages 6, matrix size was 256 = 256, resolution 2.7 = 2.7 = 5 mm and total scan time 18:30 min. Each scan consisted of 16 b-values (0, 10, 30, 50, 75, 100, 125, 150, 200, 400, 700, 1 000, 1 200, 1 500, 2 000, 2 500) s/mm2 averaged over three ortogonal directions.
Image analysis
The reference ADC value was calculated by minimizing the biexponential model using the Levenberg-Marquardt algorithm in the b-value range [0, 1 000] s/mm2. This model takes into account both perfusion (D*) and diffusion (D) and estimates the perfusion fraction (f). Using the original nomenclature of Le Bihan.
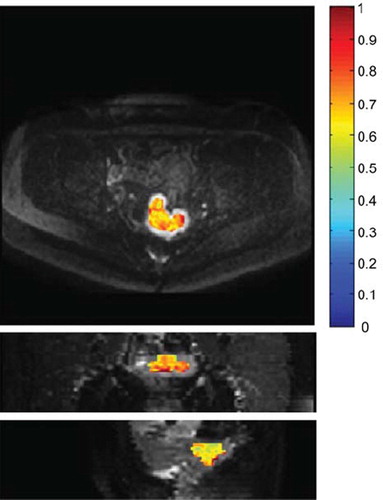
S is the signal intensity and S0 is the signal intensity at b = 0 s/mm2. The data processing was done using in-house scripts developed in Matlab©. The Volume Of Interest (VOI) was chosen in the tumor region guided by slices at b = 1 200s/mm2, as shown in . The reference ADC values were compared to ADC estimates obtained by using the monoexponential model:
Figure 1. Volume of Interest (VOI). Transversal (top), coronal (middle) and sagital (bottom) slice showing the VOI for a patient with advanced cervical cancer. Overlaid is the diffusion map calculated using a monoexponential model to the b-values in the range 150–1 000 s/mm2. The color scale has the units × 10−3 mm2/s.
In order to compare common b-value schemes with the dataset that completely describes the signal curve, ADC values were calculated for 11 combinations of b-values (). The choice of cut-off at the 150 s/mm2 was based on supporting literature [Citation1].
Table II. Comparison of different combinations of diffusion gradients (b-values).
Curvature
The curvature describes the rate of change of the slope. A curvature of zero implies a stable slope which indicates a region that can be approximated by a monoexponential function. The natural logarithm was applied to the expression of the biexponential model before computing the curvature:
S is the signal and b the variable b-value.
Results
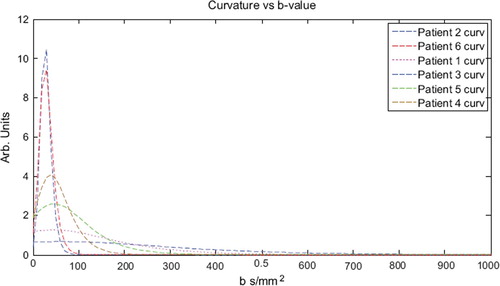
The maximum curvature indicates the limit where the contributions from perfusion and diffusion changes dominance. This was for all patients found to be at b = 43 ± 15 s/mm2 (). Above this limit the diffusion dominates the slope of the biexponential function and below it is dominated by perfusion. In order to avoid contamination from the perfusion contribution a large margin from the cut-off b-value was chosen and this corresponded well with a low curvature.
Figure 2. Curvature of the biexponential fits to the diffusion data. The maximum curvature indicates the limit where the contributions from perfusion and diffusion changes dominance. This was consequently found to be at b = 43 ± 15 s/mm2.
shows the percentage difference between each b-value scheme and the reference ADC value. The inclusion of b = 0 s/mm2 in a monoexponential fit resulted in overestimation of the ADC value by 10–55%. The most reliable schemes were found to be those including b-values ≥ 150 s/mm2 with at least one b-value ≥ 700 s/mm2. This resulted in deviations from reference values of less than or 10%. Using 400 s/mm2 as upper b-value resulted in significant overestimation (p < 0.001) (). No significant impact on the ADC value was found (Paired Students t-test, p = 0.14) when an extra b-value of 400 s/mm2 was included into a regime of b = 150 s/mm2 and 700 s/mm2. This indicates that it is sufficient to use the monoexponential model with two b-values; a minimum b-value ≥ 150 s/mm2 and one b-value ≥ 700s/mm2. The perfusion fraction (f) was estimated from the biexponential model to be 10 ± 3% for all six patients. The perfusion coefficients (D*) calculated with the biexponential model had very large variation between patients with mean and SD of 42 ± 44 mm2/s.
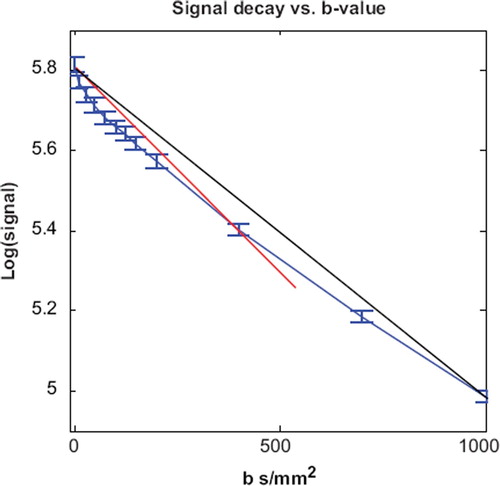
Figure 3. Variation of the apparent diffusion coefficient. The blue line is the signal decay from patient 1. The red line corresponds to an ADC of 0.99 mm2/s obtained by monoexponential fit using b-values 0 and 400 s/mm2. The black line corresponds to an ADC 0.79 mm2/s (b-values 0 and 1000 s/mm2). The diffusion coefficients are overestimated by 48% and 18%, respectively.
Discussion
This study shows that ADC values calculated on the basis of monoexponential fits including b = 0 s/mm2 leads to significant and systematic overestimation of the ADC values of up to 40%. Consequently, ADC values cannot be quantitatively compared if they are not acquired according to the same choice of b-values. The monoexponential region was well described by using b-values of 150 s/mm2, 700 s/mm2 and no additional information was gained by including a value in between (400 s/mm2). Therefore, scan time can be minimized by not including b = 400 s/mm2. The determined perfusion fraction is comparable to reports in other sites [Citation12].
Many publications reporting ADC values use different schemes of diffusion gradients and often only two points are used to retrieve the ADC [Citation3,Citation15,Citation16]. At least two b-values are required to solve the monoexponential diffusion equation. b = 0 s/mm2 is widely used due to the fact that this DWI sequence is equal to a T2-weighted sequence. It is also the fastest DWI scan to acquire and a high signal-to-noise ratio which are all relevant arguments, when deciding on the choice of b-values. b = 0 s/mm2 is fastest because one diffusion direction is sufficient instead of three. Speed of the diffusion scans has been the main focus for most sites outside of the brain since this will limit the effects of patient motion artifacts. DWI has been prone to severe motion sensitivity due to the long scan times. However, recent advances in MRI hardware and sequencing have opened the possibility for use in the abdominal and pelvic regions [Citation17].
In the study by Liu et al. b = 0 s/mm2 and b = 1 000 s/mm2 were used to determine the ADC value in uterine cervical cancer. This study nicely shows how the cellular density correlates with ADC. But since this ADC is influenced by the perfusion contribution their ADC values will according to our findings be overestimated by around 15% (). If the goal is to grade the tumor on the basis of acquired ADC an improved accuracy is expected by excluding perfusion from the signal ().
An additional confounding factor in determination of ADC values is the documented variability between scanners as showed by Sasaki et al. [Citation18]. This study uses b = 0 s/mm2 and b = 1 000 s/mm2 and showed systematic difference between different scanners. This indicates that in addition to the ADC dependence of b-value scheme there are further challenges for using ADC as a quantitative parameter. For example, the ADC values may be dependent on echo time, pulse duration, and magnetic field. The diffusion gradient is related to the signal intensity (S) and the Diffusion Coefficient as follows:
The same b-value can be achieved with different combinations of echo times (Δ), pulse duration (δ) and gradient strength. G is the field strength and g is the gyromagnetic ratio. By changing the echo time the scan becomes more or less T2-weighted and therefore the contrast and signal intensities are also affected. The ADC dependence on these parameters should be investigated or at least standardized.
Whether the biexponential model is the most appropriate way of describing the signal decay can also be questioned. There is still no clinical or biological evidence that the biexponential model is actually corresponding to an underlying physiology of an intravascular (perfusion) and an extravascular (diffusion) compartment. A cumulative Taylor expansion of the monoexponential model may just as well be an adequate description of the underlying physiology [Citation19]. In fact, if the zeroth, first and second term is used, this model has only three degrees of freedom instead of four, like the biexponential model.
Adaptive MRI guided radiotherapy is a promising technique to increase tumor local control and reduce normal tissue exposure in locally advanced cervix cancer [Citation20–23]. Further progress in image guide RT in cervix cancer may be possible by including functional imaging as has also been proposed and acknowledged for many types of cancer, including prostate cancer [Citation24]. The concept of sculpting the dose to the underlying physiological properties of the tumor is often referred to as “dose-painting” [Citation25] and the potential role of diffusion weighted imaging in this regard will depend on how robust the diffusion can be estimated.
In conclusion, ADC values vary significantly depending on which b-values are used. By choosing b ≥ 150 s/mm2 as the lower b-value the perfusion effects on ADC value are reduced. The upper choice should be b ≥ 700 s/mm2, this reduces the overestimation to less than 10%. No extra information is acquired if an intermediate point, like b = 400 s/mm2 is used.
Overall, many variables affect the ADC value; field strength, b-value, vendor, temperature and more. This study shows that by eliminating the contribution of perfusion the uncertainty of quantitative ADC values is significantly reduced.
Acknowledgements
This study has been supported by research grants from the Danish Cancer Society, Danish Council for Strategic Research, CIRRO – the Lundbeck Foundation Centre for Interventional Research in Radiation Oncology.
Declaration of interest: The authors report no conflicts of interest. The authors alone are responsible for the content and writing of the paper.
References
- Padhani AR, Liu G, Koh DM, Chenevert TL, Thoeny HC, Takahara T, . Diffusion-weighted magnetic resonance imaging as a cancer biomarker: Consensus and recommendations. Neoplasia 2009;11:102–25.
- Castillo M, Smith JK, Kwock L, Wilber K. Apparent diffusion coefficients in the evaluation of high-grade cerebral gliomas. AJNR Am J Neuroradiol 2001;22:60–4.
- Liu Y, Bai R, Sun H, Liu H, Wang D. Diffusion-weighted magnetic resonance imaging of uterine cervical cancer. J Comput Assist Tomogr 2009;33:858–62.
- Sehy JV, Ackerman JJH, Neil JJ. Evidence that both fast and slow water ADC components arise from intracellular space. Magn Reson Med 2002;48:765–70.
- Chen J, Zhang Y, Liang B, Yang Z. The utility of diffusion-weighted MR imaging in cervical cancer. Eur J Radiol 2009 (in press).
- Thoeny HC, Ross BD. Predicting and monitoring cancer treatment response with diffusion-weighted MRI. J Magn Reson Imaging 2010 (in press).
- Harry VN, Semple SI, Gilbert FJ, Parkin DE. Diffusion-weighted magnetic resonance imaging in the early detection of response to chemoradiation in cervical cancer. Gynecol Oncol 2008;111:213–20.
- Hamstra DA, Rehemtulla A, Ross BD. Diffusion magnetic resonance imaging: A biomarker for treatment response in oncology. J Clin Oncol 2007;25:4104–9.
- Le Bihan D, Breton E, Lallemand D, Grenier P, Cabanis E, Laval-Jeantet M. MR imaging of intravoxel incoherent motions: Application to diffusion and perfusion in neurologic disorders. Radiology 1986;161:401–7.
- Le Bihan D, Breton E, Lallemand D, Aubin ML, Vignaud J, Laval-Jeantet M. Separation of diffusion and perfusion in intravoxel incoherent motion MR imaging. Radiology 1988; 168:497–05.
- Henkelman RM. Does IVIM measure classical perfusion? Magn Reson Med 1990;16:470–5.
- Riches SF, Hawtin K, Charles-Edwards EM, de Souza NM. Diffusion-weighted imaging of the prostate and rectal wall: Comparison of biexponential and monoexponential modelled diffusion and associated perfusion coefficients. NMR Biomed 2009;22:318–25.
- Maier SE, Bogner P, Bajzik G, Mamata H, Mamata Y, Repa I, . Normal brain and brain tumor: Multicomponent apparent diffusion coefficient line scan imaging. Radiology 2001;219:842–9.
- Pecorelli S, Zigliani L, Odicino F. Revised FIGO staging for carcinoma of the cervix. Int J Gynaecol Obstet 2008; 105:107–8.
- McVeigh PZ, Syed AM, Milosevic M, Fyles A, Haider MA. Diffusion-weighted MRI in cervical cancer. Eur Radiol 2008;18:1058–64.
- Ho K, Lin G, Wang J, Lai C, Chang C, Yen T. Correlation of apparent diffusion coefficients measured by 3T diffusion-weighted MRI and suv from FDG PET/CT in primary cervical cancer. Eur J Nucl Med Mol Imaging 2009;36: 200–8.
- Sodickson DK, McKenzie CA. A generalized approach to parallel magnetic resonance imaging. Med Phys 2001;28: 1629–43.
- Sasaki M, Yamada K, Watanabe Y, Matsui M, Ida M, Fujiwara S, . Variability in absolute apparent diffusion coefficient values across different platforms may be substantial: A multivendor, multi-institutional comparison study. Radiology 2008;249:624–30.
- Kiselev VG, Il'yasov KA. Is the “biexponential diffusion” biexponential? Magn Reson Med 2007;57:464–9.
- Tanderup K, Nielsen SK, Nyvang G, Pedersen EM, Røhl L, Aagaard T, . From point A to the sculpted pear: MR image guidance significantly improves tumour dose and sparing of organs at risk in brachytherapy of cervical cancer. Radiother Oncol 2010;94:173–80.
- Pötter R, Dimopoulos J, Georg P, Lang S, Waldhäusl C, Wachter-Gerstner N, . Clinical impact of MRI assisted dose volume adaptation and dose escalation in brachytherapy of locally advanced cervix cancer. Radiother Oncol 2007;83:148–55.
- Lindegaard JC, Tanderup K, Nielsen SK, Haack S, Gelineck J. MRI-guided 3d optimization significantly improves DVH parameters of pulsed-dose-rate brachytherapy in locally advanced cervical cancer. Int J Radiat Oncol Biol Phys 2008; 71:756–64.
- Pötter R, Kirisits C, Fidarova EF, Dimopoulos J, Berger D, Tanderup K, . Present status and future of high-precision image guided adaptive brachytherapy for cervix carcinoma. Acta Oncol 2008;47:1325–36.
- Groenendaal G, Moman MR, Korporaal JG, van Diest PJ, van Vulpen M, Philippens MEP, . Validation of functional imaging with pathology for tumor delineation in the prostate. Radiother Oncol 2010;94:145–50.
- Tanderup K, Olsen DR, Grau C. Dose painting: Art or science? Radiother Oncol 2006;79:245–8.