Abstract
Background and purpose. T2 weighted MRI is recommended for image guided adaptive brachytherapy (IGABT) in cervical cancer. Diffusion weighted imaging (DWI) and the derived apparent diffusion coefficient (ADC) may add additional biological information on tumour cell density. The purpose of this study was to evaluate the distribution of the ADC within target volumes as recommended by GEC-ESTRO: Gross Tumour Volume at BT (GTVBT), High-Risk Clinical Tumour Volume (HR-CTV) and Intermediate-Risk Clinical Target Volume (IR-CTV) and to evaluate the change of diffusion between fractions of IGABT. Material and methods. Fifteen patients with locally advanced cervical cancer were examined by MRI before their first (BT1) and second (BT2) fraction of IGABT, resulting in a total of 30 MR examinations including both T2 weighted and DWI sequences. The Apparent Diffusion Coefficient (ADC) was calculated by use of three levels of b-values (0, 600, 1000 s/mm2). ADC maps were constructed and fused with the GEC ESTRO target contours. The mean ADC value within each target volume was calculated. Furthermore, volumes of low diffusion (ADClow) were defined based on an ADC threshold of 1.2 × 10⁻³ mm2/s, and overlap with target volumes was evaluated. Change of ADC level in target volumes and change of ADClow volume from BT1 to BT2 was also evaluated. Results. The mean ADC was significantly lower in GTVBT than in HR-CTV (p<0.001) which again was significantly lower than in IR-CTV (p<0.001). There was no significant change of the ADClow volume or ADC level within each target structure between BT1 and BT2 (p=0.242). All three GEC-ESTRO volumes contained volumes with low diffusion. The GTVBT contained 37.2% volume of low diffusion, HR-CTV 20.3% and IR-CTV 10.8%. Conclusion. With DWI we were able to find a significant difference in ADC-values for the three different GEC ESTRO targets. This supports the assumption that the target volumes used for dose prescription in IGABT contain tissues with different characteristics, with the tumour (GTVBT) being the volume with the lowest diffusion. No significant changes were found from BT1 to BT2 indicating that changes of ADC level and volumes are stable at the time of BT. Further studies are needed to evaluate the role of DWI in target contouring and dose prescription for IGABT.
The interest in using diffusion-weighted magnetic resonance imaging (DW-MRI) for tumour imaging is rapidly increasing since DW-MRI has the ability to discriminate tissue with high cellular density, such as tumours, from normal tissue. DW-MRI acquisition measures the mobility of water in tissue. In dense tissue with a low fraction of extracellular space water mobility is reduced compared to tissue with a large fraction of extracellular space. This has been validated in several studies by comparing DW-MRI images with histological findings [Citation1–4]. DW-MRI may therefore be a valuable diagnostic tool in tumour imaging. Based on the DW-MRI acquisition, the Apparent Diffusion Coefficient (ADC) can be calculated [Citation5]. The ADC value is a quantitative measure of the diffusion in tissue. Based on the ADC value functional diffusion maps (fDM) can be generated, which describe the probability that tissue is, indeed, tumour tissue [Citation6–8]. Furthermore, DW-MRI may be an effective modality for monitoring tumour response to therapy using the ADC value as a quantitative parameter [Citation9,Citation10] for early prediction of outcome [Citation11–14].
Today the standard treatment of locally advanced cervical cancer is external beam radiotherapy (EBRT), concomitant chemotherapy and brachytherapy (BT). Traditionally the use of BT in cervical cancer has widely been based on 2D x-ray dose planning and standard dose distributions. However, with this technique there are very limited possibilities to perform dose volume adaptation to a 4D target such as a regressing cervical cancer [Citation15]. A prerequisite for image guided adaptive BT (IGABT) has therefore been the development of an adaptive BT target concept that includes both space and time domains as exemplified by the GEC-ESTRO recommendations [Citation16]. The introduction of image based target assessment has significantly improved the possibilities to prescribe, optimise, and report doses in a reproducible way [Citation17–22].
T2 weighted (T2W) MRI is recommended by GEC-ESTRO [Citation23] for target delineation in image guided adaptive brachytherapy (IGABT). According to the GEC ESTRO guidelines the Gross Tumour Volume at the time of BT (GTVBT) together with the remaining cervix and suspicious grey zones forms the High Risk Clinical Target Volume (HR-CTV) which should be treated to a high dose level (i.e. 80–85 GyEQD2). The Intermediate Risk Clinical Tumour Volume (IR-CTV), which surrounds the HR-CTV, is defined based on the extension of the tumour at the time of diagnosis. A moderate dose level (usually 60 GyEQD2) is recommended in this region to address microscopic disease [Citation16].
The purpose of this study was 1) to evaluate the ADC levels in the BT target volumes: GTVBT, HR-CTV and IR-CTV, 2) to describe the distribution of low diffusion volumes and 3) to evaluate the change in size of low diffusion volumes and the change of ADC level for the GEC-ESTRO targets between fractions of BT.
Material and methods
At Aarhus University Hospital, Denmark, MRI based IGABT has been performed in locally advanced cervical cancer according to the GEC ESTRO guidelines since 2005. Diffusion weighted MRI has since 2008 been performed routinely at the time of BT, whenever possible for time constraints. In this study 15 patients were analysed according to the availability of DWI scans. One patient had FIGO stage IB2 tumour, 13 patients had stage IIB tumours and one patient had stage IIIB tumour. Four patients had adenosquamous carcinomas and 11 had squamous cell carcinomas. All patients received a combination of external beam radiotherapy (EBRT) and BT. Concomitant chemotherapy (weekly cisplatin, 40 mg/m2) was given to all patients with sufficient kidney and bone marrow function. Detailed description of target volumes and EBRT and BT technique has been previously described [Citation18]. EBRT was delivered by 4-field box or IMRT with a prescribed dose of 45–50 Gy to the CTV-E (elective target volume). Pulsed dose rate (PDR) BT using a MRI compatible tandem-ring applicator (GammaMed, Varian Medical Systems, Charlottesville, VA, USA) was initiated during the last one to two weeks of EBRT with 2 fractions of 15–17.5 Gy delivered in 15–20 pulses with a pulse dose of 0.5–1 Gy per hour. In patients with large tumours titanium needles were inserted to enable sufficient brachytherapy coverage (needles in seven patients at BT1 and in five patients at BT2). The two BT fractions were separated by 5–12 days always respecting a maximal overall treatment time of seven weeks including both EBRT and BT.
MR imaging
MRI examination was performed on a 1.5T Siemens Symphony MR scanner (Siemens, Erlangen, Germany) with the BT applicator in situ. MR examination of patients was performed prior to each BT fraction resulting in a total of 30 examinations (two per patient). The MR imaging protocol included a T1W para-transversal Turbo spin echo (TSE) sequence (TR = 710 ms, TE = 14 ms, 0.8 × 0.8 × 3.0 mm resolution), a T2W TSE para-transversal TSE sequence (TR = 4000 ms, TE = 112 ms, 1.1 × 1.1 × 4.0 mm resolution, 1.0 mm gap), both acquired perpendicular to the tandem, and a transversal diffusion weighted echo-planar imaging (EPI) based sequence (2.2 × 2.2 × 5.5 mm resolution) with three b-values (0, 600 and 1000 s/mm2). Target contouring (GTVBT, HR-CTV, IR-CTV) was performed based on the para-transversal T2W images as recommend by the GEC-ESTRO guidelines.
DWI analysis
Target contours (GTVBT, HR-CTV, IR-CTV) and images used for contouring (T2W images) were exported from the dose-planning system (Brachyvision, Varian) and read into an in-house software tool developed using Matlab (Mathworks, Natick, Massachusetts, USA) together with the DW-images. DW-images were reformatted to match the slice orientation of the tumour contours. Para-transversal T2W images were fused with the DW-images using DICOM-coordinates. To compensate for geometrical distortions due to the DWI sequence (EPI based) manual adaptations (translation) were performed in each slice to match the position of the brachytherapy applicator position. Calculation of ADC images using three b-values (0, 600 and 1000 s/mm2) was performed. ADC values below 0.1 × 10⁻³ mm2/s were not included in the calculations in order to reduce noise and voxels with zero signal. To analyse the part of the HR-CTV surrounding the GTVBT and similarly the part of the IR-CTV surrounding the HR-CTV, two new volumes were calculated: ΔHR-CTV = HR-CTV ÷ GTVBT and ΔIR-CTV = IR-CTV ÷ HR-CTV (). Mean ADC values for these three volumes (GTVBT, ΔHR-CTV and ΔIR-CTV) were calculated and compared using Students t-test.
Based on previous studies [Citation24,Citation25] volumes with low diffusion (ADClow) within the IR-CTV were identified using an ADC threshold value of 1.2 × 10⁻³ mm2/s (). The distribution of ADClow volumes in the three GEC-ESTRO volumes was evaluated, exemplified here for GTVBT: (ADClow, volume/GTVBTvolume) × 100 [%]. Students paired t-test was used to compare ADC-values for the different GEC-ESTRO volumes and testing differences between measurements at B1 and BT2.
Figure 1. ADC map fused with GEC-ESTRO contours (GTVBT, HR-CTV and IR-CTV). The contour ADClow was generated using an ADC threshold value 1.2 × 10⁻³ mm2/s and encompasses the volume with low diffusion.
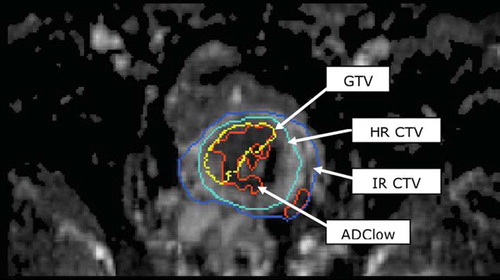
Figure 2. Definition of the calculated volumes ΔHR-CTV and ΔIR-CTV based on the GEC-ESTRO volumes HR-CTV and IR-CTV.
Results
An example of an ADC map fused with the GEC-ESTRO BT target-contours is shown in . The mean ADC values for the three volumes were: GTVBT = 1.35 ± 0.19 × 10⁻³ mm2/s, ΔHR-CTV = 1.58 ± 0.18 ×10⁻³ mm2/s and ΔIR-CTV = 1.84 ± 0.17 × 10⁻³ mm2/s. Mean ADC value for GTVBT was significantly lower than for the volume ΔHR-CTV (p<0.001), and mean ADC value of ΔHR-CTV was significantly lower than ΔIR-CTV (p < 0.001) (). shows the volume of the GEC ESTRO targets and the volume of ADClow for both BT1 and BT2. The change of ADClow volumes between BT1 and BT2 was not significant (p=0.151). The ADClow volume within the three volumes (GTVBT, ΔHR-CTV and ΔIR-CTV) was calculated (). The GTVBT had the largest percentage of ADClow volume, 36.87% (BT1) and 37.57% (BT2) (). No significant change of ADC level was found for the three volumes compared between BT1 and BT2 (). Susceptibility artefacts degraded DW-image quality in areas where air cavities in rectum and intestines were situated close to the cervix.
Figure 3. Plot of mean ADC for all DW-MRI acquisitions for the three volumes analysed: GTVBT, ΔHR-CTV and ΔIR-CTV. Filled circles represent values from BT1 and hollow circles values from BT2. The vertical line indicates the mean ADC value.
Table I. GEC-ESTRO and ADClow volumes (mean and sd) for BT1 and BT2 and the amount of ADClow volumes in the target volumes.
Table II. Change of ADC level in the three GEC-ESTRO volumes as a function of therapy.
Discussion
The contouring strategy described in the GEC-ESTRO guidelines defines GTVBT as the macroscopic tumour, HR-CTV as volume containing residual macroscopic tumour and IR-CTV as volume containing microscopic tumour. We found a significant difference of ADC-values for the three different volumes, with the lowest ADC-values found for the GTVBT and highest for the IR-CTV, supporting the assumption that the volumes contain a step-wise decrease in tumour cell density. The mean ADC found for the tumour (GTVBT) was higher than found in other studies evaluating cervical cancer, where values ranged from 0.757 × 10⁻³ mm2/s [Citation26] to 1.117 × 10⁻³ mm2/s [Citation24,Citation25,Citation27]. Although the ADC in theory should be comparable across studies the ADC depends strongly on the DWI sequence parameters such as choice of b-values [Citation28] diffusion gradient amplitude and the time between diffusion gradients (the diffusion time) [Citation29,Citation30]. The reason for the elevated ADC could also be explained by the time of imaging (BT1 and BT2) during the patients overall treatment plan. Before receiving BT the patients had undergone several weeks of external beam radiotherapy (EBRT) and chemotherapy which may influence the cellularity of the tumour tissue and thereby also the resulting ADC [Citation9,Citation10].
No significant change in ADC level and ADClow was found from BT1 to BT2, which is in agreement with other studies employing repetitive MRI, where in contrast to the first two to three weeks of EBRT, little change occurs during the final weeks of radiotherapy [Citation31,Citation32]. Studies where changes were detected compared the pre-treatment ADC to the ADC after at least two weeks of treatment [Citation9,Citation10]. We have focused on the final two weeks of the total treatment of six to seven weeks, and future analysis should be expanded to cover the entire treatment plan for the patient: from diagnostic MRI, during radiotherapy treatment and follow-up MRI after end of treatment.
The quantitative stability of the ADC signals at time of BT may suggest that the DWI could be used as a biological support in a more precise identification of grey zone boundaries on T2 weighted MRI. The GTVBT volume is the one with the largest percentage of ADClow volume although only approximately 1/3 of the GTV is identified as ADClow volume. But ADClow volumes are also present in both HR-CTV and IR-CTV. In further studies the choice of threshold and resulting ADClow volume in the three target volumes should be evaluated. It might also reveal if simple thresholding is a feasible solution. Some of the voxels identified as ADClow are erroneous ADC calculations due to transition between tissues – especially the transition of the cervix to the surrounding tissue. Our study reveals that a more complex detection of ADClow volumes than simple threshold is necessary since areas in diffusion images containing transitions from tissue to noise could wrongly be interpreted as areas of low diffusion. This motivates us to move to 3T MRI to improve the signal-to-noise ratio and resolution of the DW-images. This would decrease the problem of partial volume effects especially in the applicator-tissue transition. The use of 3T MRI with more power-full gradients will also allow us to acquire DW-images at more b-values. This would be preferred enabling a more reliable calculation of the ADC. Multiple b-values ranging from 50–2000 s/mm2 would allow us to evaluate other models for diffusion in tissue [Citation33,Citation34]. With more b-values available the diffusion images at lower b-values (< 150 s/mm2) could be excluded from the ADC calculation since the diffusion signal at low b-values is believed to be dominated by perfusion. The use of titanium needles generated severe susceptibility artefacts in the DW-images thus resulting in erroneous ADC values around the needles. These erroneous ADC values due to needles did not influence the mean ADC for the volume greatly. They resulted in signal voids in the ADC image and these voxels were not included in the calculations. At 3T MRI the susceptibility artefacts from metal is increased compared to 1.5T, which further sustain the need to exchange titanium with plastic needles.
Generally susceptibility artefact is a major problem for DW-MRI used for this application: applicator-tissue transition and air-tissue transition when rectum and/or intestines are close to the cervix. Susceptibility artefacts are due to local in-homogeneities and one approach for measurement and compensation of these is the use of B0 maps where resulting pixels shifts can be calculated. The feasibility of this approach should be evaluated in future studies. Another approach for correcting geometrical distortions could be the use of deformable registration [Citation35], although this would be challenging since anatomically structures are poorly visible at high b-values.
The use of functional imaging in dose-planning of radiotherapy has the potential to improve the individual dose plan and to monitor the result of treatment over time. Several modalities are suggested as candidates. PET/CT, dynamic contrast-enhanced MRI (DCE-MRI) and DW-MRI are all of potential. They describe different characteristics of tumour tissue (cellular activity, perfusion and density) and do therefore not necessary high-light the same volumes [Citation36]. The challenge will be to include the optimal combination of image modalities and sequences with an optimal timing with regard to treatment progression and tumour response.
In conclusion we found a significant difference of ADC-values for the three different GEC ESTRO targets. This supports the GEC ESTRO strategy of target volume contouring with volumes having different tumour tissue characteristics. No significant changes were found from BT1 to BT2 indicating that changes of ADC level and volumes are stable at the time of BT. Further studies are needed to evaluate the role of DWI for target contouring and dose prescription for IGABT.
Acknowledgements
Aarhus University Hospital has been supported by research grants from the Danish Cancer Society, Danish Council for Strategic Research and CIRRO – the Lundbeck Foundation Centre for Interventional Research in Radiation Oncology and the Danish National Research Foundation.
Declaration of interest: The authors report no conflicts of interest. The authors alone are responsible for the content and writing of the paper.
References
- Lyng H, Haraldseth O, Rofstad EK. Measurement of cell density and necrotic fraction in human melanoma xenografts by diffusion weighted magnetic resonance imaging. Magn Reson Med 2000;43:828–36.
- Gibbs P, Liney GP, Pickles MD, Zelhof B, Rodrigues G, Turnbull LW. Correlation of ADC and T2 measurements with cell density in prostate cancer at 3.0 Tesla. Invest Radiol 2009;44:572–6.
- Xu J, Humphrey PA, Kibel AS, Snyder AZ, Narra VR, Ackerman JJ, . Magnetic resonance diffusion characteristics of histologically defined prostate cancer in humans. Magn Reson Med 2009;61:842–50.
- Groenendaal G, Moman MR, Korporaal JG, van Diest PJ, van VM, Philippens ME, . Validation of functional imaging with pathology for tumor delineation in the prostate. Radiother Oncol 2010;94:145–50.
- Le BD. Molecular diffusion, tissue microdynamics and microstructure. NMR Biomed 1995;8:375–86.
- Hamstra DA, Galban CJ, Meyer CR, Johnson TD, Sundgren PC, Tsien C, . Functional diffusion map as an early imaging biomarker for high-grade glioma: Correlation with conventional radiologic response and overall survival. J Clin Oncol 2008;26:3387–94.
- Ellingson BM, Malkin MG, Rand SD, Connelly JM, Quinsey C, LaViolette PS, . Validation of functional diffusion maps (fDMs) as a biomarker for human glioma cellularity. J Magn Reson Imaging 2010;31:538–48.
- Korporaal JG, van den Berg CA, Groenendaal G, Moman MR, van VM, van der Heide UA. The use of probability maps to deal with the uncertainties in prostate cancer delineation. Radiother Oncol 2010;94:168–72.
- Harry VN, Semple SI, Gilbert FJ, Parkin DE. Diffusion-weighted magnetic resonance imaging in the early detection of response to chemoradiation in cervical cancer. Gynecol Oncol 2008;111:213–20.
- Hamstra DA, Rehemtulla A, Ross BD. Diffusion magnetic resonance imaging: A biomarker for treatment response in oncology. J Clin Oncol 2007;25:4104–9.
- Nilsen L, Fangberget A, Geier O, Olsen DR, Seierstad T. Diffusion-weighted magnetic resonance imaging for pretreatment prediction and monitoring of treatment response of patients with locally advanced breast cancer undergoing neoadjuvant chemotherapy. Acta Oncol 2010;49:354–60.
- Song I, Kim CK, Park BK, Park W. Assessment of response to radiotherapy for prostate cancer: Value of diffusion-weighted MRI at 3T. AJR Am J Roentgenol 2010;194: W477–W482.
- Padhani AR, Khan AA. Diffusion-weighted (DW) and dynamic contrast-enhanced (DCE) magnetic resonance imaging (MRI) for monitoring anticancer therapy. Target Oncol 2010;5:39–52.
- Vandecaveye V, Dirix P, De KF, Op de BK, Vander PV, Roebben I, . Predictive value of diffusion-weighted magnetic resonance imaging during chemoradiotherapy for head and neck squamous cell carcinoma. Eur Radiol 2010 (in press).
- Tanderup K, Nielsen SK, Nyvang GB, Pedersen EM, Rohl L, Aagaard T, . From point A to the sculpted pear: MR image guidance significantly improves tumour dose and sparing of organs at risk in brachytherapy of cervical cancer. Radiother Oncol 2010;94:173–80.
- Haie-Meder C, Pötter R, Van LE, Briot E, De BM, Dimopoulos J, . Recommendations from Gynaecological (GYN) GEC-ESTRO Working Group (I): Concepts and terms in 3D image based 3D treatment planning in cervix cancer brachytherapy with emphasis on MRI assessment of GTV and CTV. Radiother Oncol 2005;74:235–45.
- De Brabandere M, Mousa AG, Nulens A, Swinnen A, Van LE. Potential of dose optimisation in MRI-based PDR brachytherapy of cervix carcinoma. Radiother Oncol 2008;88:217–26.
- Lindegaard JC, Tanderup K, Nielsen SK, Haack S, Gelineck J. MRI-guided 3D optimization significantly improves DVH parameters of pulsed-dose-rate brachytherapy in locally advanced cervical cancer. Int J Radiat Oncol Biol Phys 2008;71:756–64.
- Kirisits C, Pötter R, Lang S, Dimopoulos J, Wachter-Gerstner N, Georg D. Dose and volume parameters for MRI-based treatment planning in intracavitary brachytherapy for cervical cancer. Int J Radiat Oncol Biol Phys 2005;62:901–11.
- Assenholt MS, Petersen JB, Nielsen SK, Lindegaard JC, Tanderup K. A dose planning study on applicator guided stereotactic IMRT boost in combination with 3D MRI based brachytherapy in locally advanced cervical cancer. Acta Oncol 2008;47:1337–43.
- Dimopoulos JC, Potter R, Lang S, Fidarova E, Georg P, Dorr W, . Dose-effect relationship for local control of cervical cancer by magnetic resonance image-guided brachytherapy. Radiother Oncol 2009;93:311–5.
- Pötter R, Kirisits C, Fidarova EF, Dimopoulos JC, Berger D, Tanderup K, . Present status and future of high-precision image guided adaptive brachytherapy for cervix carcinoma. Acta Oncol 2008;47:1325–36.
- Pötter R, Haie-Meder C, Van LE, Barillot I, De BM, Dimopoulos J, . Recommendations from gynaecological (GYN) GEC ESTRO working group (II): Concepts and terms in 3D image-based treatment planning in cervix cancer brachytherapy-3D dose volume parameters and aspects of 3D image-based anatomy, radiation physics, radiobiology. Radiother Oncol 2006;78:67–77.
- Naganawa S, Sato C, Kumada H, Ishigaki T, Miura S, Takizawa O. Apparent diffusion coefficient in cervical cancer of the uterus: Comparison with the normal uterine cervix. Eur Radiol 2005;15:71–8.
- Payne GS, Schmidt M, Morgan VA, Giles S, Bridges J, Ind T, . Evaluation of magnetic resonance diffusion and spectroscopy measurements as predictive biomarkers in stage 1 cervical cancer. Gynecol Oncol 2010;116:246–52.
- Charles-Edwards EM, Messiou C, Morgan VA, De Silva SS, McWhinney NA, Katesmark M, . Diffusion-weighted imaging in cervical cancer with an endovaginal technique: Potential value for improving tumor detection in stage Ia and Ib1 disease. Radiology 2008;249:541–50.
- McVeigh PZ, Syed AM, Milosevic M, Fyles A, Haider MA. Diffusion-weighted MRI in cervical cancer. Eur Radiol 2008;18:1058–64.
- Kallehauge JF, Tanderup K, Haack S, Nielsen T, Fokdal L, Lindegaard JC, . Apparent diffusion coefficient (ADC) as a quantitative parameter in diffusion weighted MR imaging in gynecologic cancer: Dependence on b-values used. Acta Oncol 2010 (in press).
- Sasaki M, Yamada K, Watanabe Y, Matsui M, Ida M, Fujiwara S, . Variability in absolute apparent diffusion coefficient values across different platforms may be substantial: A multivendor, multi-institutional comparison study. Radiology 2008;249:624–30.
- Ogura A, Hayakawa K, Miyati T, Maeda F. Imaging parameter effects in apparent diffusion coefficient determination of magnetic resonance imaging. Eur J Radiol 2009.
- Dimopoulos JC, Schirl G, Baldinger A, Helbich TH, Potter R. MRI assessment of cervical cancer for adaptive radiotherapy. Strahlenther Onkol 2009;185:282–7.
- Mayr NA, Wang JZ, Zhang D, Grecula JC, Lo SS, Jaroura D, . Longitudinal changes in tumor perfusion pattern during the radiation therapy course and its clinical impact in cervical cancer. Int J Radiat Oncol Biol Phys 2010;77:502–8.
- Jensen JH, Helpern JA, Ramani A, Lu H, Kaczynski K. Diffusional kurtosis imaging: The quantification of non-gaussian water diffusion by means of magnetic resonance imaging. Magn Reson Med 2005;53:1432–40.
- Yablonskiy DA, Bretthorst GL, Ackerman JJ. Statistical model for diffusion attenuated MR signal. Magn Reson Med 2003;50:664–9.
- Ostergaard NK, de Senneville BD, Elstrom UV, Tanderup K, Sorensen TS. Acceleration and validation of optical flow based deformable registration for image-guided radiotherapy. Acta Oncol 2008;47:1286–93.
- Groenendaal G, van den Berg CA, Korporaal JG, Philippens ME, Luijten PR, van VM, . Simultaneous MRI diffusion and perfusion imaging for tumor delineation in prostate cancer patients. Radiother Oncol 2010;95:185–90.