Abstract
Background. Successful deformable image registration is an essential component of both dose accumulation and plan adaptation in radiotherapy. The aim of this study was to evaluate the performance of a deformable image registration application for propagation of contours using repeat CT scans of the pelvis, a region where considerable deformations are expected. Material and methods. The study involved four prostate cancer patients, each with 9–11 repeat CT scans. An oncologist contoured bladder, rectum, clinical target volume of pelvic lymph nodes (CTV-ln) and prostate (CTV-p) in all CT scans. The reference CT was retrospectively registered to the repeat CT scans with both rigid and deformable registration using a recently released commercial clinical software application. Two different diffusion-based ‘demons’ deformable registration algorithms were applied, differing in the amount of deformations being allowed, with algorithm A being more generous than algorithm B. The evaluation of the propagated structures included both quantitative measures and qualitative scoring. Results. We found the differences between the algorithms to be most evident for bladder and rectum. An increase in mean Dice similarity coefficient relative the rigid registrations of 12% and 13% was obtained with algorithm A for bladder and rectum, compared to 2% with algorithm B. For bladder the mean sensitivity and positive predictive value was 0.92 and 0.87 with algorithm A and 0.82 and 0.83 with algorithm B. Corresponding values for rectum was 0.81 and 0.76 with algorithm A and 0.75 and 0.69 with algorithm B. This translated into 57% and 26% passing the clinical evaluation for bladder and rectum, with algorithm A, compared to 17% and 14% with algorithm B. For CTV-ln and CTV-p both algorithms performed well by all measures, e.g. with 86% of the target structures passing the clinical evaluation. Conclusions. Deformable image registration improved contour propagation in the pelvis for all organs investigated. Differences in the performance of the algorithms were seen which became more pronounced for the highly deformable organs of bladder and rectum.
The implementation of image-guided radiotherapy (IGRT) has lead to increased knowledge about the internal patient anatomy variations occurring during radiotherapy (RT) [Citation1]. In IGRT the main purpose is to measure and correct for target variations to ensure a close accordance to the treatment plan [Citation2]. The introduction of on-line volumetric imaging of the patient, e.g. cone-beam computed tomography (CBCT) and mega-voltage CT (MVCT), before or during treatment has allowed for correction of internal target positional changes, but these methods do not exploit all anatomical information available in the images [Citation3,Citation4]. To fully account for the often complex changes in patient anatomy, ultimately in an on-line process, accurate and rapid methods for both image segmentation and deformable image registration (DIR) are the key components [Citation5–7]. Methods for auto-segmentation have been developed for many organs, but still have limited accuracy for organs with less defined boundaries on typical morphological images [Citation7,Citation8]. Besides, auto-segmentation on its own does not allow for tracking of each organ element / image voxel since this also requires registration to deduce the correspondence between images [Citation5,Citation9]. Successful DIR on the other hand would enable dose tracking through establishing displacement fields, and could – when combined with the relevant treatment planning information – enable for plans to be updated and adapted according to the observed anatomy changes, i.e. so-called adaptive RT planning [Citation3,Citation10–12].
Several studies have shown the benefit of dose-escalation for prostate cancer [Citation13,Citation14]. However, the magnitude of the dose-escalation that can be permitted has been found to be limited by the dose to organs at risk, primarily the rectum [Citation15,Citation16]. Dose-escalation to the normal tissue morbidity limit relies on detailed knowledge of the dose response of the organ, which in turn depends on accurate methods for dose accumulation, where reliable and valid DIR is the essential element [Citation5,Citation17]. Furthermore, studies have reported variations in the volumes of rectum and bladder along with motion of the prostate [Citation4,Citation7,Citation18–22]. In addition, the new treatment techniques in RT have offered abilities to sculpt the dose leading to an increase in delivery precision [Citation22,Citation23]. Together with the observed variations in anatomy, these are all indications for more individualized treatments and adaptive RT in prostate cancer [Citation10,Citation17]. However, adaptive planning is not ready for clinical implementation yet, primarily due to the lack of reliability in DIR of CT images [Citation24]. Measures of the accuracy of DIR algorithms could involve imaging a phantom with known deformations and/or by mathematically introducing known deformations of the image [Citation5]. Although quantitative, the difficulty with both these approaches is to imitate clinically realistic deformations [Citation5]. The aim of this study was therefore to evaluate the performance of a DIR application for propagation of contours using repeat CT scans of patients previously treated with pelvic RT, a region where considerable deformations are expected.
Material and methods
Patient data
Four prostate cancer patients treated with pelvic intensity-modulated RT (IMRT) at Haukeland University Hospital in 2007 were included in the study. Each patient had undergone a planning CT and additional eight to ten repeat CT scans evenly distributed throughout their treatment course. Three of the four patients were CT scanned for planning with contrast in the bladder. All CT scans were acquired in supine position covering the pelvis up to L4, with a slice thickness of 2–3 mm and an image resolution of 512 × 512 pixels. The same patient fixation devices were used for the planning and the repeat CT scans.
Definition of targets and organs at risk
For the purpose of the present study, a radiation oncologist contoured the pelvic lymph node and seminal vesicle clinical target volume (CTV-ln), the prostate (CTV-p), the bladder and the rectum in all CT scans of the four patients using the Eclipse treatment planning system (Varian Medical Systems, Palo Alto, CA, USA). The two CTVs were outlined as separate volumes. The CTV-ln included the distal part of the common iliac nodes at the interspace L5/S1 and caudally, the external iliac nodes to the top of femoral heads, the internal iliac nodes as well as obturator nodes to the top of the pubic symphysis or proximal prostate. Presacral nodes were not included. The lymph nodes were delineated by adding a margin of 5–10 mm to the vessels, depending on anatomy and visible lymph nodes, excluding bone and bladder. Seminal vesicles were included in the CTV-ln. Rectum was defined to encompass the volume of the rectum including the wall and its contents from the recto-sigmoid flexure cranially including the anal canal in the caudal direction. Similarly, the bladder volume included both the organ wall and its contents.
Image registrations
All registrations were conducted in the Multimodality Image Registration and Segmentation Application (Aria with MIRS; Varian Medical Systems, Palo Alto, CA, USA). Since the aim of this study was to perform a clinical validation of contours propagated using the different deformation algorithms, all registrations were made retrospectively in a systematic manner and as close as possible to a clinical setting. In total 35 registrations, resulting from the number of repeat CT scans and patients, were performed for algorithm A as well as for B.
Rigid image registration. Prior to the deformable registration, a rigid registration was performed to make the DIR faster and limit any impact from large deformations [Citation3]. The rigid registration of the two images was based on bone (200–3000 HU) with a volume of interest (VOI) covering the entire CT scans and the results were visually inspected. Although the performance of the DIR was influenced by the result from the rigid registration we considered rigid translations only, for the situation to be as close as possible to a clinical setting.
Deformable image registration. The DIR application provided two different deformation algorithms; algorithm A with predefined settings from the manufacturer, and algorithm B where the user was given a possibility to choose an anatomical region for the matching, in our study the pelvis. Both algorithms A and B were based on a ‘demons’ algorithm [Citation5,Citation25,Citation26]. A detailed description of the algorithm was provided by Thirion, but in short it is based on a diffusion model, letting one image diffuse through the interfaces of the other image [Citation25]. The image to which the reference image is registered will hereafter be denoted the static image. The diffusion process is steered by demons, hence the name, which are local forces guiding the voxels of the image to be registered to the static image. The ratio of the external to internal force strength is an important parameter that determines the extremity of the deformations [Citation5,Citation26]. The external forces search for similar features in the images to register and the internal forces regulate the resulting transformation [Citation26]. The original demons algorithm [Citation25] has been modified in algorithms A and B by for example adding interaction forces and varying the resolution of the images during the optimization process to increase accuracy and computational speed [Citation5,Citation25]. The main difference between algorithm A and B was the amount of regularization for the internal forces. Algorithm B had stronger regularization corresponding to a higher weight for the internal forces as compared to algorithm A. Another difference was that algorithm A was using a symmetric demons algorithm as compared to algorithm B. In this study, the transformation resulting from the DIR was applied to the contours for propagation [Citation5]. Each DIR was made with a VOI encompassing the contours as delineated in the reference image of rectum, the CTV-ln and bladder in the superior-inferior, lateral and anterior direction, respectively. For those patients with contrast in the bladder during the planning CT, image registrations were made with the first of the repeat scans as reference image. This was done to avoid the influence of the contrast agent on the DIR due to altered attenuation and any irregularities in bladder volume.
Evaluation of contour propagation
The contours derived by propagation from the planning contours for CTV-ln, CTV-p, bladder and rectum were evaluated quantitatively for both algorithms and all registrations relative to the manual delineations in the static images. The quantitative evaluation, intended to disclose different capacities of the DIR algorithms included calculation of the Dice similarity coefficient (DSC) as well as the sensitivity and positive predictive value (PPV). A qualitative evaluation of the precision of the contour propagation was performed by a radiation oncologist visually examining all DIR propagated contours.
For all registrations DSC was calculated as the quotient of the overlapping region of the two contours over their mean value [Citation27]:
where VREF is the volume enclosed by the deformed contour in the reference image. VSTATIC is the contour as delineated by the radiation oncologist in every repeat CT scan, i.e. the static image. To deduce any volumetric dependencies of the DIR, DSC was plotted as a function of relative volume of the static and the reference image, where a strong dependency on volume would result in high DSC for a relative volume of one followed by a decrease in DSC for larger and smaller relative volumes.
The sensitivity was defined as:
and the PPV as:
where TP, FN and FP are true positive, false negative and false positive volumes, respectively. Using the same notations as in (1), TP is the intersection of VREF and VSTATIC. The sum of TP and FN equals VSTATIC and the sum of TP and FP equals VREF.
The clinical evaluation was based on qualitative visual assessment and scoring of the propagated contours independently for algorithm A and B. To avoid bias, all scoring was made by one radiation oncologist who was not involved in the manual delineation procedure. The visual assessment was made slice-by-slice and graded based on the number of slices that had unacceptable deviations in shape and/or distance for the propagated contours as compared to the anatomy of the static image. The definition of the grading system used for review of the propagated contours is shown in . The clinical scoring was evaluated as a function of DSC to explore the relationship between these two parameters.
Table I. The criteria for each propagated contour in the clinical scoring, showing the number of slices that needed to be unapproved for each grade.
Results
The rigid co-registration aligned the bones in the two images well for most parts, with the largest deviations seen for the femoral heads. displays the average DSC for all patients acquired by accounting for translations in the rigid co-alignment.
Table II. Patient average DSC including range in brackets for all registrations and contours.
Deformable image registration
Quantitative evaluation. DIR improved the DSC relative to the rigid registration for the considered contours in 87% and 81% of the registrations with algorithm A and B, respectively. Average DSC for all patients and contours are presented in . The largest increase in DSC relative the rigid registrations was seen with algorithm A for bladder and rectum, with an average increase of 12% and 13%, respectively as compared to a 2% increase with algorithm B. For CTV-p the average relative increase in DSC was 6% and 4%, for algorithms A and B, respectively. The smallest change in DSC was seen for CTV-ln, with an average relative increase of 1% with both DIR algorithms. However, CTV-ln was only partly covered in the VOI used for the deformation. The difference in performance between the algorithms is further illustrated in . For the organs undergoing the largest deformation, i.e. the bladder and rectum, algorithm B increased the DSC slightly but the results were tightly connected to the outcome of the rigid registration. Algorithm A was less dependent on the rigid registration and resulted in a larger improvement, a pattern that was seen in all patients. Algorithm B had the largest spread in DSC for all organs ( and ). This was the least pronounced for CTV-ln, where both algorithms resulted in a DSC larger than 0.80 and with very similar mean values. For CTV-p algorithm B resulted in both the highest, 0.91 and the lowest DSC with two registrations for patient 4 having a DSC of 0.71 and 0.66. The features of the two DIR algorithms were more evident when considering the bladder and rectum, organs where more deformations are occurring (, lower part). For these organs a clear shift was found, with all DSCs for algorithm B inferior to those obtained with algorithm A. For the bladder the difference between the algorithms seemed to increase when a volume expansion of more than 1.40 was seen. Such a volume dependency was not seen for the rectum.
Figure 1. DSC as a function of static image (CTnrX) to which the reference image (CTnr1) was registered for patient 3. The colors indicate organ contours; gray for bladder and black for rectum. Type of line indicate registration; dashed for rigid, dotted for algorithm A and solid for algorithm B.
Figure 2. DSC as a function of relative volume enclosed by the contour in the static and reference image including patient average DSC marked with solid lines for illustration. The colors indicate algorithm; black for algorithm A and gray for algorithm B. Different markers represent different patients as described in the legend.
The largest improvements in both sensitivity and PPV as compared to the rigid registration were seen for algorithm A. All registration methods, including the rigid registration, resulted in high average sensitivities (0.87–0.88) and PPVs (0.87–0.88) for CTV-ln. For CTV-p, the sensitivity and PPV only reached 0.80 and 0.83, respectively, with the rigid registration. With DIR these values increased; algorithm A resulted in a 6% improvement in sensitivity and 5% in PPV, whereas algorithm B resulted in a 3% improvement for both parameters. The differences between the algorithms became even more pronounced for the bladder and rectum. For the rectum a 12% and 13% increase in average sensitivity and PPV, respectively was obtained with algorithm A, with corresponding improvements of 4% and 2% using algorithm B. DIR of the bladder with algorithm A improved both sensitivity and PPV with 15% and 7% respectively as compared to rigid registration. Again, the improvements with algorithm B were modest (3% and 1%, respectively). Exploring the relations between sensitivity and PPV for the two algorithms (), a noticeable difference was found for the bladder. Even for registrations with PPV above 0.9, algorithm A still maintained a sensitivity above 0.79 whereas 34% of the registrations were below or equal to this value of sensitivity with algorithm B. For the rectum the registrations resulting in higher sensitivity corresponded to lower values of PPV for both algorithms, the lowest values in both parameters seen for algorithm B.
Figure 3. Sensitivity as a function of PPV for all DIR propagated contours. The colors indicate algorithm; black for algorithm A and gray for algorithm B. Different markers represent different patients as described in the legend.
Qualitative evaluation. For both DIR algorithms, the majority of the CTV-ln and CTV-p contours were judged as good or acceptable (). The propagated contours for CTV-ln had most registrations considered good, 71% and 51% for algorithm A and B, respectively. Only registrations with algorithm B resulted in CTV-ln and CTV-p contours considered poor. For CTV-p a greater proportion of the propagated contours were judged as good as compared to acceptable using algorithm B. Algorithm A displayed the opposite with 46% considered as good and 54% as acceptable. The contour propagation of the bladder gave the most widespread results. For example, with algorithm A, 34% and 23% were considered good and acceptable whereas 3% and 40% were considered in need of adjustments and poor. For rectum the majority of the propagated contours were considered poor for both algorithms; 66% and 83% of the registrations with A and B, respectively. As seen for the rectum in and illustrated in , only patient 3 had the majority (all but three) of the registrations regarded as acceptable or better, which was obtained using algorithm A. Hence, as compared to algorithm B registrations with algorithm A resulted in a greater proportion of these contours being classified as good or acceptable. Evaluating the relationship between patient average DSC and clinical scoring (), it was found for both algorithms that the mean DSC for rectum increased with better scoring. For the bladder such a relation was only seen for algorithm A, yet both algorithms had considerable lower average DSC when deemed poor as a clinical score. A considerably lower mean DSC was also obtained for CTV-p for the lowest clinical score using algorithm B. Since algorithm A had no scores deemed in need of adjustments or worse the corresponding mean DSC could not be evaluated. For CTV-ln the variations of mean DSC were modest for all levels of scoring for both algorithms, although a slight increase was seen in DSC with worse scoring using algorithm A.
Figure 4. Clinical scoring for all propagated contours. The colors indicate algorithm; black for algorithm A and gray for algorithm B. Different patterns in the bars represent different patients as described in the legend.
Figure 5. Examples of DIR propagated contours seen on the static image for: CTV-p and rectum (to the left) and for CTV-ln, rectum and bladder (to the right). Colors of the contours are for rectum: darkgreen for the static image contour, green for algorithm A, light green for algorithm B, for CTV-p and CTV-ln: red contours for the static image, magenta for algorithm A and pink for algorithm B and for the bladder: orange contours for the static image, yellow for algorithm A and white for algorithm B.
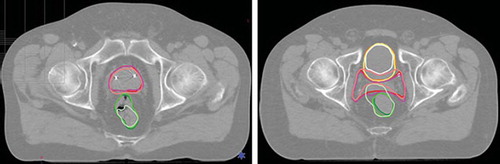
Table III. The relationship between the clinical scoring and DSC for all propagated contours with the two algorithms.
Discussion
Reliable and valid DIR is an essential component in both adaptive treatment planning and dose accumulation in RT [Citation5,Citation15]. In this study we have therefore used repeat CT scans, retrospectively registered using both rigid and deformable registration and included both numeric data as well as clinical scoring in the evaluation of the performance of a recently released commercial DIR software application.
Our investigations found the differences between the algorithms used for DIR to be most evident for the bladder and rectum. These structures are challenging for DIR and contour propagation since the algorithm must be able to perform large deformations of for example the bladder while maintaining an accurate contour of the less deformable prostate located nearby [Citation9,Citation17]. Additionally, the algorithm should be able to handle image voxels without true correspondence in the image sets, e.g. air-pockets in rectum [Citation9]. Algorithm A handled an expansion of the bladder well, while a reduction of the bladder volume as compared to the reference image lead to a decrease in both DSC () and PPV as well as a lower scoring in the qualitative evaluation. Although a large spread in the evaluation scores, contour propagation of the bladder using algorithm B seemed to have an even stronger volumetric dependency. The trend was supported by the data presented in and where patient 1 and 2, with the largest decrease in relative bladder volume, had the lowest PPV. Furthermore, patient 2 was the patient with the most registrations considered poor in the clinical scoring. For large volumes (relative volumes > 1.4) the poor performance of the DIR was demonstrated for patient 4 (), leading to low sensitivity and a poor clinical scoring. An important implication of the inability for algorithm B to handle an expansion of the bladder was the corresponding impact on the two CTVs, (, to the right). For CTV-p this resulted in the outliers seen in . Regarding, CTV-ln it resulted in lower PPV as well as registrations rejected in the clinical evaluation, however not noticeable in evaluation based on DSC. Although the contours of rectum showed less variation in relative volume, DIR of this organ gave inferior results compared to the ones obtained from propagation of the bladder contours. During the clinical scoring it was noted that algorithm B had a greater challenge with air-cavities which resulted in a larger number of slices graded as poor, as compared to algorithm A.
Our increase in mean DSC for bladder and rectum of 12% and 13% as compared to rigid registration is similar to the findings of Godley et al., also using a demons algorithm, with a 10% and 11% increase for bladder and rectum, respectively [Citation3]. Besides the agreement in terms of absolute DSC, they also found the highest average DSC for the bladder [Citation3]. However, for the prostate they found a decrease in mean DSC with DIR as compared to the rigid co-alignment, obtaining a DSC of 0.73 as compared to our value of 0.85 and 0.84 with algorithm A and B, respectively [Citation3]. This was explained by the inability of the algorithm to distinguish the bladder from the prostate due to similar image intensities [Citation3]. Consequently, they proposed a method of masking the pre-delineated contours of bladder and rectum with uniform HU-numbers to aid the algorithm [Citation3]. Their data obtained with this approach gave an increase in average DSC of 40% for the rectum and 18% for the bladder as well as an increase in mean DSC of the prostate, as compared to the rigid co-alignment [Citation3]. An earlier study by Gao et al. focused on the rectum in CT images, where they by auto-segmentation detected air-cavities to modify the image intensities before using a diffusion-based algorithm for DIR and obtained a mean sensitivity of 0.71 [Citation9]. This is inferior to our findings of DIR with algorithm A but comparable to algorithm B and the rigid co-alignment. However, every patient in their study represented a worst-case scenario of rectal filling and, comparing DIR with and without segmentation gave an increase in mean sensitivity of 39% [Citation9].
The masking approach might be particularly useful using DIR on CBCT- or MVCT-images, which have inferior image quality as compared to conventional CT [Citation23,Citation28]. This has partly been shown for MVCT by Yang et al. [Citation28]. By masking and manipulating the image intensities of the bladder, rectum and prostate before applying an optical flow DIR algorithm they obtained a mean DSC superior to ours for both prostate and bladder but comparable for rectum using algorithm A [Citation28]. Their results are impressing but since the information about the true contour in the static image is not known beforehand this method relies on segmentation before being suitable for systematic use [Citation3]. It would still have been interesting to investigate whether a similar approach would have improved the results also for the algorithms investigated in this study, in particular with the motivation that an improvement in DIR of rectum might bring an improvement in DSC for the prostate as well [Citation3,Citation28].
In this study the VOI used for DIR was based on the extension of the rectum as delineated in the reference CT scan. The main reason for such a definition of the VOI was that information about the contours in the static image is usually unknown and we wanted to make all registration systematic. As a result, only the caudal part of the CTV-ln was included in the VOI. It should be noted that we tested varying VOIs including the entire CTV-ln and it was found that both algorithms had slight trouble discerning intestine and air from lymph nodes. With a perfect performing DIR the size of the VOI would not have any impact on the result as compared to the rigid registration for organs with limited deformations. Unlike the prostate, the lymph node target is considered stable against intra-fractional motion [Citation29] and was assumed free from significant deformations. Our results support this assumption, with rigid co-alignment being sufficient and resulting in high values for the complete target in the quantitative evaluation. In fact, only the seminal vesicle part of the CTV-ln target, which was actually included in the VOI, was considered less than good in the qualitative evaluation (see for illustration). The impact on our DIR results of the method of rigid co-alignment is assumed to be limited; however, it might have improved the results from algorithm B since this algorithm followed the rigid registration closely ().
A larger uncertainty related to the evaluation of the performance of a DIR for contour propagation is obviously the accuracy of the initial contours. Although all contours were delineated systematically and by the same radiation oncologist in both the planning and the repeat CT scans, variations in contouring for pelvic RT have been shown [Citation30]. All delineations made in the repeat CT scans were considered as ‘ground truth’ and used for calculation of all parameters in the quantitative evaluation. Ultimately, the uncertainty in contouring represents the level of accuracy (or better) to strive for in a clinically applicable DIR application. Similarly, variations in contouring are an uncertainty in the clinical evaluation of all propagated structures as well. This evaluation can be considered as the most relevant when determining whether or not a DIR application is useful for propagation of contours in the clinic and it was made by another radiation oncologist, to avoid bias as much as possible.
Many authors have acknowledged the difficulties in validating the result from DIR quantitatively [Citation3,Citation5,Citation9,Citation28]. In an attempt to correlate the clinical scoring to the commonly used similarity measure DSC we did notice that the mean DSC for being considered poor was considerably lower than the mean DSC for being judged acceptable for the contours completely covered by the ROI used for DIR (). However, it was still not possible to relate a certain value of DSC to a clinical score due to the large spread in the values between the algorithms and the limited number of registrations and patients in the study. Obviously, as we only investigated four patients, these might not represent the variety of internal motion patterns seen in pelvic patients [Citation4,Citation7,Citation18–22]. Still the 35 registrations should give an indication of the performance of the DIR application and in a larger group of pelvic patients with repeat CBCT scans throughout their treatment we intend to investigate the application further. Since successful propagation of contours is the first step towards adaptive RT the application needs to be tested on such images to deduce its true potential in the clinic. Furthermore, in addition to make adaptive RT possible it is important to define the thresholds of anatomy changes that call for adaptations. This will be investigated in a future re-optimization study.
In conclusion, based on both a quantitative evaluation including sensitivity and PPV besides DSC and a qualitative scoring of an oncologist we found DIR to improve contour propagation in the pelvis for all organs investigated. Furthermore, algorithm A was found to perform superior to algorithm B for CTV-ln, CTV-p, bladder and rectum, although neither performed adequately for contour propagation of the rectum.
Acknowledgements
This work has been supported by research grants from CIRRO -The Lundbeck Foundation Center for Interventional Research in Radiation Oncology, the Danish Cancer Society, FSS (The Danish Council for Independent Research) as well as The Danish Council for Strategic Research. Liv Bolstad Hysing, University of Bergen / Haukeland University Hospital in Bergen, Norway, is thankfully acknowledged for providing the CT data sets used in this study. The DIR application was kindly provided by Varian Medical Systems (Palo Alto, CA, USA).
Declaration of interest: The authors report no conflicts of interest. The authors alone are responsible for the content and writing of the paper.
References
- Grau C, Muren L.P, Høyer M, Lindegaard J, Overgaard J. Image-guided adaptive radiotherapy – integration of biology and technology to improve clinical outcome. Acta Oncol 2008;47:1182–5.
- Greco C, Ling C. Broadening the scope of Image-Guided Radiotherapy (IGRT). Acta Oncol 2008;47:1193–200.
- Godley A, Ahunbay E, Peng C, Li A. Automated registration of large deformations for adaptive radiation therapy of prostate cancer. Med Phys 2009;36:1433–42.
- Chen L, Paskalev K, Xu X, Zhu J, Wang L, Price RA, . Rectal dose variation during the course of image-guided radiation therapy of prostate cancer. Radiother Oncol 2010;95:198–202.
- Wang H, Dong L, O’Daniel J, Mohan R, Garden A, Ang KK, . Validation of an accelerated 'demons’ algorithm for deformable image registration in radiation therapy. Phys Med Biol 2005;50:2887–905.
- Schaly B, Baumann G.S, Battista J.J, van Dyk J. Validation of contour-driven thin-plate splines for tracking fraction-to-fraction changes in anatomy and radiation therapy dose mapping. Phys Med Biol 2005;50:459–75.
- Huyskens DP, Maingon P, Vanuytsel L, Remouchamps V, Roques T, Dubray B, . A qualitative and a quantitative analysis of an auto-segmentation module for prostate cancer. Radiother Oncol 2009;90:337–45.
- Zhou J, Kim S, Jabbour A, Goyal S, Haffty B, Chen T, . A 3D global-to-local deformable mesh model based registration and anatomy-constrained segmentation method for image guided prostate radiotherapy, Med Phys 2010;37:1298–308.
- Gao S, Zhang L, Wang H, de Crevoisier R, Kuban DD, Mohan R, . A deformable image registration method to handle distended rectums in prostate cancer radiotherapy. Med Phys 2006;33:3304–12.
- Yan D, Vicini F, Wong J, Martinez A. Adaptive radiation therapy. Phys Med Biol 1997;42:123–32.
- Brock KK, McShan DL, Ten Haken RK, Hollister SJ, Dawson LA, Balter LA. Inclusion of organ deformation in dose calculations. Med Phys 2003;30:290–5.
- Schaly B, Kempe JA, Bauman GS, Battista JJ, van Dyk J. Tracking the dose distribution in radiation therapy by accounting for variable anatomy. Phys Med Biol 2004;49: 791–805.
- Kuban DA, Tucker SL, Dong L, Starkschall G, Huang EH, Cheung RM, . Long-term results of the M. D. Anderson randomized dose-escalation trial for prostate cancer. Int J Radiat Oncol Biol Phys 2008;70:67–74.
- Dearnaley DP, Sydes MR, Graham JD, Aird EG, Bottomley D, Cowan RA, . Escalated-dose versus standard-dose conformal radiotherapy in prostate cancer: First results from the MRC RT01 randomised controlled trial. Lancet Oncol 2007;8:475–87.
- Ghilezan M, Yan D, Liang J, Jaffray D, Wong J, Martinez A. Online image-guided intensity-modulated radiotherapy for prostate cancer: How much improvement can we expect? A theoretical assessment of clinical benefits and potential dose escalation by improving precision and accuracy of radiation delivery. Int J Radiat Oncol Biol Phys 2004;60:1602–10.
- Pollack A, Zagars GK, Starkschall G, Antolak JA, Lee JJ, Huang E, . Prostate cancer radiation dose response: Results of the M. D. Anderson phase III randomized trial. Int J Radiat Oncol Biol Phys 2002;53:1097–105.
- Noe KØ, de Senneville BD, Elstrøm UV, Tanderup K, Sørensen TS. Acceleration and validation of optical flow based deformable registration for image-guided radiotherapy, Acta Oncol 2008;47:1286–93.
- Kupelian PA, Langen KM, Zeidan OA, Meeks SL, Willoughby TR, Wagner TH, . Daily variations in delivered doses in patients treated with radiotherapy for localized prostate cancer. Int J Radiat Oncol Biol Phys 2006;66:876–82.
- Muren LP, Smaaland R, Dahl O. Organ motion, set-up variation and treatment margins in radical radiotherapy of urinary bladder cancer. Radiother Oncol 2003;69: 291–304.
- Baum C, Alber M, Birkner M, Nüsslin F. Robust treatment planning for intensity modulated radiotherapy of prostate cancer based on coverage probabilities. Radiother Oncol 2006;78:27–35.
- Månsson Haskå T, Honoré H, Muren LP, Høyer M, Poulsen PR. Intrafraction changes of prostate position and geometrical errors studied by continuous electronic portal imaging. Acta Oncol 2008;47:1351–7.
- Fiorino C, Alongi F, Broggi S, Cattaneo GM, Cozzarini C, Di Muzio N, . Physics aspects of prostate tomotherapy: Planning optimization and image-guidance issues. Acta Oncol 2008;47:1309–16.
- Korreman S, Rasch C, McNair H, Verellen D, Oelfke U, Maingon P, . The European Society of Therapeutic Radiology and Oncology – European Institute of Radiotherapy (ESTRO-EIR) report on 3D CT-based in-room image guidance systems: A practical and technical review and guide. Radiother Oncol 2010;94:129–44.
- Ghilezan M, Yan D, Martinez A. Adaptive radiation therapy for prostate cancer. Semin Radiat Oncol 2010;20:130–7.
- Thirion JP. Image matching as a diffusion process: An analogy with Maxwell's demons. Med Image Anal 1998;2: 243–60.
- Helminen H, Alakuijala J, Pesola K, Laitinen J. Comparison of local external force functions for non-rigid registration of 3D medical images. Ellis RE, Peters TM. Medical Image Computing and Computer-Assisted Intervention-MICCAI. 2003. 821–8.
- Dice LR. Measures of the amount of ecologic association between species. Ecology 1945;26:297–302.
- Yang D, Chaudhari SR, Goddu MS, Pratt D, Khullar D, Deasy JO, . Deformable registration af abdominal kilovoltage treatment planning CT and tomotherapy daily megavoltage CT for treatment adaption. Med Phys 2009;36:329–39.
- Rossi PJ, Schreibmann E, Jani AB, Master VA, Johnstone PAS. Boost first, eliminate systematic error, and individualize CTV to PTV margin when treating lymph node in high-risk prostate cancer. Radiother Oncol 2009;90:353–8.
- Fiorino C, Reni M, Bolognesi A, Cattaneo GM, Clandrino R. Intra- and inter-observer variability in contouring prostate and seminal vesicles: Implications for conformal treatment planning. Radiother Oncol 1998;47:285–92.