Abstract
Positron emission tomography (PET) allows non-invasive detection and mapping of tumor hypoxia. However, slow tracer kinetics and low resolution, results in limited tumor-to-normal tissue contrast and the risk of missing areas where hypoxic cells are intermixed with necrosis. The shape of tumor time activity curves (TACs), as deduced from dynamic scans, may allow further separation of tumors/tumor sub-volumes that are inseparable based on static scans. This study was designed to define the added value of dynamic scans. Material and methods. Three squamous cell carcinoma tumor models were grown in mice. Mice were injected with the 18F-labeled PET hypoxia-tracer fluoroazomycin arabinoside (FAZA) and the immunologically-detectable hypoxia-marker pimonidazole, and PET scanned dynamically for three to six hours. Subsequently, microregional tracer retention (autoradiography) and the distribution of pimonidazole-retaining cells (immunohistology) and necrosis were analyzed in tumor tissue sections. Dynamic PET data were analysed based on a two-compartment model with irreversible tracer binding generating estimates of the putative hypoxia surrogate markers k3 (tracer trapping rate constant) and Ki (influx rate constant from plasma into irreversible bound tracer). Results/Discussion. High tumor-to-reference tissue ratios and a strong linear correlation (R∼0.7 to 0.95) between density of hypoxic cells and FAZA concentration was observed three hours after tracer administration, suggesting that late time PET images provides an accurate measure of hypoxia against which kinetic model estimates can be validated. Tumor TACs varied widely (ranging from distinctly wash-out to accumulative type) among tumor types although pimonidazole-stainings revealed extensive hypoxia in all models. Kinetic analysis of tumor sub-volumes showed that k3 correlated poorly with late time FAZA retention regionally in two of the three tumor models. The influx rate constant Ki displayed far less variability and correlated strongly with late time FAZA retention (hypoxia) in two of three tumor models, whereas a non-consistent relationship was observed in the last tumor model. Our study demonstrates the potential usefulness of dynamic PET, but also that a simple two-compartment model may be inappropriate in some tumor models.
There is overwhelming evidence that tumor hypoxia is strongly linked to treatment resistance and aggressive metastasizing disease (for a review see [Citation1]). Identification and quantification of tumor hypoxia is challenging especially in the clinical setting. Direct measurements using the Eppendorf electrode have shown excellent prognostic value [Citation2,Citation3] but the technique is unsuitable for routine clinical use and does not allow for separation between viable hypoxic cells and necrosis. Assessment of hypoxia-regulated genes (endogenous markers) in tumor biopsies is more attractive in the clinic, however, their hypoxia-specificity has been challenged since genetic alterations (e.g. VHL mutations) and the influence of abnormal microenvironmental parameters other than hypoxia (e.g. low pH) may compromise their hypoxia specificity [Citation4,Citation5]. Furthermore, tumor heterogeneity may require several biopsies to avoid or minimize sampling errors.
Hypoxia PET imaging is arguably the leading and most appealing technology for detection and quantification of tissue hypoxia since it is non-invasive and allows assessment of the entire tumor volume in one examination thus avoiding the risk of sampling errors. However, the nitroimidazole-based hypoxia tracers are characterized by slow retention and washout of unbound (hypoxia unrelated) tracer which contaminates the images even hours after tracer administration. As a result, inter-tissue and intratumoral contrast is typically low which carries the risk of overlooking small foci of hypoxic cells or hypoxic cells intermixed with tracer-free necrosis when applying thresholds on static low-resolution PET data [Citation6,Citation7]. The introduction of second-generation tracers (e.g. FAZA EF3, EF5) with supposedly better pharmacokinetics have only resulted in a marginal improvement in intertissue contrast [Citation8,Citation9] compared to the standard hypoxia marker FMISO. Cu-ATSM belongs to a chemically different type of hypoxia markers which distributes much more rapidly than the 2-nitroimidazole-based tracers, however, its hypoxia-specificity has been questioned [Citation10]. Dynamic PET scans are potentially more informative since they allow for kinetic modelling and estimation of rate constants, some of which may be appropriate surrogate measures of hypoxia that allows separation of tumors/voxels that appears similar on static scans [Citation11–13]. Kinetic analysis of dynamic scans have shown promise compared to static scans in terms of predicting patient treatment response [Citation14]. However, it remains unclear to what extent kinetic modelling, which relies on numerous assumptions and simplifications, provides a more accurate estimate of tumor hypoxia in patients since post-scan invasive tumor analysis is not possible or has not been attempted. Preclinical testing of such kinetic models is therefore warranted. The main advantages of using animals include (i) the possibility of detailed post-scan invasive evaluation of tumor microenvironment and morphology, and (ii) that the late time PET hypoxia images, unlike in patients, provides an accurate measurement of regional hypoxia because clearance of contaminating unbound tracer is much more rapid in small animals with high metabolic rate [Citation15].
Material and methods
Animals and tumor models
Immunocompromised NMRI-nu/nu and conventional C3H/HeNTac female mice obtained from Taconic Laboratories (Ry, Denmark) were used as hosts for squamous cell carcinoma tumors of human or murine origin, respectively, and experiments were performed under national and European Union approved guidelines for animal welfare. Tumors were established in both flanks of mice by subcutaneous injection of culture-grown tumor cells. SiHa (cervix) cells were purchased from the American Type Culture Collection (ATCC, USA). Human UT-SCC-33 (gingiva of mandible) and murine SCCVII tumor cells were kindly provided by Reidar Grenman (Turku University central Hospital, Finland) and Dietmar Siemann (University of Florida, USA), respectively. To stimulate take rate and reproducible tumor growth co-injection with High Concentration Matrigel (BD biosciences) proved necessary for SiHa.
PET scans
Animals were used for experiments when at least one of the two flank tumors reached a size of approximately 1 000 mm3. Mice were quickly anaesthetized with isoflurane, injected intraperiotenally with piminidazole and transferred to custom built acrylic fixation devices that accommodates up to three mice. Mice were kept anaesthetized with 2% isoflurane carried in air for the duration of the scan. Following positioning in the fixation device, mice were fitted with tail vein catheters. To limit respiratory-induced tumor movements, one tumor in each mouse was gently pulled away from the body by means of a surgical thread sutured to the tumor-covering skin. The other tumor served as a control to exclude that tumor immobilization affects tumor blood flow and microenvironment. Prior to tracer injection, a 10 min transmission scan for attenuation and scatter correction was performed using a Concorde microPET R4 small animal scanner. Mice were then consecutively injected via the vein catheter with ∼10 to ∼30 MBq (depending on scan duration) of FAZA (synthesized as detailed in reference [Citation16]) and scanned dynamically for three to six hours. The frame structure included multiple 5 s frames in the beginning of the scan which allows identification of a blood pool located centrally in the heart cavity, which was used for estimation of an image-derived input function.
In order to validate the accuracy of this image-derived input function, isoflurane-anaesthetized mice without tumors were fitted with PE10 catheters. In short, the carotid artery was exposed through an incision over the trachea and throat. A silk suture was applied to prevent bleeding during catheter insertion. A PE10 catheter was inserted into the artery and secured in the vessel with two ligatures and externalized and the mouse was placed in the scanner as described above. Subsequently, FAZA was injected i.v. and blood samples were drawn at different time points directly into pre-weighed capillary tubes, which were reweighed and measured for radioactivity in a Packard well counter. The Packard reading was compared to the PET image intensity recorded at the time of blood sampling (midway in the time interval used for drawing the sample) in a ∼15 mm3 volume of interest (VOI) placed in the centre of a blood pool identified based on the first or second 5 s frame following tracer bolus administration.
Autoradiography and immunohistology
Following the scans, tumor-bearing mice were killed by neck dislocation and tumors (and a piece of thigh muscle) were excised and frozen in Isopentane pre-cooled to 240°C. Ten μm tissue cryosections were prepared and dried at room temperature. After drying, the intratumoral distribution of FAZA was revealed by exposing tissue sections to a Fujifilm BAS-SR 2025 phosphor imaging plate overnight after which the tracer signal was read at a pixel size of 25 μm using a BAS-5000 bio-imaging analyzer and visualized and analyzed with the ImageGauge software (Fujifilm, Japan). Following autoradiographic analysis, tumor tissue sections were stored at 280°C until immunohistological analysis.
Immunohistochemistry
Briefly, thawed cryosections were fixed in formalin and endogenous peroxidases were blocked with H2O2, followed by thorough rinsing in PBS. Slides were then transferred to a LabVision Autostainer 480 (Labvision, Fremont, USA) and incubated for 40 min with a rabbit polyclonal antibody against pimonidazole (kindly provided by Dr J. A. Raleigh). The primary antibody was detected by incubating sections for 30 min with anti-rabbit IgG-horseradish peroxidase-conjugated polymers (EnVision rabbit reagent, K4003; DakoCytomation). Finally, sections were counterstained with hematoxylin.
Comparison of FAZA autoradiography and pimonidazole images
Pimonidazole-stained tissue sections were digitalized at a high resolution for further manipulation using a Hamamatsu NanoZoomer slide scanner (Hamamatsu Photonics, Japan) and exported as tiff images. Pimonidazole images were then converted to 8-bit grayscale images and manually thresholded and converted into binary images using the ImageJ analysis software (NIH, USA). The threshold was adjusted to maximize the visual similarity of the binary image and clearly pimonidazole positive areas in the raw grayscale image, while at the same time preventing the appearance of pimonidazole-unrelated signal. Binary images showing pimonidazole-positive areas were imported into the ImageGauge program and covered with a grid with a pixel size of 2 × 2 mm and compared to a similarly positioned grid covering the autoradiogram for the same tissue section. Results from the two analyses were compared pixel-by-pixel generating scatter plots. Only pixels fully contained within the tumor area were included and pixels with large tissue holes and folds were excluded. In contrast, areas of necrosis were not omitted since the purpose of this analysis was to estimate the expected late-time quantitative accuracy of PET images.
PET image analysis
Images were reconstructed using a 2D filtered back projection algorithm resulting in 63 transverse and 128 coronal and sagittal sections with a thickness of 1.23, 0.72 and 0.72 mm, respectively. PET images were analyzed with the ASIpro software package and the VINCI software version 2.56 (Max-Planck Institute, Cologne, Germany). For each tumor a whole-tumor TAC was derived. Furthermore, multiple TACs were obtained from distinct sub-regions of each suture-fixed tumor by manually placing rectangular VOI's with a volume of ∼23 mm3 (2.5 × 2.5 × 3.7 mm) within the tumor. The location of VOI's were based on the last PET frame in order to span the range over low to intermediate to high levels of late-time tracer concentration. Each VOI was spatially separated and placed well inside the tumor volume to avoid spill-out and spill-in effects between VOI's and between tumor and non-tumor. Finally, an image-derived input function was generated from a blood-pool within the heart cavity which was identified from the first or second 5 s frame following tracer injection. TACs from whole-tumor and sub-regions were fitted using the irreversible two-tissue compartment model and an image-derived input function [Citation17]. The kinetic model has four free parameters: influx rate constant from plasma to cells, K1 (ml plasma/ml tissue/min), rate constant for transport from cells back to plasma, k2 (min−1), rate constant for irreversible binding inside the cells, k3 (min−1), and a vascular volume fraction, V0 (ml blood/ml tissue). The model was fitted to data by non-linear regression by optimizing the model parameters in order to minimize the residual sum of squares. Finally, using the kinetic parameter estimates from the nonlinear regression we calculated Ki=(K1×k3)/(k2 +k3), which is the influx rate constant from plasma to the trapped compartment (unit: ml plasma/ml tissue/min).
Results
All tumor models were in general hypoxic as evidenced by extensive pimonidazole binding in most tumors (). Furthermore, FAZA accumulated in tumors relative to well-oxygenated reference tissue at late time points as evident from the whole tumor TACs and the activity in the blood (input function) (). A similar conclusion was reached based on autoradiographic analysis when the concentration of FAZA for whole tumor sections was compared to FAZA signal in non-hypoxic (no pimonidazole) viable tumor areas (internal reference) or muscle cryosections (external reference). Visual inspection of autoradiograms and pimonidazole staining revealed that there was an excellent spatial agreement between foci of FAZA retention and pimonidazole-stained tumor cells (). This visual interpretation was confirmed by regression analysis on a pixel-by-pixel (2 × 2 mm) basis, which revealed a highly significant and directly proportional relationship between the relative number of hypoxic cells within the pixel (segmented pimonidazole images) and the pixel-averaged FAZA signal in both UT-SCC-33 (R=0.86±0.04, n=4) and SiHa (R=0.88±0.06, n=2), even when necrosis was present (). The correlation coefficients obtained for SCCVII were also highly significant but weaker (∼0.7), possibly flawed by what appears to be non-specific binding of the secondary antibody (). Accordingly, the late-time PET images are expected to provide a quantitatively accurate measure of regional and global hypoxia although a weaker PET-based correlation is likely due to spill-in and spill-out effects between adjacent tumor regions. Despite widespread pimonidazole binding in all tumor models (), whole-tumor TAC shapes varied widely and overall shape was more linked to tumor-type than the actual extent of hypoxia ( and ) and with no difference between suture-fixed and non-immobilized tumor (). SiHa tumors were consistently characterized by a rapid tracer influx to the whole tumor volume (possible suggesting a high blood flow) followed by tumor tissue tracer loss for the rest of the scan. An analysis of tumor sub-volumes (23 mm3) in SiHa tumors revealed the same pattern as no VOIs displayed TACs with positive slopes (accumulative type) despite widespread hypoxia (). SCCVII behaved oppositely since no early-time tracer influx peak could be identified whereas tracer accumulated for the duration of the scan both globally () and regionally () reaching the highest level of the three tumor models. UTSCC-33 was in between but displayed more heterogeneity in TAC shapes when analyzed in tumor sub-regions, possibly due to the presence of necrosis (). We next performed kinetic modeling of the tumor TACs using an image-derived input function, which was validated by a direct comparison with blood samples drawn from two catheterized mice (). This direct comparison revealed a near-constant image-to-blood ratio of ∼1.6 throughout the scan, for which reason the image-derived input function used for kinetic modeling was corrected by a multiplicative factor of 0.625. Pharmacokinetic analysis of whole tumors were performed using time intervals of 60 min, 120 min or the whole scan interval for the actual curve fitting (some examples of whole scan fittings are given in ). The most important results in terms of possible hypoxia surrogate measures (k3, Ki) are summarized in . Also included, is K1, a possible surrogate parameter for blood flow. As intuitively expected based on TAC shapes in whole tumors, K1 were highest in SiHa. The vascular volume fraction V0 was lowest in SCCVII and highest in SiHa (results not shown).
Figure 1. Late time PET hypoxia scans in tumor-bearing mice provides a quantitatively accurate measure of the density of hypoxic cells. Left column: pimonidazole stained tumor section, second column: segmented pimonidazole image showing the distribution of pimonidazole-positive cells (pO2 < ∼10 mmHg). Third column: FAZA autoradiogram obtained from the same tissue section. Last column: scatterplot showing the spatial relationship between average FAZA signal and relative area covered by hypoxic cells derived by a pixel-by-pixel (2×2 mm) comparison between the segmented pimonidazole image and the FAZA autoradiogram. Upper row: UT-SCC-33, middle row: SiHa, lower row: SCCVII.
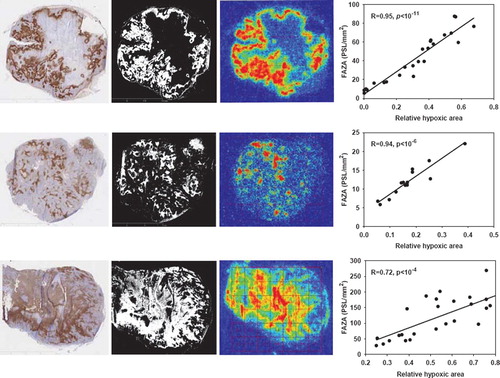
Figure 2. PET image-derived input functions (left column) and whole-tumor TACs (right column) for mice carrying tumors in both flanks. Upper row: TACs for two UT-SCC-33 flank tumors (filled and open circles, respectively). Middle: TACs for two SiHa flank tumors and lower row: TACs for two SCCVII flank tumors. Part of the input function is included in the whole-tumor TAC figures.
Figure 3. TACs derived from six to eight rectangular VOIs each with a size of 2.5×2.5×3.7 mm placed in different tumor regions representing areas differing in late time FAZA concentration. TACs are presented for the whole scan (left column) and first 20 min of the scan (right column), which allows for easy comparison between early tumor tracer influx and late-time tracer retention.
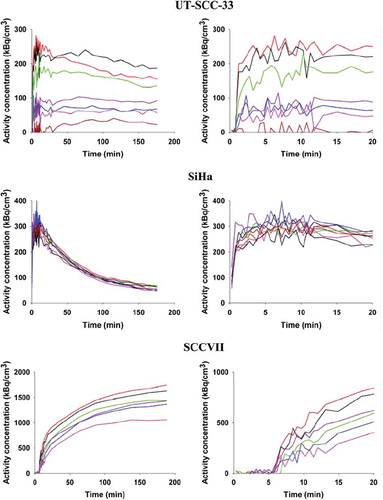
Figure 4. Comparison between arterial blood activities measured in blood samples derived from a catheter in the carotid artery and PET image-derived activity values obtained from a 15 mm3 VOI placed in the heart cavity as identified on the first or second 5 s frame following tracer administration. PET images: The vena cava and heart cavity is clearly visible in the early images. The graph shows the radioactivity ratio between a VOI positioned in a blood pool in the heart cavity and blood samples drawn from the carotid artery in two (open and closed circles respectively) catheterized mice.
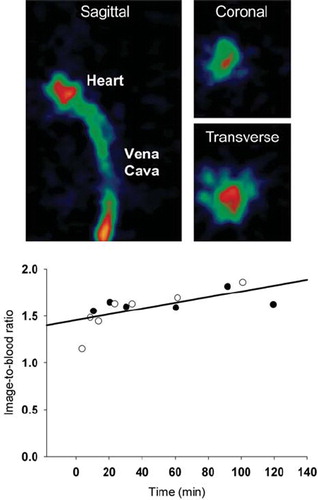
Figure 5. Examples of fits obtained in the three tumor models: UT-SCC-33 (top), SiHa (middle), SCCVII (bottom). Dynamic PET data up to 3 h from whole tumor VOIs are shown as open circles. The best fits using an irreversible two-tissue compartment model are shown as solid lines.
Table I. Selected rate constants for three different tumor models derived from kinetic analysis of whole-tumor TACs. The number in brackets denotes standard deviations.
Since tumor-to-tumor variability within tumor model, in terms of 3 h FAZA signal, was low (e.g. ) no attempt was made, on a whole-tumor basis, to correlate hypoxia-related rate constants with late time PET scan results. Instead, individual tumors were divided into small regions selected based on differences in the FAZA signal recorded in the last PET frame. A small VOI volume will maximize differences between different tumor parts, however, due to noise a VOI volume of 23 mm3 was chosen as a compromise. For each fitting time interval and sub-volume, k3 and Ki values were compared to the 3 h FAZA signal and scatterplots were generated ( and ). The correlation coefficient varied widely but typically improved when the fitting interval was extended, and Ki emerged as a much more robust (less variability and higher correlation coefficient) surrogate marker of hypoxia than k3. In some SCCVII tumors the 2-compartment model was unable to generate meaningful fits.
Figure 6. Comparison between the 3 h FAZA signal derived from the last PET image frame (170 to 180 min) and tracer trapping rate constant (k3) or the influx rate constant from plasma into irreversible bound tracer (Ki) in three different tumor models. Three different TAC time intervals (60, 120, 180 min) were used for model fitting.
Table II. Pearson regression coefficients and p-values obtained when plotting k3 and Ki values as a function of FAZA concentration at 3h for multiple tumor sub-volumes (for tumors not shown in ).
Discussion
FDG-PET scans has been widely applied in oncology [Citation18–23], however, numerous PET tracers are now available or being developed. Among those are markers of the tumor microenvironment, including 18F-labeled 2-nitroimidazole hypoxia markers which are reduced and bound when cellular pO2 drops below approximately 10 mmHg. Since the target (the hypoxic cell) typically is far away from the blood and unbound tracer is cleared slowly, the problem of low image contrast is inherent to hypoxia imaging even 4 h after tracer administration (limits on injectable dose and the half life of 18F prevents even later scans). It has been argued that kinetic modelling based on tumor tissue TAC shapes (e.g. tumor tracer influx peak magnitude/late time slopes) is necessary since an appropriate tissue model may reveal treacherous tumor regions (e.g. hypoxia and necrosis intermixed) that are overlooked when applying simple thresholds on static PET scans images [Citation13]. In accordance, dynamic hypoxia PET scans in patients have generated promising, although very preliminary, results in respect to ability to separate patients in progressors and non-progressors [Citation14].
However, clinical studies suffer from the lack of an accurate “golden standard” to compare with, since the true oxygenation status of the tumor normally remains unknown and it is therefore not clear whether the estimated parameters (e.g. binding rate constant) provides a more accurate estimate of global and regional tumor hypoxia than traditional quantification based on late-time static scans (e.g. tumor-to-reference tissue ratios). Unlike in patients, unbound FAZA is largely cleared at late time points in tumor-bearing mice resulting in a near-perfect spatial overlap between FAZA and pimonidazole (). Late time FAZA-PET will therefore provide accurate estimates of global and regional tissue hypoxia in tumor-bearing mice making them particularly useful for pharmacokinetic analysis since model parameters can be compared to late time images. The weaker correlation between FAZA and pimonidazole in the SCCVII tumor model is probably caused by non-specific signal since in a previous study using the same model a very strong linear correlation between FAZA and pimonidazole visualized using immunofluoresence microscopy was revealed [Citation15].
Intuitively, non-hypoxic tumors are expected to present with TACs with distinct early-time peaks and late-time negative slopes whereas a weak early-time peak and late-time positive slopes are expected in hypoxic/necrotic tumors. Qualitative inspection of whole-tumor and regional TACs in our three tumor models revealed some unexpected and interesting features. Whole-tumor TACs shapes varied widely and overall shape was largely tumor-type dependent rather than determined by the actual extent of hypoxia (). Specifically, we showed that SiHa tumors with proven hypoxia (, pimonidazole staining) are characterized by distinctly washout-type TACs with negative slopes and the same pattern was consistently observed for TACs derived from multiple tumor sub-volumes (). The co-existence of high blood flow and extensive hypoxia in SiHa tumors may reflect a disorganized/ineffective vasculature which uncouples blood flow and oxygen delivery capacity. Furthermore, we have previously shown that SiHa tumor cells unlike most cancer cells have a non-glycolytic energetic phenotype and a very high rate of oxygen consumption (cell volume normalized) which may result in hypoxia despite high blood flow [Citation24]. The combination of severe hypoxia and net tumor tracer clearance even at very late time may also relate to the tumor host since the rapid clearance of unbound tracer in rodents may dominate the development of intratissue and intratumoral contrast rather than the rate of tracer retention per se. When examining tumor sub-volume TACs, another unexpected finding was the lack of an inverse relationship between initial tumor tracer influx and late time FAZA retention, and indeed the opposite pattern was often observed, which is also reflected in the near-absence of intercrossing TACs except at very early time points (). This was also true when scan duration was prolonged to 6 h (not shown). The underlying pathophysiological explanation for such observations remains unclear, but may suggest a fundamental difference between animal models and patient tumors.
For quantitative analysis, we used a one plasma two-compartment model which assumes that the tracer binding is irreversible and that the majority of radioactivity in the blood originates from the tracer rather than unwanted metabolites. There are data suggesting that hypoxia-induced retention of 2-nitroimidazole-based compounds is partly reversible [Citation25] and that unspecific metabolites are present [Citation8] but our study design and applied model was chosen to allow direct comparison with clinical studies using the same model. We used an image-derived arterial input function since repetitive blood sampling is problematic in small animals and the obtainable time resolution early after tracer administration when using blood samples is insufficient. Due to the low resolution of PET scanners and the small heart in mice spill-in and spill-over effects between cardiac tissue structures and the ventricular blood pool may affect the image-derived input function. Separation between right (venous blood) and left (arterial blood) ventricle is also difficult although this is probably of little importance considering the very slow tracer kinetics and long scans times in hypoxia scans which minimize the difference between arterial and venous blood. Accordingly, we performed a direct comparison between blood samples and image-derived values which revealed a near-constant ratio between image and blood samples, which allowed us to calculate and use a multiplicative correction factor. The reason for the discrepancy between blood and PET image measurements remains unclear, but it should be stressed that none of the conclusions in the kinetic analysis is affected by the magnitude of this factor.
When the usefulness of the kinetic model is tested, a key question is whether the model at relatively early time points (when tissue contrast still mimics the clinical challenge) is able to predict the true hypoxic state of whole tumors or tumor sub-volumes as assessed from the 3 h FAZA signal. Accordingly, we tested the model either using the first 60 min, 120 min or the whole scan for curve fitting. Parameter estimates of the putative hypoxia surrogate parameters k3 and Ki, and the blood flow related K1 are summarized in and showed that largely similar estimates of k3 and Ki was obtained when using 120 or 180 min, but not 60 min, for the model fitting. A tumor-to-tumor comparison of rate constants and late time FAZA signal within each tumor type was not attempted since tumors generally had very similar relative FAZA retention 3 h post injection. Instead, we focused on an analysis of tumor sub-regions where the rate constants for each tumor region was compared to the FAZA signal in the same tumor region at 3 h, generating scatterplots (). The ability of the model to predict, at early time points (60 or 120 min), the late-time tumor sub-volume FAZA content (i.e. hypoxic cell density) was highly tumor-type dependent, and reliable estimates were not obtained in all SCCVII tumors (). In SiHa, the k3 and Ki calculated from 120 min and 180 min model fits were in reasonably agreement with 3 h FAZA levels, whereas the weakly positive correlations obtained at 60 min did not reach significant levels ( and ). The most remarkable result was obtained for the UT-SCC-33 model, where k3 showed no correlation to the 3 h FAZA level, while a highly significant near linear relationship was obtained for Ki and 3 h FAZA. Unfortunately, a similar analysis in two other mice carrying UT-SCC-33 tumors was not possible due to accidental tumor movements during the scan. To strengthen our conclusion, we therefore included a non-suture-fixed UT-SCC-33 tumor in the kinetic analysis which resulted in remarkably similar results (), suggesting that Ki, unlike k3, is an excellent predictor of hypoxia in that tumor type. In general, our results agrees well with a clinical study where it was concluded that Ki is a more robust candidate than k3 as a surrogate parameter for hypoxia [Citation12].
The generic two-compartment model applied in the present study assumes that the modelled region (whole-tumor or tumor sub-volume) is homogenous although we know that hypoxia is highly heterogeneous at a scale much smaller than the regions that can be analyzed using PET (e.g. ). This may possible explain why the model performs poorly in some tumor models, although it indeed did perform well in a highly heterogeneous and sometimes necrotic tumor model like UT-SCC-33. Currently, we are therefore evaluating a model which was developed by Thorwarth and colleagues [Citation13] and which from a pathomorphological/pathophysiological point of view is more realistic.
Conclusions
We have shown that different tumor types, despite all being very hypoxic, can have very different TACs, ranging from accumulative-types to washout types, and that overall shape depends on tumor type rather than extent of hypoxia. We also showed that Ki was a more robust hypoxia surrogate parameter than k3, but the ability of either parameter to predict late time FAZA signal (a reliable measure of hypoxia) were highly dependent on the tumor model.
Acknowledgements
We thank Ms. M. Simonsen from the PET-centre (Aarhus University Hospital, Aarhus, Denmark), Mr. T. Nielsen, Ms. I. M. Horsman, Mr. M. Johannsen, Ms. D. Grand, Ms. P Schjerrbeck, Ms. M.V. Bjerre and Ms. M. Kristiansen from the Department of Experimental and Clinical Oncology (Aarhus University Hospital, Aarhus, Denmark) and Lene H. Skjærris from the Institute of Pathology (Aarhus University Hospital, Aarhus, Denmark) for excellent technical and practical assistance. This study was supported by the EC FP6 project BIOCARE (LSHC-CT-2204-505785) and EC FP7 project METOXIA (Project no. 222741), and CIRRO - The Lundbeck Foundation Center for Interventional Research in Radiation Oncology, and The Danish Council for Strategic Research.
Declaration of interest: The authors report no conflicts of interest. The authors alone are responsible for the content and writing of the paper.
References
- Vaupel P, Mayer A, Hockel M. Tumor hypoxia and malignant progression. Methods Enzymol 2004;381:335–54.
- Nordsmark M, Overgaard M, Overgaard J. Pretreatment oxygenation predicts radiation response in advanced squamous cell carcinoma of the head and neck. Radiother Oncol 1996;41:31–9.
- Nordsmark M, Bentzen SM, Rudat V, Brizel D, Lartigau E, Stadler P, . Prognostic value of tumor oxygenation in 397 head and neck tumors after primary radiation therapy. An international multi-center study. Radiother Oncol 2005;77: 18–24.
- Sorensen BS, Hao J, Overgaard J, Vorum H, Honore B, Alsner J, . Influence of oxygen concentration and pH on expression of hypoxia induced genes. Radiother Oncol 2005;76: 187–93.
- Sorensen BS, Alsner J, Overgaard J, Horsman MR. Hypoxia induced expression of endogenous markers in vitro is highly influenced by pH. Radiother Oncol 2007;83:362–6.
- Busk M, Horsman MR, Overgaard J. Resolution in PET hypoxia imaging: Voxel size matters. Acta Oncol 2008;47: 1201–10.
- Christian N, Lee JA, Bol A, De BM, Jordan B, Gregoire V. The limitation of PET imaging for biological adaptive-IMRT assessed in animal models. Radiother Oncol 2009;91:101–6.
- Mahy P, De BM, de GT, Cheguillaume A, Gillart J, Haustermans K, . Comparative pharmacokinetics, biodistribution, metabolism and hypoxia-dependent uptake of [18F]-EF3 and [18F]-MISO in rodent tumor models. Radiother Oncol 2008;89:353–60.
- Sorger D, Patt M, Kumar P, Wiebe LI, Barthel H, Seese A, . [18F]Fluoroazomycinarabinofuranoside (18FAZA) and [18F]Fluoromisonidazole (18FMISO): A comparative study of their selective uptake in hypoxic cells and PET imaging in experimental rat tumors. Nucl Med Biol 2003;30: 317–26.
- O'Donoghue JA, Zanzonico P, Pugachev A, Wen B, Smith-Jones P, Cai S, . Assessment of regional tumor hypoxia using 18F-fluoromisonidazole and 64Cu(II)-diacetyl-bis(N4-methylthiosemicarbazone) positron emission tomography: Comparative study featuring microPET imaging, Po2 probe measurement, autoradiography, and fluorescent microscopy in the R3327-AT and FaDu rat tumor models. Int J Radiat Oncol Biol Phys 2005;61:1493–502.
- Casciari JJ, Graham MM, Rasey JS. A modeling approach for quantifying tumor hypoxia with [F-18]fluoromisonidazole PET time-activity data. Med Phys 1995;22:1127–39.
- Wang W, Lee NY, Georgi JC, Narayanan M, Guillem J, Schoder H, . Pharmacokinetic analysis of hypoxia (18)F-fluoromisonidazole dynamic PET in head and neck cancer. J Nucl Med 2010;51:37–45.
- Thorwarth D, Eschmann SM, Paulsen F, Alber M. A kinetic model for dynamic [18F]-Fmiso PET data to analyse tumour hypoxia. Phys Med Biol 2005;50:2209–24.
- Thorwarth D, Eschmann SM, Scheiderbauer J, Paulsen F, Alber M. Kinetic analysis of dynamic 18F-fluoromisonidazole PET correlates with radiation treatment outcome in head-and-neck cancer. BMC Cancer 2005;5:152.
- Busk M, Horsman MR, Jakobsen S, Hansen KV, Bussink J, van der KA, . Can hypoxia-PET map hypoxic cell density heterogeneity accurately in an animal tumor model at a clinically obtainable image contrast? Radiother Oncol 2009;92: 429–36.
- Busk M, Horsman MR, Jakobsen S, Keiding S, van der Kogel AJ, Bussink J, . Imaging hypoxia in xenografted and murine tumors with 18F-fluoroazomycin arabinoside: A comparative study involving microPET, autoradiography, PO2-polarography, and fluorescence microscopy. Int J Radiat Oncol Biol Phys 2008;70:1202–12.
- Sokoloff, L. Mapping cerebral functional activity with radioactive deoxyglucose. Trends Neurosci 1978;1:75–9.
- Toma-Dasu I, Dasu A, Brahme A. Dose prescription and optimisation based on tumour hypoxia. Acta Oncol 2009;48: 1181–92.
- Aerts HJ, van Baardwijk AA, Petit SF, Offermann C, Loon J, Houben R, . Identification of residual metabolic-active areas within individual NSCLC tumours using a pre-radiotherapy (18)Fluorodeoxyglucose-PET-CT scan. Radiother Oncol 2009; 91:386–92.
- Schinagl DA, Hoffmann AL, Vogel WV, van Dalen JA, Verstappen SM, Oyen WJ, . Can FDG-PET assist in radiotherapy target volume definition of metastatic lymph nodes in head-and-neck cancer? Radiother Oncol 2009;91: 95–100.
- De RD, Houben A, Aerts HJ, Dehing C, Wanders R, Ollers M, . Increased (18)F-deoxyglucose uptake in the lung during the first weeks of radiotherapy is correlated with subsequent Radiation-Induced Lung Toxicity (RILT): A prospective pilot study. Radiother Oncol 2009;91:415–20.
- Soto DE, Kessler ML, Piert M, Eisbruch A. Correlation between pretreatment FDG-PET biological target volume and anatomical location of failure after radiation therapy for head and neck cancers. Radiother Oncol 2008;89: 13–8.
- Lee SW, Nam SY, Im KC, Kim JS, Choi EK, Ahn SD, . Prediction of prognosis using standardized uptake value of 2-[(18)F] fluoro-2-deoxy-d-glucose positron emission tomography for nasopharyngeal carcinomas. Radiother Oncol 2008;87:211–6.
- Busk M, Horsman MR, Kristjansen PE, van der Kogel AJ, Bussink J, Overgaard J. Aerobic glycolysis in cancers: Implications for the usability of oxygen-responsive genes and fluorodeoxyglucose-PET as markers of tissue hypoxia. Int J Cancer 2008;122:2726–34.
- Busk M, Horsman MR, Jakobsen S, Bussink J, van der KA, Overgaard J. Cellular uptake of PET tracers of glucose metabolism and hypoxia and their linkage. Eur J Nucl Med Mol Imaging 2008;35:2294–303.