Abstract
Purpose. To investigate the moving gap region dosimetry in proton beam cranio-spinal irradiation (CSI) to provide optimal dose uniformity across the treatment volume. Material and methods. Proton beams of ranges 11.6 cm and 16 cm are used for the spine and the brain fields, respectively. Beam profiles for a 30 cm snout are first matched at the 50% level (hot match) on the computer. Feathering is simulated by shifting the dose profiles by a known distance two successive times to simulate a 2 × feathering scheme. The process is repeated for 2 mm and 4 mm gaps. Similar procedures are used to determine the dose profiles in the moving gap for a series of gap widths, 0–10 mm, and feathering step sizes, 4–10 mm, for a Varian iX 6MV beam. The proton and photon dose profiles in the moving gap region are compared. Results. The dose profiles in the moving gap exhibit valleys and peaks in both proton and photon beam CSI. The dose in the moving gap for protons is around 100% or higher for 0 mm gap, for both 5 and 10 mm feathering step sizes. When the field gap is comparable or larger than the penumbra, dose minima as low as 66% is obtained. The dosimetric characteristics for 6 MV photon beams can be made similar to those of the protons by appropriately combining gap width and feathering step size. Conclusion. The dose in the moving gap region is determined by the lateral penumbras, the width of the gap and the feathering step size. The dose decreases with increasing gap width or decreasing feathering step size. The dosimetric characteristics are similar for photon and proton beams. However, proton CSI has virtually no exit dose and is beneficial for pediatric patients, whereas with photon beams the whole lung and abdomen receive non-negligible exit dose.
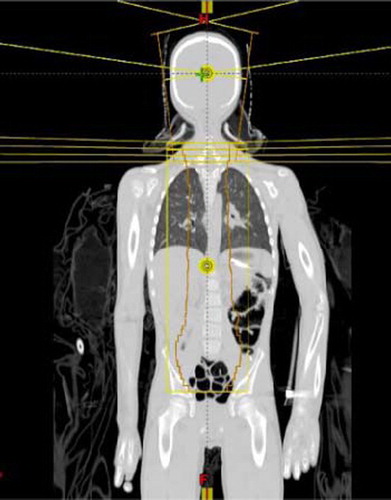
Cranio-spine irradiation (CSI) is often used for the treatment of medulloblastoma. Due to the limitation of field lengths and the complex shape of the target volume, CSI with external beams has been technically and dosimetrically challenging. The common irradiation technique with high energy photons involves matching a pair of parallel opposed brain fields with an orthogonal spine field geometrically using collimator rotation and couch kick. On the other hand, while more than one spine field may be required to encompass the entire length of the spine, matching of the supine fields is relatively simple as they are coplanar. The major problem in matching the orthogonal fields in CSI is the risk of overlap in the spinal cord due to beam divergence, patient movement and setup uncertainty. A feathering (or moving junction) technique is commonly used to reduce likelihood of cord overdose due to overlapping. In addition to feathering, some clinics choose to take further precaution to guard against cord overdose by using a skin gap between the caudal margin of the brain fields and the cephalic margin of the spine field. In a previous study using photon beam for CSI, it was found that the relative dose decreases with the gap size, and that the dose increases with increasing feathering step size [Citation1]. illustrates the geometric field matching and feathering technique in a coronal view of a CSI setup. The field matching and feathering is also shown in a sagittal view in .
Figure 1. Geometric field matching and feathering in CSI.
The proton beam has a unique dosimetric characteristic with a finite range which results in the sparing of normal tissues distal to the Bragg peak. In addition, the narrow lateral penumbra of a proton beam at shallow depths implies that dose outside of a proton field is relatively minimal [Citation17]. These beam characteristics are especially beneficial to pediatric patients as they generally have longer life expectancy, and thus a better quality of life post-radiation therapy is an important consideration in their cancer management. Proton therapy has the advantage of reducing the late effects reported in treatments with high-energy photons [Citation2–6] and possibly increasing the target dose. Retrospective treatment planning studies in CSI have demonstrated substantial sparing of normal tissues of proton over photon therapy – including IMRT – [Citation7–9], and reduction in dose- volumes in supratentorial brain or temporal lobes, that may result in clinically significant higher IQ scores [Citation3,Citation4]. Among photon, electron and proton beams, it is commonly agreed that proton beams provide superior dose distribution [Citation7,Citation8,Citation10]. Clinically, reports of proton CSI have been focused on the reduced treatment toxicity [Citation9,Citation11,Citation12] and the effect of secondary neutrons [Citation13–15]. Dosimetrically, it has been reported that in proton CSI, the dose downstream from the primary field is dominated by internally produced neutrons and that the out-of-field dose is due to the primary protons that may or may not have scattered from the brass collimating devices depending on the distance from the field edge [Citation15,Citation16]. As a proton beam penumbra is relatively small (<3 mm) at shallow depths, the required gap between the brain and the spine fields in proton CSI is usually small, and the feathering step size is generally taken from photon experience. However, the actual dose distribution in the moving gap region and the proton feathering schema have not been studied, even though many institutions are now routinely using proton beams for CSI [Citation7–10].
In this study, we have carried out a systematic dosimetric study in the moving gap region for various combinations of field junction widths and feathering step sizes in proton CSI. In addition, we have compared the dosimetry in the field junction between proton and photon beams.
Material and methods
At the Indiana University Health Proton Therapy Center (IUHPTC), CSI is performed with uniform scanning proton beams, the characteristics of which have been reported elsewhere [Citation17]. The patients are treated in the supine position with a rotational gantry. The brain fields consist of a pair of lateral opposed fields. To cover the length of the spine, most patients require two posterior spine fields. Typically, the whole CSI receives 36 Gy in 20 fractions. A boost dose of 14.4–19.8 Gy is given to the posterior fossa in 8–11 fractions with a three-field technique. A 30 cm diameter snout unique to IUHPTC is used for both the brain fields and the spine fields to eliminate the need to change snouts mid-treatment. Field matching is carried out by matching the edges of the abutting brass apertures. For example, the inferior edges of the apertures for the brain fields are aligned with the superior edge of the superior spine field aperture, using the treatment planning system (CMS, XiO). Feathering is carried out by fabricating three sets of apertures (and their corresponding compensators) for each brain and spine fields for three successive treatments in a two featherings irradiation scheme. The superior or inferior edge of each aperture and compensator pair either increased or decreased by 1 cm (for 1 cm feathering) as determined by the treatment plan. An advantage in proton CSI is the very small beam divergence because of the large SAD (250 cm for the gantry rooms at the IUHPTC). The feathering direction may start from either the most superior or the most inferior field junction. The edges of the abutting apertures are shaped by matching the divergent lines of the brain and the spine fields. The average ranges and SOBP for the brain fields and spine fields are 17.3 cm, 15.9 cm and 10.7 cm, 6.6 cm, respectively, determined from 22 consecutive CSI patients treated from July 2010 to July 2011 at the IUHPTC.
In this study, two different proton energies with ranges 16 and 11.6 cm are used for the brain and the spine fields, respectively. The large range of spine field is to account for the thickness of an in-house designed carbon fiber table top (water-equivalent thickness ∼0.8cm). The dose profiles for these two energies are measured with films at isocenter at the middle of 10 cm SOBP in a solid water phantom (in a perpendicular geometry) for the 30 cm snout. The 10 cm SOBP is chosen for simplicity in setup. The small differences in the film depths (which are 1.7 cm for the brain and 3 cm for the spine fields, respectively) between the center of the 10 cm SOBP and that of the average SOBP are not expected to have any significant effect on our results.
Dose profiles in the moving gap region in proton CSI
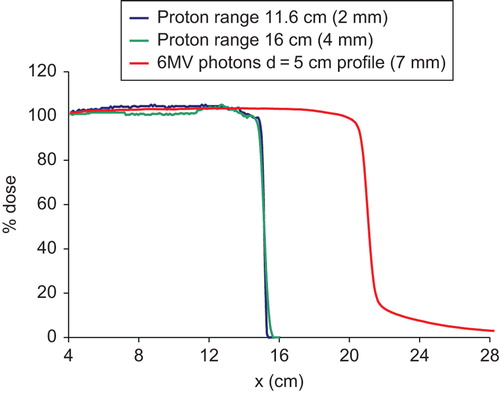
Feathering of the junction between the brain fields and the spine field is simulated on computer by shifting the profiles two successive times by a known distance. Because of the narrow proton beam penumbra (), only small junction widths (gaps) are considered: 0 (hot match), 2 and 4 mm. Dose profiles in the moving gap region are calculated for two different feathering step sizes: 5 mm and 10 mm. All dose values are normalized to the dose at the respective central axis.
Figure 2. Comparison of proton and photon dose profiles used in this study. The numbers in the parenthesis are the 80–20% penumbral widths.
To simulate the feathering of the spine fields, the profiles for the 11.6 cm range proton beam are used for both the superior and the inferior spine fields.
Comparison of dose profiles in the moving gap region between protons and 6MV photons
The 6 MV in-plane dose profile at 5 cm depth of a Varian iX machine for a 40 × 40 cm2 field is used for the simulation. Photon CSI normally is performed with either 0 mm or 5 mm gap between the spine and the brain fields, and likewise between the spine fields. However, for ease of comparison with proton CSI, the 6MV beam profiles with gaps at 0, 2, 4, 6, 8 and 10 mm and feathering step sizes of 5 mm, 6 mm and 10 mm are used. The dose profiles in the moving gap region for the proton and photon beams are then compared for the three feathering step sizes.
Results
Dose profiles in the moving gap region in proton CSI
compares the dose profiles of the two proton beams with that of the 6 MV photons at depth of 5 cm. The proton beams penumbras (20–80%) are between 2–4 mm whereas for the 6 MV photons, it is about 7–8 mm. In addition to a smaller penumbra, the proton beam profiles have a small “tail” of less than 1% beyond the field edge, while the 6 MV photons exhibit a significant dose tail extending several centimeters beyond the 10% dose. Thus the dose outside of a treatment field is significantly less for proton beams than for photons.
The variations of dose in the moving gap region between the brain and the spine fields for the different gap widths: 0, 2 and 4 mm for two 5 mm featherings are shown in . It can be seen that the dose profiles exhibit peaks and valleys in the moving gap region for the different gap widths. The dose varies between 95–106%, 80–98%, and 68–78% for 0, 2 and 4 mm gaps, respectively between the brain and the spine fields.
Figure 3. Comparison of dose profiles in the moving gap region between the brain and the spine fields for the three different gaps: 0, 2 and 4 mm, with (a) two 5 mm featherings, (b) two 10 mm featherings and (c) build up of the dose in the moving gap region with a 4 mm gap between the brain and the spine fields, and two 5 mm featherings. BF, brain field; Comp, composite dose; SF, spine field.
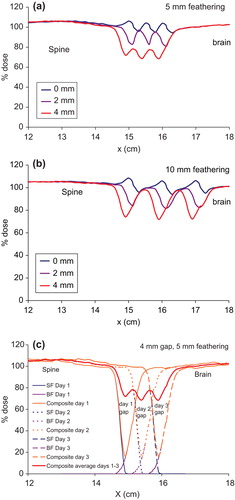
For 10 mm feathering step size, the dose in the moving gap region varies between 95–108%, 82–103% and 72–98% for 0, 2 and 4 mm gaps, respectively as shown in . The large change in the minimum dose with even a 2 mm gap between the brain and the spine fields is due to the very small proton penumbras. The larger feathering step size increases the dose in the moving gap.
The peaks and valleys in the dose profile in the moving gap region could be explained in terms of penumbra, field gaps and feathering step size. This is illustrated for the case of 4 mm gap and two 5 mm featherings in . This is the worst case scenario in the present study in order to show the dramatic dose change due to gap width and feathering. The small proton penumbras result in a dose minimum at about 20% in each day with a 4 mm gap between the brain and the spine fields. Featherings in Days 2 and 3 extend the superior field edge of the spine field into the Day-1 and Day-2 gaps, and move the inferior edges of the brain fields cephalically into the Day-2 and Day-3 gaps. Thus feathering essentially moves the uniform dose portion of either the brain or the spine fields into the gaps. As a result, the three dose minima of 20% are boosted to about 68%, averaged over the three successive irradiations and a dose variation between 68–78% in the moving gap.
The variation of dose in the moving gap region between the superior and the inferior spine fields (11.6 cm range protons) is shown in for two 5 mm feathering steps. Several small peaks and valleys are seen for the 0 mm gap. This small dose variation between 97–100% is a direct result of the very small penumbra for the 11.6 cm range proton beams. With a 2 mm gap between the spine fields, the dose in the moving gap varies between 77% and 93%. For 4 mm gap, the dose decreases further to 66–77%, with two 5 mm featherings. Such observations are non-intuitive when compared to the photon beam irradiation which has wide penumbra. The dose variation in the moving gap between the spine fields is improved by increasing the feathering step size to 10 mm () with dose variation of 99–104%, 78–101% and 68–99% for the 0, 2 and 4 mm gaps, respectively.
Figure 4. Comparison of dose profiles in the moving gap region between the superior and inferior spine fields for the three different gaps: 0, 2 and 4 mm, with (a) two 5 mm featherings, (b) two 10 mm featherings, and (c) build up of the dose in the moving gap region with a 0 mm gap between the spine fields, and two 5 mm featherings. Comp, composite dose; ISF, inferior spine field; SSF, superior spine field.
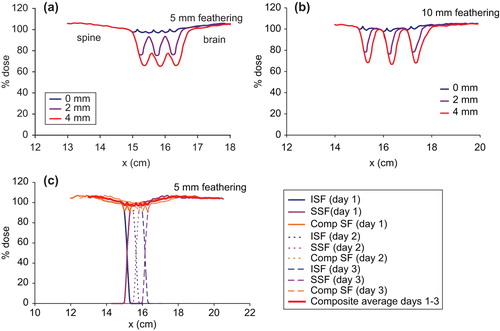
The fine structures of the dose profile for the 0 mm gap are directly related to the penumbra of the proton field. The dose variation in the moving gap for the case of 0 mm gap and 5 mm feathering is illustrated in . The dose profile in the gap between the superior and inferior spine fields in Day-1 consists of two minima at about 92%, and a maximum at 100%. The buildup of dose in the moving gap in subsequent featherings resulted in six small dose minima and five dose maxima between 97–100% as each feathering moves the uniform dose portion of the profile into the gap.
Comparison of dose profiles in the moving gap region between proton and 6 MV photons
shows the dose variation for the various gap widths with two 5 mm featherings for 6 MV photons. For the hot match setup, the dose in the moving gap is about 106% due to the 3% horn in the profile. The dose decreases to 94% with a 2 mm gap. In general, the dose decreases by about 5%/mm increment in the gap width. The dose minimum for the 10 mm gap is only about 50% in the moving gap region. The dose decrement with gap width is probably because the 5 mm feathering step is smaller than the penumbra of the profile, thus merely extends the penumbra into the gap region.
Figure 5. Comparison of dose profiles in the moving gap region for the various gaps between the brain and the spine fields for 6 MV photons with (a) two 5 mm featherings, and (b) two 10 mm featherings.
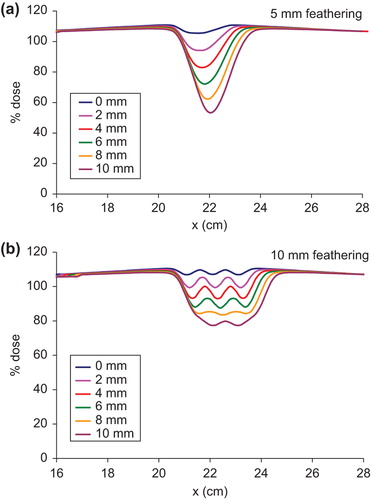
With 10 mm feathering step size, the dose profiles in the moving gap for the various gap widths are shown in . The composite dose profiles in the moving gap exhibit peaks and valleys as in the case of protons. With 0 mm gap, the dose profile in the moving gap varies between 107–110%. Even with 4 mm gap between the brain and the spine fields, the dose is between 93–100%, which is still clinically acceptable as 90% dose in the field junction is allowed per our clinical protocol for CSI. The dose in the moving gap varies between 88–93% for the 6 mm gap, 84–86% for the 8 mm gap and 77–80% for the 10 mm gap.
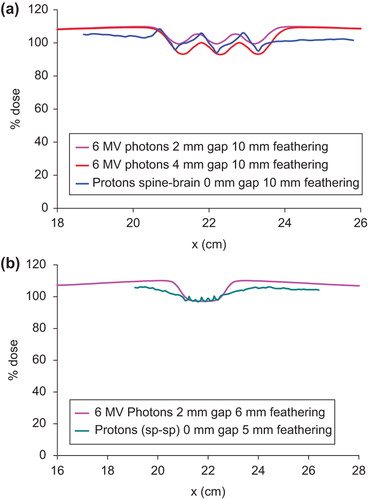
compares selected proton and photon dose profiles in the gap between the brain and the spine fields. For ease of comparison, the photon profiles are shifted in the x-axis to match those of the proton profiles. It can be seen that the proton dose profile with 0 mm gap and 10 mm feathering lies between the photon profiles with 2 mm and 4 mm gap widths and 10 mm feathering. On the other hand, the proton dose profile in the moving gap between the spine fields with 0 mm gap and 5 mm feathering is almost identical to that of 6 MV photons using 2 mm gap and 6 mm feathering (). By appropriately selecting the gap width and feathering step size, similar dose profiles between proton and photon fields can be produced in the moving gap in CSI.
Figure 6. Comparison of proton and photon dose profiles in the moving gap between the brain and the spine fields. The proton profiles are shifted to match with the photon profiles for ease of comparison. (a) Matching proton profile with 0 mm gap and 10 mm feathering with selected gap and feathering widths for 6 MV photons. (b) Matching proton profile with 0 mm gap and 5 mm feathering with a selected gap and feathering widths for 6 MV photons.
Discussion
Recently, a field-in-field (FIF) technique has been reported for photon CSI in which the junction dosimetry is automatically modulated using a multi-leaf collimator (MLC), thus eliminating the need for daily (or weekly) manual feathering [Citation18]. One advantage of this FIF technique is that only one cranially located setup point is used. All fields are delivered according to their relationship to this setup point, minimizing the effect of dose overlap. Phantom study showed that the FIF technique has improved dose conformality and reduced dose inhomogeneity in the junction [Citation18].
On the other hand, MLC is available in only few proton centers in the world but with many concerns [Citation19]. The conventional moving gap technique is still the method of choice for proton CSI. At issue here is the ease and reproducibility of setup and patient comfort, in addition to dosimetry in the moving gap. The supine setup adopted at the IUHPTC has proved to be especially advantages for anesthesiologists and nursing staff. The patient is placed in a comfortable position throughout the treatment, ensuring reproducibility with standard immobilization techniques, such as a mask and a body alpha cradle mold.
Dosimetrically, it is shown in this study that the dose in the moving gap region is determined by the width of the gap and the feathering step size. As expected, relative dose increases with decreasing gap size. On the other hand, relative dose increases with increasing feathering step size. With 0 mm gap width, the dose distribution in the moving gap is around 100% for both 5 mm and 10 mm featherings. As the field gap increases or as the feathering step size decreases, the dose in the moving gap decreases.
A distinct feature of the dose profiles in the moving gap region is that they exhibit peaks and valleys. As illustrated in and and discussed above, the structures observed in the moving gap region are the sum effects of the lateral penumbra, gap width and feathering step size. For the proton spine fields that have 2 mm penumbra, hot match between the adjacent spine fields produces a series of peaks and valleys all of which are around 100%, for both the 5 mm and 10 mm feathering steps. However, when field gap is comparable or larger than at least one of the penumbras of the fields, larger dose variations are produced inside the moving gap due to the varying contribution of the penumbra, the uniform portion of the profile and the tail of the profile. In three successive days of irradiation with two featherings, the dose in each field gap is contributed by the initial penumbra of the two adjacent fields, the uniform dose portion of the profiles in the two successive days and the tails of the profiles.
The dosimetry in the moving gap for 6 MV photons follows a similar pattern as that for protons except the magnitude. For 5 mm feathering, the dose in the moving gap region is ≤80% except for the 0 mm and 2 mm gaps, since the penumbra for the 6 MV field is 7 mm. Field feathering merely moves portion of the penumbra into the gap. With 10 mm feathering, the dose in the moving gap improves substantially especially when the gap width is smaller than the penumbra, as a small portion of the horn in the profile extends into the gap.
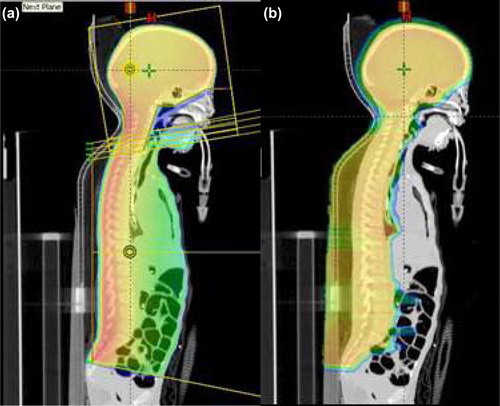
The dose in the moving gap is similar between photon and proton CSI in that with appropriate combinations of gap width and feathering step size, the dose profile for 6 MV photons can be made to match a given proton dose profile in the moving gap. and b are just two examples of such comparisons. The difference between photon and proton CSI is in the overall dose distributions inside the patient. The exit dose in photon CSI results in considerable dose to the mediastinum and the abdomen, whereas it is practically zero for proton beams (). It should be pointed out that the field outlines in shows the different feathering fields used. The blocks are deleted to show the cranial dose distributions.
Figure 7. Comparison of dose distributions in (a) photon and (b) proton CSI. The advantage of proton CSI is the absence of exit dose in the thorax region.
Conclusion
This dosimetric study using proton beam for CSI in the moving gap region has shown that the dose in the moving gap region is determined by the lateral penumbras of the fields, the width of the gap and the feathering step size. In general, the use of a gap between two fields tends to cool down the dose in the gap region. The choice of a feathering step size comparable to or larger than the lateral penumbra of the fields will increase the dose in the moving gap. As a rule of thumb, the relative dose in the gap increases with decreasing gap size, and also increases with increasing feathering step size. Thus it is possible to estimate the dose in the moving gap from knowledge of these three factors. By properly combining gap width and feathering step size for a given lateral penumbra, it is possible to maintain 100% dose in the moving gap region as shown in this study.
Declaration of interest: The authors report no conflicts of interest. The authors alone are responsible for the content and writing of the paper.
References
- Cheng CW, Das IJ Chen DJ. Dosimetry in the moving gap region in craniospinal irradiation. Br J Radiol 1994; 67:1017–22.
- Chang EL, Allen P, Wu C, Ater J, Kuttesch J Maor MH. Acute toxicity and treatment interruption related to electron and photon craniospinal irradiation in pediatric patients treated at the University of Texas M. D. Anderson Cancer Center. Int J Radiat Oncol Biol Phys 2002;52:1008–16.
- Kalifa C Grill J. The therapy of infantile malignant brain tumors: Current status? J Neurooncol 2005;75:279–85.
- Merchant TE, Hua CH, Shukla H, Ying X, Nill S Oelfke U. Proton versus photon radiotherapy for common pediatric brain tumors: comparison of models of dose characteristics and their relationship to cognitive function. Pediatr Blood Cancer 2008;51:110–117.
- Merchant TE, Pollack IF Loeffler JS. Brain tumors across the age spectrum: Biology, therapy, and late effects. Semin Radiat Oncol 2010;20:58–66.
- Slampa P, Pavelka Z, Dusek L, Hynkova L, Sterba J, Ondrova B, . Longterm treatment results of childhood medulloblastoma by craniospinal irradiation in supine position. Neoplasma 2007;54:62–87.
- Lee C, Bilton S, Famiglietti R, Riley B, Mahajan A, Chang E, . Treatment planning with protons for pediatric retinoblastoma, medulloblastoma, and pelvic sarcoma: How do protons compare with other conformal techniques? int J Radiat Oncol Biol Phys 2005;63:362–72.
- St. Clair WH, Adams JA, Bues M, Fullerton BC, La Shell S, Kooy HM, . Advantage of protons compared to conventional X-ray or IMRT in the treatment of a pediatric patient with medulloblastoma. Int J Radiat Oncol Biol Phys 2004;58:727–34.
- Yuh GE, Loredo LN, Yonemoto LT, Bush DA, Shahnazi K, Preston W, . Reducing toxicity from craniospinal irradiation: Using proton beams to treat medulloblastoma in young children. Cancer J 2004;10:386–90.
- Mu X, Bjork-Eriksson T, Nill S, Oelfke U, Johansson KA, Gagliardi G, . Does electron and proton therapy reduce the risk of radiation induced cancer after spinal irradiation for childhood medulloblastoma? A comparative treatment planning study. Acta Oncol 2005;44:554–62.
- Cochran DM, Yock TI, Adams JA, Tarbell NJ. Radiation dose to the lens during craniospinal irradiation – an improvement in proton radiotherapy technique. Int J Radiat Oncol Biol Phys 2008;70:1336–42.
- Moeller BJ, Chintagumpala M, Philip JJ, Grosshans DR, McAleer MF, Woo SY, . Low early totoxicity rates for pediatric medulloblastoma patients treated with proton radiotherapy. Radiat Oncol 2011;6:58.
- Taddei PJ, Mahajan A, Mirkovic D, Zhang R, Giebeler A, Kornguth D, . Predicted risks of second malignant neoplasm incidence and mortality due to secondary neutrons in a girl and boy receiving proton craniospinal irradiation. Phys Med Biol 2010;55:7067–80.
- Taddei PJ, Mirkovic D, Fontenot JD, Giebeler A, Zheng Y, Titt U, . Reducing stray radiation dose for a pediatric patient receiving proton craniospinal irradiation. Nucl Technol 2009;168:108–12.
- Wroe A, Clasie B, Kooy H, Flanz J, Schulte R Rosenfeld A. Out-of-field dose equivalents delivered by passively scattered therapeutic proton beams for clinically relevant field configurations. Int J Radiat Oncol Biol Phys 2009; 73:306–13.
- Clasie B, Wroe A, Kooy H, Depauw N, Flanz J, Paganetti H, . Assessment of out-of-field absorbed dose and equivalent dose in proton fields. Med Phys 2010;37:311–21.
- Farr JB, Mascia AE, Hsi WC, Allgower CE, Jesseph F, Schreuder AN, . Clinical characterization of a proton beam continuous uniform scanning system with dose layer stacking. Med Phys 2008;35:4945–54.
- Yom SS, Frija EK, Mahajan A, Chang E, Klein K, Shiu A, . Field-in-field technique with intrafractionally modulated junction shifts for craniospinal irradiation. Int J Radiat Oncol Biol Phys 2007;69:1193–8.
- Moskvin V, Cheng CW, Das IJ. Pitfalls of tungsten multi- leaf collimator in proton therapy. Med Phys 2011;38: 6397–6406.