Abstract
Introduction. Our primary aim was to make a phantom for PET that could mimic a highly irregular tumour and provide true tumour contours. The secondary aim was to use the phantom to assess the accuracy of different methods for delineation of tumour volume from the PET images. Material and methods. An empty mould was produced on the basis of a contrast enhanced computed tomography (CT) study of a patient with a squamous cell carcinoma in the head and neck region. The mould was filled with a homogeneous fast-settling gel that contained both 18F for positron emission tomography (PET) and an iodine contrast agent. This phantom (mould and gel) was scanned on a PET/CT scanner. A series of reference tumour contours were obtained from the CT images in the PET/CT. Tumour delineation based on the PET images was achieved manually, by isoSUV thresholding, and by a recently developed three-dimensional (3D) Difference of Gaussians algorithm (DoG). Average distances between the PET-derived and reference contours were assessed by a 3D distance transform. Results. The manual, thresholding and DoG delineation methods resulted in volumes that were 146%, 86% and 100% of the reference volume, respectively, and average distance deviations from the reference surface were 1.57 mm, 1.48 mm and 1.0, mm, respectively. Discussion. Manual drawing as well as isoSUV determination of tumour contours in geometrically irregular tumours may be unreliable. The DoG method may contribute to more correct delineation of the tumour. Although the present phantom had a homogeneous distribution of activity, it may also provide useful knowledge in the case of inhomogeneous activity distributions. Conclusion. The geometric irregular tumour phantom with its inherent reference contours was an important tool for testing of different delineation methods and for teaching delineation.
There are many reports on the added value of a positron emission tomography (PET) scan to computed tomography (CT) in radiotherapy planning and the close connection between PET and molecular biology is becoming more important as new radiation treatment techniques evolve [Citation1–3]. For pharyngolaryngeal cancers it was demonstrated that FDG-PET resulted in a gross tumour volume (GTV) that showed the best agreement with surgical specimen and was smaller than GTVs obtained from CT or magnetic resonance imaging (MRI) [Citation4]. A study by Rothschild and co-workers indicated improved outcome of patients with locally advanced pharyngeal carcinoma treated with intensity modulated radiation therapy (IMRT) after planning based on combined PET/CT as opposed to planning based on CT alone [Citation5].
There are many reasons why tumour delineation from PET images is challenging. The biological uptake may be inhomogeneous, the tumour may move with respiration and swallowing during image acquisition, and the images were until recently associated with a poor geometrical resolution (a wide effective point spread function, PSFeff) resulting from scanning, reconstruction and post-reconstruction filtering. The result is an intensity diffusion [Citation6] of the true distribution of radioactivity that blurs the tumour edges thereby making them difficult to define. If the voxel size used in the image reconstruction is too large, this also adds to the problem of defining the exact edge. The ground truth for the tumour extension cannot be reliably defined on the basis of other imaging modalities either and it has not in general been possible to provide a feedback to the radiation oncologist or nuclear medicine specialist regarding how accurately the GTV has been drawn on PET images.
Many groups have worked on the problem of accurate delineation of tumour volumes based on FDG-PET images. The delineation methods have recently been reviewed by Zaidi and Naqa [Citation7]. Manual delineation and thresholding techniques are commonly implemented on nuclear medicine workstation. Manual methods show large inter- and intra-observer variability [Citation8] whereas automatic methods, e.g. gradient-based methods and adaptive region-growing or dual-front active contours, require advanced image processing not readily available [Citation9,Citation10]. A comparison of five different relative simple methods for tumour delineation in patients with head and neck tumours was carried out by Schinagl et al. [Citation11] and demonstrated significant differences between the delineated volumes. A study by Hatt et al. [Citation12] investigated repeated PET scans and repeated automatic and manual delineation and found relatively large variability, largest for manual delineation.
Since the true extent of the tumour is generally unknown, it can be appropriate to use phantoms that represent the tumour. Most phantoms described in the literature that have been used to test methods for tumour delineation, have contained simple spherical or cylindrical objects filled with homogeneous activity concentration [Citation13]. Recently more advanced models have been developed that allow irregular tumours to be made using zeolites that absorb 18F-FDG [Citation14].
The primary aim of the present work was to make a PET phantom that simulated a realistic geometrically irregular tumour where the true (reference) tumour contours could be derived and be available in the same geometrical frame of reference as the PET image volume. The second aim was to use the phantom to study the accuracy of a recently developed automatic delineation algorithm and compare it to the accuracy of two standard delineation methods: manual drawing and delineation based on the use of standardised uptake value (SUV), denoted isoSUV thresholding. In all these methods, the contours of the tumour volume were identified from the PET image volumes.
Material and methods
A series of contrast-enhanced CT images of the neck that originated from a patient with a recently diagnosed head and neck squamous cell carcinoma was selected as the basis for the gel tumour phantom. The images had been reconstructed with a slice thickness of 2 mm and an image format of 512 × 512 pixels. A highly experienced radiation therapy oncologist manually drew tumour contours in each of the CT images. The contours were scaled to true size and transferred to a series of 2 mm thick sheets of expanded PVC (Vikupor, Vink Plast AS, Oslo, Norway). A heated metal thread was used to cut out the tumour areas from the PVC plates. A reference position was marked in the corner of each plate so that they could be stacked to form a mould and preserve the three-dimensional (3D) geometry that had been drawn based on CT (). Note that these contours only served to form a realistic irregular tumour. It was never the purpose of the present work to derive an exact replica of the patient's tumour. Mechanical pressure was applied to the stack of plates to avoid leakage when the empty mould later was filled with a fast settling gel material.
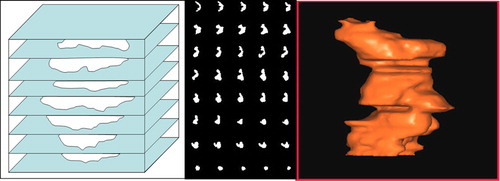
Figure 1. The tumour contours drawn by the oncologist were transferred to vikupor plates and the tumour areas were cut out. The sequence of plates formed a mould (left) that was filled with a mixture of 18F and iodine contrast medium in a gel that solidified in 10 minutes. Based on CT-scans of the phantom, the sequence of 40 reference tumour areas (middle) was found. The volume rendering of the geometrically highly irregular tumour volume (right) is based on the CT contours of the tumour manually drawn in the Oncentra radiation treatment planning system.
The gel was produced as follows: An initial volume of 100 ml of demineralised water also containing 18F-solution (target washing water, Norwegian Medical Cyclotron Centre, containing mainly the ionic form of 18F) was prepared and 1 ml iodine contrast agent (Visipaque, 270 mg I/ml, GE Healthcare, Oslo, Norway) added. Then the gel powder (Orthoprint, Zhermack Clinical, Badia Polesine, Italy) was added to the solution, 10 g powder to 100 ml of water. We used a higher percentage of water than recommended for its intended dental use by the vendor to make sure that the mixture had a suitable viscosity for our purpose and would still settle in ten minutes. Care was taken to avoid air bubbles while mixing the components with a propeller. The gel was drawn into a 20 ml syringe and injected into the empty space in the mould of the phantom. The injection was started from the bottom and the syringe moved upward as the volume filled. The activity concentration was 15 kBq/ml at scanning time. To relate this quantity to a patient examination it can be shown that one hour after injection of 400 MBq 18F-labelled compound, the above activity concentration would correspond to SUV values equal 5.5 and 7.9 for patients weighing 100 kg and 70 kg, respectively. It is possible to re-use the mould because after some days the gel dries and can be easily removed.
After the gel had settled the gel phantom (gel and PVC mould) was positioned on the examination table of the PET/CT-scanner (Biograph 64, Siemens, Erlangen, Germany). The CT study was obtained with 300 mAs, 100 keV, slice thickness 1 mm and image format 512 × 512 with pixel size 0.58 × 0.58 mm2. A 10 minute PET scan and subsequent reconstruction were carried out using the following imaging and reconstruction parameters: image format 256 × 256, voxel size 1.33 × 1.33 × 1.0 mm3, attenuation correction using the above CT scan and OSEM with four iterations and eight subsets. Two different PET image volumes were created with different effective geometric resolution powers, resulting from the use of post-reconstruction Gaussian filters that had full-widths-at-half-maximum (FWHM) equal to 3.5 mm and 5.0 mm, respectively. These series will be denoted by PET35 and PET50 in the following paragraphs. The PET reconstruction was matched to the CT in such a way that the PET and CT volumes had the same image plane positions and (formal) slice thickness (1.0 mm).
The PET and CT images were transferred as DICOM files to the radiation treatment planning system Oncentra External Beam (Nucletron, Veenendal, The Netherlands) for manual drawing of tumour contours. In the Oncentra target delineation module the CT images were set to define the geometrical frame of reference. A surface rendered display ( – right panel) of the gel volume produced in Oncentra on the basis of contours drawn in the CT images demonstrates the highly irregular form of the phantom. The Oncentra PET/CT image fusion software was then used by an experienced nuclear medicine specialist (seven years of experience with PET/CT) to manually delineate tumour contours in the PET35 and PET50 image volumes. No CT information was shown during the drawing, and the contours were drawn based on the halo-phenomenon described by Ashamalla et al. [Citation15,Citation16]. The halo-principle for tumour delineation is a manual drawing method based on PET images. With this method the tumour contours are visually defined by the distinct, narrow halo with moderate increased FDG-uptake compared to the surrounding normal tissue, but distinct lower than the tumour uptake itself. The halo principle for tumour delineation has been described by Ashamalla et al. for head and neck cancer and for lung cancer. They reported the standard uptake value (SUV) in the halo to be around 2.2 for head and neck tumours, which on average in 25 patients was 24% of the maximum SUV of the tumour. The average width of the halo was 2 mm. The Oncentra fusion software inherently scaled the PET images to the image format and pixel size of the CT images, i.e. the manually drawn contours were created in the frame of reference of the CT images.
All the further comparisons and image processing were carried out by use of the interactive programming tool IDL (Exelis Visual Information Solutions, Boulder, USA) particularly suitable for image analyses and processing. The manually drawn contours (in the form of DICOM RT structure sets) were exported from Oncentra to the PC where the IDL tool was available.
For simplicity, in the following the gel volume will be referred to as the ‘tumour volume’ and the surrounding Vikupor material will be referred to as ‘normal tissues’.
The images obtained with the phantom were used to test a new method for automatic delineation of a tumour and compare its performance with that of manual delineation on the Oncentra system and with an isoSUV threshold delineation. The general approach for comparing the delineation methods was first to establish a set of binary tumour area images (BTIs) in the geometric reference system of the PET images. In a BTI pixels within the tumour area were assigned the value 1 and the rest (i.e. normal tissue) were set to 0. From the BTIs a corresponding series of binary contour images (BCIs) were established by use of the Roberts gradient operator [Citation17]. The BTI formed the basis for calculation of tumour volumes and the BCI formed the basis for calculation of average distances between the reference (CT-based) contours and the contours and surfaces derived from the PET images. The Appendix gives a detailed explanation of how the various BTIs and BCIs were created (Supplementary Appendix available online at http://informahealthcare.com//doi/abs/10.3109/0284186X.2012.718095).
The automatic delineation method is based on the identification of the zero crossings (see ) of the expression
Figure 2. A demonstration of the Difference of Gaussians (DoG) identification of the edge of a homogeneous tumour is shown. As a consequence of scanning, image reconstruction and post-reconstruction filtering, the ideal intensity distribution, A, is convolved with the Gaussian point spread function to give the distribution B. A further convolution with the point spread function, carried out by computer processing, gives the distribution C. The difference B-C has its zero crossing at the edge (arrow). In this illustration, the distributions are functions of one coordinate (x) only. In the actual DoG algorithm, the distributions as well as the point spread functions are 3D entities.
where the vector r points to a voxel inside the image volume. PSFeff is the effective 3D point spread function resulting from data acquisition, image reconstruction and post-reconstruction filtering of the PET image volume and ‘*’ denotes mathematical convolution. B(r) is the image intensity distribution within the PET image volume. The 3D PSFeff had been very accurately measured for the two different choices of post-reconstruction filters used in the present work [Citation18]. Refer to the Appendix for explanation of the theoretical background and to for an illustration of the basic principle. The method is similar to the Difference of Gaussians presented by Marr and Hildreth [Citation19] and will hence be referred to as the DoG algorithm.
The following image sets were created and used in the subsequent analysis:
1. From the CT images:
a. BTIref and BCIref.
2. From the PET images:
a. BTIman and BCIman
b. BTIisoSUV and BCIisoSUV
c. BTIDoG and BCIDoG.
The complete sequence of BCIs form a 3D surface and will be denoted BSIref, BSIman, BSIisoSUV, and BSIDoG accordingly. An illustration of a BTI and the derived BCI is shown in . In the following, the terms BTIPET, BCIPET and BSIPET will be used to shorten the notation when appropriate.
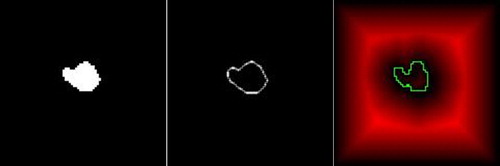
Figure 3. Illustration of the images involved in the calculation of average distance between the (correct) reference contour and the contour determined from the corresponding PET image. The tumour area (left) determined from PET is used to find the PET-derived tumour contour image (middle) that forms the basis for computation of the distance image (red parts of the right image). Each pixel in this image contains the distance to the nearest PET-derived contour. The CT-derived reference contour image (green) is superimposed on this image and distances sampled under each point of this contour. Finally, the average (rms) distance is calculated (refer to text).
In clinical practise margins are added to the GTV to ensure that microscopic tumour cells not visible in the images will be included in the high dose volume. To measure the effect on the volumetric accuracy of adding a margin to the DoG-derived volume, the derived BSIDoG was expanded with one voxel over its entire surface. This was achieved by a dilation operation [Citation20] on the BTIDoG.
To assess the accuracy of the different delineation methods, (average) root-mean square (rms) geometrical distance deviations between on one hand the BCIref and BSIref , and on the other hand the BCIPET and BSIPET, were calculated. The average distances between each individual image BCIref and BCIPET were calculated (2D), as well as between the BSIref and BSIPET (3D). In the 2D case () the calculations started by performing a distance transform [Citation21] of each BCIPET to create distance images where the image pixel values represented the distance to the closest point on the contour of the associated BCIPET. For each distance image the corresponding BCIref was superimposed and the distance values under the BCIref pixels were sampled. Thus for each contour point in BCIref the distance to the nearest contour point of BCIPET was found. Finally, an average distance for the actual slice was calculated as the root of the mean of the squared (rms) distances.
The determinations of average deviations were also performed in 3D: A 3D distance transform of the BSIPET gave the shortest distance from any voxel in space to the surface of BSIPET. As in the 2D case, the (unsigned) distances were sampled at each point on BSIref and rms average distance calculated. Since the slice thickness was smaller (1.0 mm) than the axial voxel dimensions (1.33 × 1.33 mm2), the distances extracted from the 3D distance transform cannot be directly converted to millimetre dimensions (the conversion factor is somewhere between 1.0 and 1.33). In the present study, the maximum factor 1.33 was chosen for these calculations.
Tumour volumes were calculated for each of the delineation methods applied to the PET35 and PET50 image volumes by simply counting the number of pixels with a value equal to 1 in the BTIPETs followed by a multiplication by the volume of a voxel.
Furthermore, based on the BTIs of the different delineation methods, a second set of measures were calculated to characterise how well the PET-based delineated volumes covered the reference (correct) tumour volume, and how much surrounding normal tissues were erroneously defined to be tumour. This was carried out as follows: A new set of images were created from BTIref in which the tumour pixels were set equal to 2 (BTIref2). These new images were subsequently added to the BTIPET. In the resulting image volume sets, voxels having a value equal to 3 identified the amount of reference tumour volume included by the PET based delineation, voxels having a value 2 represented the tumour volume missed, and voxels having a value of 1 represented the normal tissue volume included.
Results
Examples of delineation of the tumour in the PET35 series with different methods are shown in and . The BCIDOG (green), BCIman(blue) and BCIisoSUV (black) in one slice are all shown on one image row with the BCIref (red) superimposed. In the first position of the row the corresponding PET image and the BCIref are shown. The sequence of rows shows that the 3D DoG algorithm performs better than both the manual method and the isoSUV segmentation at 50% of the SUVpeak. Abrupt changes of the tumour contour as a function of axial position is better handled by the DoG algorithm than by the other methods tested. Note that the manual method systematically overestimates the tumour areas. All the methods to various degrees miss some of the small and thin protruding parts of (what would have been) the macroscopic tumour. Such structures are most often also missed by the isoSUV delineation. The BSIDOG follows the BSIref very well. Even when there is a seemingly miss, the contour is in correct position again in the neighbouring slice (i.e. 1 mm apart). shows the numerical data for the different delineation methods and geometric resolution power used. The magnitudes of the calculated tumour volumes support the impressions that one gets from a visual comparison of the contours: For the PET35 case, the DoG results in a volume of 11.19 ml, or 99% of the reference volume of 11.28 ml, the manual drawing results in a too large volume (16.51 ml or 146%), while the isoSUV thresholding results in a too small volume (9.66 ml or 86%). Also shown are the average rms distances between the contours derived by different methods from the PET images and the reference contours. Applied to the PET35 series the DoG algorithm performs better (0.84–1.54 mm) compared with the manual drawing (1.26–3.21 mm) and isoSUV thresholding (0.92–2.69 mm) methods. The average 3D rms distances are also the smallest for the DoG technique (1.0 mm), followed by 1.57 mm and 1.48 mm for the manual and isoSUV methods, respectively. Again note that the slice thickness is different from the axial voxel size.
Figure 4. An illustration of the performances of different methods for tumour delineation based on PET is shown. The reference contour (red) is drawn into the PET-images, and as references for delineation based on the Difference of Gaussians (DoG) (green), manual delineation (blue) and 50% of SUVpeak isocontour delineation (black). Moving from the upper to the lower row, three consecutive slices 1 mm apart are shown. The DoG-derived contours follow the reference very closely. Manual drawing was not capable of excluding the contributions from the sources that came into focus in the lower row, and there was a tendency to exclude thin protruding parts of the tumour. IsoSUV delineation in general was imprecise and also excluded the thinner protruding parts.
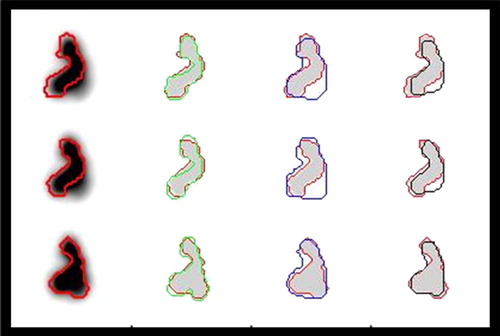
Figure 5. Illustration of the performances of different methods for tumour delineation based on PET. The reference contour (red) is drawn into the PET-images, and as references for delineation based on the Difference of Gaussians (DoG) (green), manual delineation (blue) and 50% of SUVpeak isocontour delineation (black). Moving from the upper to the lower row, four consecutive slices 1 mm apart are shown. The DoG-derived contours in row 3 are here too wide, but is correct 1 mm further up in the phantom. The isoSUV delineation here misses large parts of the protruding parts (top and second row).
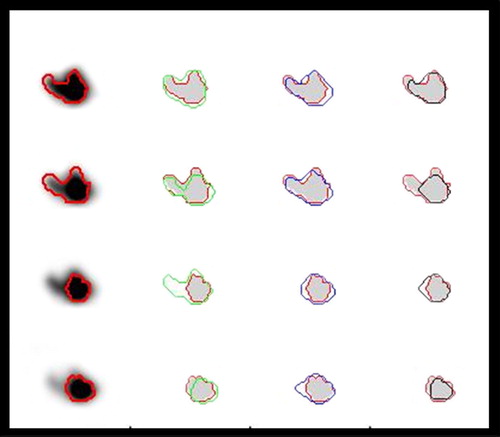
Table I. Calculated volumes and average distance deviations for different kinds of 'tumour’ delineation methods: Difference of Gaussians (DoG), manual drawing (MAN), thresholding at 50% of SUVpeak (isoSUV). ‘Expanded’ means that the calculated volume was expanded with one voxel along its entire surface. The table shows the total tumour volumes calculated and – based on the (correct) reference outlines – the percentages of tumour volume included, tumour volume missed and normal tissue volume included. The image volumes PET35 and PET50 were reconstructed with post-reconstruction Gaussian filters that had widths at half maximum (FWHM) of 3.5 and 5.0 mm, respectively. The maximum and minimum rms distance deviations were calculated for each slice individually (2D), extracting the values from the slice range from 10 to 38, and for the entire tumour surface (3D). In the 3D case voxel size was 1.33 × 1.33 × 1.0 mm, but the table lists distances calculated as if the slice distance had been 1.33 mm.
also shows the results obtained for the PET50 series and for the case where a margin of one voxel thickness was added along the entire DoG-derived surface of the tumour. When DoG delineation is done on the basis of the PET50 series, the distance deviations increase only moderately (from 1.0 to 1.05 mm based on the 3D distance transform procedure) and the increase in the magnitude of the delineated volume is also moderate (from 11.19 to 12.03 ml).
also lists the tumour volume included, the tumour volume missed and the normal tissue volume. The results show large variations between the different delineation methods, e.g. the tumour volume included as a result of DoG delineation on PET35 was 86% and 13% normal tissues was included. Expanding with one voxel changed these values to 1% and 51%. The corresponding percentages for manual delineation were 4% and 45%, respectively.
Discussion
The highly geometrically irregular tumour phantom was shown to be an effective tool for testing of methods for delineation of GTV. Its use has demonstrated and characterised weaknesses of two methods for tumour delineation in common clinical use (manual drawing based on the halo-phenomenon and SUV based thresholding). The results indicate that a new and relatively simple gradient based (Difference of Gaussians) approach performs better. Ideally, the phantom should contain a background and the activity should be non-uniformly distributed, possibly also including a simulated necrotic region. However, the weaknesses of the delineation methods observed with a uniform distribution may also be expected with non-uniform distributions. Thus, experience gained with the present phantom and delineation methods provides a basis for further development of the latter.
A straight forward extension of the present work would be to add software to systematically modify the PET35 or PET50 image volumes to have background activity and non-uniform activity distribution. With the present phantom as a basis, more realistic physical phantoms may be produced by adding different kinds of inactive filling materials to the gel. Such work is outside the scope of the present article. Phantoms entirely based on software simulation have also been made [Citation22]. However, one advantage of the present phantom is that it allows for inclusion of the entire imaging and image reconstruction routines in the test of delineation methods.
The activity concentration used (15 kBq/ml) would correspond to a SUV value of 5–8 depending on the patients weight assuming an injected dose of 400 MBq. If the tumour uptake is lower or if less activity had been injected, one would get an increase in image noise which may also affect the contours that the algorithm produces.
The present work was a limited feasibility study and a pilot project including one tumour model only, and we have not tested the inter- and intra-observer variability of the manual drawing. Nevertheless, the differences in results between the methods tested are so large and characteristic that we consider them representative for the methods. From the small comparison described above, it may be generally concluded that the manual delineation in PET images of tumours that have a highly irregular shape is inaccurate () as is also simple isoSUV thresholding methods. Typically, when using the halo for delineation the main tendency is to draw the contours too wide, but at the same time fail to include narrow parts that protrude from the tumour. Abrupt changes of the tumour contour from one slice to the next are taken into account in a better way by the DoG method because it works in three dimensions.
The present gel phantom has already served as an important training tool for physicians who use PET to delineate gross tumour volumes in radiotherapy planning. Valuable experience has been gained that has increased the awareness of possible errors that arise when using the standard delineation methods.
There is surprisingly little difference between the results obtained with the PET35 and PET50 image sets (i.e. the use of post-reconstruction filters with widths (FWHM) equal 3.5 mm and 5.0 mm, respectively). The volumes and distance deviations derived for the PET50 data set are only slightly higher compared to the PET35. An interesting aspect of this finding is that a wider Gaussian post-reconstruction filter would be more effective in suppressing noise in calculation of the expression B(r)*Peff (Equation 1). This convolution corresponds to a matched filter [Citation23] that is known to optimise the signal-to-noise ratio (SNR). A wider post- reconstruction filter also suppresses noise in B(r). The further characterisation of the effects of geometrical resolution, e.g. related to tumour size is outside the scope of the present work.
The present version of the DoG algorithm is quite crude. The image processing methods used both in establishing the reference contour images from the CT-images, in downscaling the images from CT format to PET image format, and in establishing the zero-crossing in the DoG filtered images, are all subject to errors. The errors of the present processing may amount to the order of one voxel, mainly as random errors. These errors should be born in mind also when considering the magnitudes of the volumes calculated. Improvements could be expected from subvoxel interpolation in all of these processing stages.
The three parameters calculated in the present work: tumour volume included, tumour volume missed and normal tissue included, describe the coverage of the tumour by radiation treatment and the degree of normal tissue irradiation. The results summarised in tell that if a conformal volume could be formed around the PET-derived contours, a significant part of the reference volume (22%) is missed if delineation was made by the isoSUV-method used here (threshold at 50% of SUVpeak). On the other hand, only a very small volume (8% of the reference volume) of normal tissue would get unnecessary irradiation. With the manual drawing, the volume defined is much too large (146% of the reference volume). Event though 96% of the tumour volume is included, a significant volume of normal tissue (equal to 50% of the reference volume) would be irradiated. The results demonstrate that the errors would be smallest if delineation was performed using an automated delineation method such as the DoG algorithm presented here.
It should be noted that even the DoG derived volume does not include the entire tumour. Even when one voxel (1.33 mm) was added along the entire DoG-derived surface, a small tumour volume was missed (1%). These errors might be connected with the image processing errors described above, and may also indicate the minimum extent of margins required to encompass the complete GTV in clinical practise.
Since in the present work the true tumour surface (the reference) was accurately known, it was considered more relevant to look at the deviation from this surface than to assess similarity as is done with the DICE coefficients [Citation24]. The method used in the present work rests on the use of the distance transforms in two and three dimensions, sampling the distances at the reference (true) contours/surface. To obtain a parameter similar to the standard deviation, we calculated the rms distances in stead of the average distances. Obviously, because abrupt contour changes are taken into account in the 3D distance transform, this parameter is considered most representative. The maximum and minimum distance deviations calculated for any single slice only indicate the range of deviations from the true contours.
For use in radiotherapy planning it is possible to transform the PET contours delineated with the DoG method (BCIDoG) into the sequence of coordinates that are needed in a DICOM RT structure set to represent the tumour surface. In addition, a tool has to be developed to allow the oncologist to manually change the contours when this is needed based on experience including e.g. knowledge of routes of local tumour spread. However, the work of looking through the slices and possibly modifying the automatically extracted contours at some points is considerable much less time consuming than drawing all the contours manually. The presented results also indicate that the overall accuracy can be expected to be better than for delineation based on thresholding or manual drawing. An important advantage of the DoG algorithm is that it is independent on the operator. Taken together this might reduce the large inter- and intra-observer variations reported in the literature [Citation8,Citation25].
Conclusion
The gel tumour (phantom) provides a possibility to perform training in manual delineation, and to aid development and verification of computer-based methods for tumour delineation. It is essential for such work that the CT images provide the true outlines of the tumour. The automatic algorithm described in the present work performs well in delineating the gel tumour, but has to be tested under more realistic conditions including non-homogeneous activity distribution, variable background and more pronounced noise.
Supplementary Appendix
Download PDF (180.1 KB)Declaration of interest: The authors report no conflicts of interest. The authors alone are responsible for the content and writing of the paper.
References
- Gregoire V, Chiti A. Molecular imaging in radiotherapy planning for head and neck tumors. J Nucl Med 2011;52:331–4.
- Gregoire V, Haustermans K, Geets X, Roels S, Lonneux M. PET-based treatment planning in radiotherapy: A new standard?J Nucl Med 2007;48:68s–77s.
- Nestle U, Weber W, Hentschel M, Grosu AL. Biological imaging in radiation therapy: Role of positron emission tomography. Phys Med Biol 2009;54:R1–25.
- Daisne JF, Duprez T, Weynand B, Lonneux M, Hamoir M, Reychler H, . Tumor volume in pharyngolaryngeal squamous cell carcinoma: Comparison at CT, MR imaging, and FDG PET and validation with surgical specimen. Radiology 2004;233:93–100.
- Rothschild S, Studer G, Seifert B, Huguenin P, Glanzmann C, Davis JB, . PET/CT staging followed by intensity-modulated radiotherapy (IMRT) improves treatment outcome of locally advanced pharyngeal carcinoma: A matched-pair comparison. Radiat Oncol 2007;2:22.
- Skretting A. ‘Intensity diffusion’ is a better description than ‘partial volume effect’. Eur J Nucl Med Mol I 2009;36:536–7.
- Zaidi H, El Naqa I. PET-guided delineation of radiation therapy treatment volumes: A survey of image segmentation techniques. Eur J Nucl Med Mol I 2010;37:2165–87.
- Breen SL, Publicover J, De Silva S, Pond G, Brock K, O’Sullivan B, . Intraobserver and interobserver variability in GTV delineation on FDG-PET-CT images of head and neck cancers. Int J Radiat Oncol 2007;68:763–70.
- Geets X, Lee JA, Bol A, Lonneux M, Gregoire V. A gradient-based method for segmenting FDG-PET images: Methodology and validation. Eur J Nucl Med Mol I 2007;34:1427–38.
- Li H, Thorstad WL, Biehl KJ, Laforest R, Su Y, Shoghi KI, . A novel PET tumor delineation method based on adaptive region-growing and dual-front active contours. Med Phys 2008;35:3711–21.
- Schinagl DAX, Vogel WV, Hoffmann AL, Van Dalen JA, Oyen WJ, Kaanders JHAM. Comparison of five segmentation tools for 18 F-fluoro-deoxyglucose-positron emission tomography-based target volume definition in head and neck cancer. Int J Radiat Oncol 2007;69:1282–9.
- Hatt M, Rest CCL, Aboagye EO, Kenny LM, Rosso L, Turkheimer FE, . Reproducibility of F-18-FDG and 3 ‘-deoxy-3 ‘-F-18-fluorothymidine PET tumor volume measurements. J Nucl Med 2010;51:1368–76.
- Brambilla M, Matheoud R, Secco C, Loi G, Krengli M, Inglese E. Threshold segmentation for PET target volume delineation in radiation treatment planning: The role of target-to-background ratio and target size. Med Phys 2008;35:1207–13.
- Matheoud R, Secco C, Ridone S, Inglese E, Brambilla M. The use of molecular sieves to simulate hot lesions in (18)F-fluorodeoxyglucose - positron emission tomography imaging. Phys Med Biol 2008;53:N137–48.
- Ashamalla H, Guirgius A, Bieniek E, Rafla S, Evola A, Goswami G, . The impact of positron emission tomography/computed tomography in edge delineation of gross tumor volume for read and neck cancers. Int J Radiat Oncol 2007;68:388–95.
- Ashamalla H, Rafla S, Parikh K, Mokhtar B, Goswami G, Kambam S, . The contribution of integrated PET/CT to the evolving definition of treatment volumes in radiation treatment planning in lung cancer. Int J Radiat Oncol 2005;63:1016–23.
- Roberts LG. Machine perception of three-dimensional solids: In: Tippet JJT, editor. Optical and electro-optical information processing. Cambridge, Mass: MIT Press; 1965.
- Skretting A. A method for on-site measurements of the effective spatial resolution in PET image volumes reconstructed with OSEM and Gaussian post-filters. Radiat Prot Dosim 2010;139:195–8.
- Marr D, Hildreth E. Theory of edge-detection. P Roy Soc Lond B Bio 1980;207:187–217.
- Haralick RM, Sternberg SR, Zhuang XH. Image-analysis using mathematical morphology. IEEE T Pattern Anal 1987;9:532–50.
- Borgefors G. Hierarchical chamfer matching – a parametric edge matching algorithm. IEEE T Pattern Anal 1988;10:849–65.
- Aristophanous M, Penney BC, Pelizzari CA. The development and testing of a digital PET phantom for the evaluation of tumor volume segmentation techniques. Med Phys 2008;35:3331–42.
- Schwartz M. Information transmission, modulation and noise. New York: McGraw-Hill; 1959. p. 282.
- Zou KH, Warfield SK, Bharatha A, Tempany CMC, Kaus MR, Haker SJ, . Statistical validation of image segmentation quality based on a spatial overlap index – Scientific reports. Acad Radiol 2004;11:178–89.
- Troost EGC, Schinagl DAX, Bussink J, Oyen WJG, Kaanders JHAM. Clinical evidence on PET-CT for radiation therapy planning in head and neck tumours. Radiother Oncol 2010;96:328–34.