Abstract
Background and purpose. Internal organ motion over a course of radiotherapy (RT) leads to uncertainties in the actual delivered dose distributions. In studies predicting RT morbidity, the single estimate of the delivered dose provided by the treatment planning computed tomography (pCT) is typically assumed to be representative of the dose distribution throughout the course of RT. In this paper, a simple model for describing organ motion is introduced, and is associated to late rectal morbidity data, with the aim of improving morbidity prediction. Material and methods. Organ motion was described by normally distributed translational motion, with its magnitude characterised by the standard deviation (SD) of this distribution. Simulations of both isotropic and anisotropic (anterior-posterior only) motion patterns were performed, as were random, systematic or combined random and systematic motion. The associations between late rectal morbidity and motion-inclusive delivered dose-volume histograms (dDVHs) were quantified using Spearman's rank correlation coefficient (Rs) in a series of 232 prostate cancer patients, and were compared to the associations obtained with the static/planned DVH (pDVH). Results. For both isotropic and anisotropic motion, different associations with rectal morbidity were seen with the dDVHs relative to the pDVHs. The differences were most pronounced in the mid-dose region (40–60 Gy). The associations were dependent on the applied motion patterns, with the strongest association with morbidity obtained by applying random motion with an SD in the range 0.2–0.8 cm. Conclusion. In this study we have introduced a simple model for describing organ motion occurring during RT. Differing and, for some cases, stronger dose-volume dependencies were found between the motion-inclusive dose distributions and rectal morbidity as compared to the associations with the planned dose distributions. This indicates that rectal organ motion during RT influences the efforts to model the risk of morbidity using planning distributions alone.
The considerable internal motion displayed by many organs at risk (ORs) in radiotherapy (RT) leads to uncertainties in the actual delivered dose distribution [Citation1–3]. The treatment plan is usually calculated on the basis of a single planning computed tomography (pCT) scan which in reality represents only a sample of the distribution of organ shapes and positions during RT [Citation4] and hence its dose distribution [Citation5]. This process therefore introduces both a random and a systematic component of the uncertainty in organ position during treatment [Citation6,Citation7]. The dosimetric effects of these components are generally different, with the random component tending to blur the dose distribution whereas the systematic component reallocates it [Citation7]. Since dose distributions close to the key ORs usually have relatively steep dose gradients, it seems reasonable to expect that such a reallocation would result in an increased risk of complications: shifts in one direction might increase risk relatively steeply (climbing the dose-response curve), whereas shifts in the opposite direction would reduce it, yet to a lesser extent (backing down the more shallow side of the dose-response curve).
In studies of the associations between dose/ volume parameters and toxicity, the OR motion aspects are usually not accounted for as the studies typically assume a static organ as obtained from the pCT [Citation1]. To investigate whether use of estimated motion-inclusive dose distributions could improve our understanding of and ability to predict toxicity, the actual delivered dose distribution would clearly be useful. Such dose distributions could be derived through dose accumulation based on daily anatomical imaging [Citation8,Citation9]. Reliable dose accumulation would involve describing the organ motion on a voxel level (through deformable image registration, DIR, and voxel tracking) [Citation10] and subsequently constructing the cumulative dose distribution to each of the organ voxels. However, the availability of large-scale patient-specific accumulated/delivered dose distributions along with corresponding follow-up data is still limited. Several investigators have described organ shape variations on a population basis using the information from multiple CT images to simulate organ motion [Citation1,Citation11–13]. Overall, these studies have shown that the doses from simulated motion can often better reflect the actual dose delivered to the organ than the dose distribution from the pCT. However, none of these studies have explored use of the motion-inclusive dose distribution as a tool for predicting toxicity [Citation1,Citation11]. In two previous publications from our group [Citation14,Citation15], the relevance of organ motion in relation to prediction of acute and late rectal toxicity was investigated in a series of prostate cancer patients. Organ motion was described simply by volume expansion, based on the planning organ at risk volume concept [Citation14–17] using various isotropic and anisotropic margins derived from a previous repeat CT internal rectum motion investigation [Citation18]. In both studies, the expanded rectum volumes resulted in a broader range of intermediate and high dose levels showing significant association with rectal toxicity compared to the static rectum seen in the pCT, indicating that rectum motion is an important aspect when predicting rectal toxicity. In the present study we go beyond that and introduce an actual motion model for describing rectal motion. In this model organ motion is described as normally distributed translational motion. Different motion magnitudes were introduced by changing the standard deviation of the applied normal distribution. The model was applied to the rectum and the resulting motion- inclusive dose distributions as well as the static dose distributions were investigated in relation to late rectal morbidity.
Material and methods
The organ motion model
Organ motion was simulated by introducing normally distributed rigid translations of the static organ as defined in the delineations on the pCT, as either random or systematic errors/shifts over each of the treatment fractions. In order to investigate different motion magnitudes in the various simulations, the standard deviation [SD, (σ)] of the related normal distribution was altered. Different delivered doses were repeatedly simulated as multiple pseudo trials for each patient. The motion simulations were all carried out in the Computational Environment for Radiotherapy Research framework [Citation19]. All simulations were performed on a 2.4 GHz Intel Core 2 Duo processor Macintosh HD.
Isotropic random and/or systematic motion.
Initially, normally distributed isotropic translations were simulated as either random or systematic errors, i.e. shifts over each of the treatment fractions. The motion was varied by changing the SD of the related normal distribution, i.e. small, intermediate or large SD (σ = 0.2, 0.5 and 0.8 cm). The motion was at first simulated with n pseudo trials (n assumed to be in the range 2–20), with the chosen value depending on the stability of the resulting simulated DVHs (see the Motion model exploration section). Subsequently, combined random and systematic isotropic motion was simulated.
Anterior-posterior random or/and systematic motion.
As isotropic motion is neither the most likely nor the most clinically realistic rectal motion pattern [Citation6,Citation18], motion in the anterior-posterior direction only was simulated. The choice of this direction was based on results from previous work from our group [Citation18] and the anatomical location of the rectum relative to the prostate, i.e. a shift of the rectum into the high-dose region will likely constitute a worst-case scenario in terms of rectal complications [Citation6]. Like for the isotropic motion simulations, this anisotropic motion was simulated as random, systematic or combined random and systematic motion, again with shifts of small, intermediate or large SD (σ = 0.2, 0.5 and 0.8 cm).
Treatment planning and outcome data
The final simulations were performed in a data set consisting of 232 prostate cancer patients with complete treatment planning and prospectively collected follow-up data (in the following referred to as the prospective follow-up cohort). All cases in this cohort were treated with a four-field box technique with MLC-based three-dimensional (3D) conformal RT to 70 Gy at Haukeland University Hospital (Bergen, Norway). Treatment was delivered in 35 fractions of 2 Gy to either the prostate only, the prostate and seminal vesicles or also to the small pelvis (initially 50 Gy only). Patient's characteristics, treatment planning details and late rectal morbidity data have been described previously [Citation20], and only the key points are summarised in the following.
The rectum was defined as the outer wall (with contents) from above the anal canal to the recto-sigmoid flexure. All patients were prospectively followed for at least five years (every six months the first year and then annually) having 90% of the follow-up sessions performed by the same physician. Late rectal morbidity was scored as late gastro-intestinal (GI) toxicity according to the RTOG scoring system [Citation21], including rectal morbidity developing more than 90 days after RT or starting earlier but persisting more than 90 days after completed RT. The end-point being used for this study was the maximum recorded late GI toxicity grade. Severe late GI toxicity (GI grade ≥ 2) was observed in 24 (10%) patients while 36 (16%) patients experienced GI grade 1.
Motion model exploration
The performance of the organ motion model was initially explored by repeat simulations of n = 2, 5, 10 and 20 number of trials. Three repeat simulations were performed for all combinations of the number of trials and for isotropic random or systematic organ motion, both with σ = 0.2, 0.5 and 0.8 cm.
As a further model performance exploration, the motion model was used in a series of nine prostate cancer patients that had eight to nine repeat CT scans acquired during the course of treatment (hereafter referred to as the repeat imaging cohort) [Citation22]. For the purpose of the present study, these patients were planned with a simultaneously integrated boost using intensity-modulated RT, delivering 74 Gy to the prostate and 55 Gy to the seminal vesicles and pelvic lymph nodes over 37 fractions, according to an on-going trial (the Propel A + B trial; www.cirro.dk). Using these dose distributions and the pCT, motion simulations were performed with n = 10 pseudo trials applying both isotropic and anistropic motion as well as both random and systematic motion. In addition, rectum DVHs based on manual segmentations in the repeat CTs were calculated following translatory re-positioning from the pCT by means of intra-prostatic fiducial gold markers [Citation23] as well as transfer of the SIB plan onto the repeat CT scan geometry. The spread of these individual re-calculated rectal DVHs were compared to the simulated DVHs resulting from the various motion pattern parameters. Finally, the averages of all re-calculated vs. all simulated DVHs were compared, assessing the relative volume difference between the relative DVHs (Vdiff). Details on the treatment and re-positioning procedures have been described more thoroughly in the study by Thörnqvist et al. [Citation24].
Model application
In the prospective follow-up cohort, the simulated delivered DVHs (dDVHs) as well as the pDVH, i.e. the situation with no rectum motion applied, were analysed with respect to maximum late GI toxicity, comparing patients with vs. without GI grade ≥ 2. All statistical analysis was performed in the Dose Response Explorer System [Citation25]. In effect we create a (n times) larger digital cohort of patients than the original cohort, with a distribution of DVHs that might more accurately reflect the effect of motion. For the dichotomised GI toxicity, Spearman's rank correlation coefficient (Rs) was used to test for differences in rectal dose-volume parameters, i.e. the rectum volume receiving more than x Gy [Vx (%)] (sampled in 5 Gy intervals from 5 Gy up to the prescribed dose). Since the patient population was effectively duplicated the p-values of the Rs were adjusted for ties [Citation26].
Results
Motion model performance
The repeat motion simulations using n = 2, 5, 10 and 20 trials in the prospective follow-up cohort showed that stable distributions of dDVHs were generally obtained when at least 10 trials were simulated. For two and five trials the distributions of the dDVHs differed between simulations, in particular for the motion patterns causing the largest re-allocations of the pDVH (i.e. systematic motion using σ = 0.5 and 0.8 cm). Smaller discrepancies between simulations were seen for the use of 20 trials (see Supplementary Figure 1 to be found online at http://informahealthcare.com/doi/abs/10.3109/0284186X.2012.720382 for further details). Representative results of the simulations for n = 10 trials are shown for one single patient from this cohort (). The random shifts smoothened the pDVH whereas the systematic shifts re-allocated it, typically more distinct as larger motion magnitudes were used. To reduce the computational workload in the further simulations and since the variations between simulations were the smallest for 10 trials; this number of trials was used in all subsequent analyses.
Figure 1. The initial isotropic motion simulations using 10 trials with small (σ = 0.2 cm, upper panel), intermediate (σ = 0.5 cm, middle panel) and large (σ = 0.8 cm, lower panel) motion magnitudes for both random (left) and systematic (right) motion patterns shown for one patient. The planned DVH is included as well (black solid line).
In the repeat imaging cohort, the largest population differences between the average of the re-calculated DVHs and the simulated DVHs were obtained applying random large (σ = 0.8 cm) isotropic shifts (Vdiff = 4.5% (2.7–9.9%)). The smallest differences were seen using random small (σ = 0.2 cm) anisotropic shifts (Vdiff = 2.7% (1.0–3.8%)). The average Vdiff over all patients for all applied shifts was below 3% (range, 1.6–7.0%) (). The simulated dDVHs and the DVHs re-calculated on the repeat CT scans are shown for the patient with the largest (Vdiff = 7.0 (3.6–9.9%)) and the smallest (Vdiff = 1.6 (0.9–2.7%)) variations relative to the average of the re-calculated DVHs (). Most of the largest differences resulted from simulations of large random isotropic shifts whereas the smallest were distributed over systematic isotropic shifts of all applied motion magnitudes (σ = 0.2, 0.5 and 0.8 cm) and systematic large anisotropic shifts ().
Figure 2. All simulated dDVHs (green) and re-calculated DVHs (black) for the patient with the smallest (left) and largest (right) differences between the average of the dDVHs and the average of the recalculated DVHs obtained for systematic large (σ = 0.8 cm) anisotropic shifts and random large isotropic shifts, respectively. The pDVH is additionally included (red).
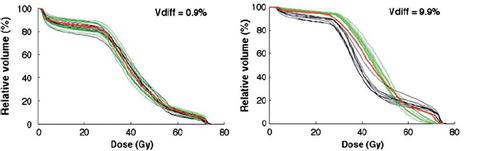
Table I. The largest and smallest relative volume difference between the simulated and re-calculated DVHs (Vdiff (%)) and the related shifts for each patient. In the rightmost column the average of Vdiff over all applied shifts is given for each patient.
The motion-inclusive DVHs and the associations with morbidity
Overall, new statistical associations emerged between the motion-inclusive dDVHs and late rectal morbidity compared to the associations with the static pDVHs, for both isotropic () and anisotropic motion (). In general, the largest differences in the associations were observed at rectum volumes receiving doses above 40 Gy (V40). Given isotropic motion, the associations at V40 were insensitive to the motion magnitude and motion design (despite some small variations applying intermediate and large shifts) (). Below V40 the associations with the dDVHs from all isotropic motion patterns deviated from the associations with the pDVH () while the dDVHs from anisotropic motion followed the pDVH curve to a larger extent ().
Figure 3. The simulation of isotropic motion and the associations of the resulting dDVHs (red) and the pDVH (black) with rectal morbidity quantified by Spearman's rank correlation coefficient (Rs) plotted against the dose (Gy) for random (upper panel), systematic (middle panel) and combined random and systematic motion (lower panel) using σ of 0.2 (left), 0.5 (middle) and 0.8 (right) cm.
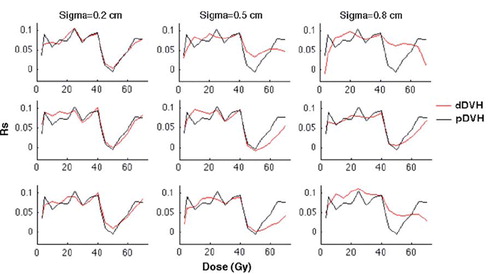
Figure 4. The anisotropic motion pattern giving the Rs-values, plotted against the dose, i.e. the associations between rectal morbidity and the pDVH (black) as well as the dDVHs (red) for random (upper panel), systematic (middle panel) and combined random and systematic motion (lower panel) using σ of 0.2 (left), 0.5 (middle) and 0.8 (right) cm.
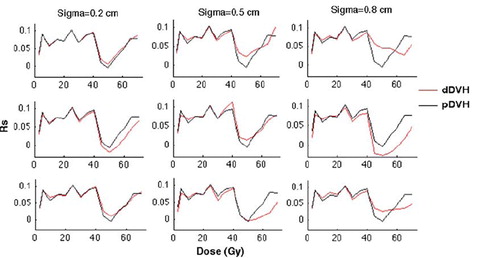
The influence on the associations with rectal morbidity of the initial isotropic motion simulations introducing various motion magnitudes (i.e. σ = 0.2 cm, σ = 0.5 cm and σ = 0.8 cm) to the static pDVH were different between the random and the systematic motion simulations and most pronounced for the larger motion magnitudes (σ = 0.5, 0.8 cm) (). At 40–60 Gy the dDVHs from the random motion resulted in stronger associations relative to the pDVH whereas the associations from the systematic motion were either stronger or weaker than those from the pDVH. Above 60 Gy, similar associations from random and systematic motion were obtained. For anisotropic motion the differences in associations relative to the pDVH again increased as larger random shifts were applied with stronger associations for doses between 40 Gy and 55 Gy. Applying systematic anisotropic shifts, differences in the associations relative to the pDVH between 40 Gy and 55 Gy were seen (either stronger or weaker). Above V55 the associations for the systematic anisotropic shifts were also weaker than those with the pDVH (). For both isotropic and anisotropic motion combining random and systematic shifts the associations of the resulting dDVHs were similar to those from random motion for small and large motion magnitudes (σ = 0.2, 0.8 cm) while similar to those from systematic motion for the intermediate motion magnitude (σ = 0.5 cm), again with the largest differences relative to the pDVH above V40 ( and ).
Introducing a modest criterion on the Rs-value for the dDVHs – i.e. an increase of 0.02 relative to the Rs-value for the pDVH – three of the applied isotropic shifts (intermediate and large random shifts and large combined random and systematic shifts) resulted in stronger associations at five intermediate/high dose levels (45–60 Gy) (Rs = 0.03–0.07) (). The same motion magnitudes and shifts showed an increase in the Rs-value of the same range (Rs = 0.02–0.06) also for anisotropic motion at three intermediate dose levels (45, 50 and 55 Gy). Six of the isotropic shifts also provided higher Rs-values (Rs = 0.06–0.1) for 3–30 Gy. The largest differences between the anisotropic motion and the pDVH were seen at 70 Gy (Rs = 0.1) ().
Table II. The associations (Rs) between rectal morbidity and the dDVHs given the 0.02 increase criterion in the Rs-value for the dDVH compared to the Rs-value for the pDVH, summarised for isotropic and anisotropic motion with σ = 0.2, 0.5 and 0.8 cm given for the dose levels (Gy) investigated. The increase in associations was seen especially at intermediate doses (45–60 Gy). Isotropic motion provided stronger associations also at low doses ( ≤ 20 Gy). Applying anisotropic random motion, the associations were stronger also at high doses (≥ 60 Gy).
Discussion
The main objective of this study was to investigate the effect of using motion-inclusive DVHs – obtained from a relatively simple motion model – to eventually improve prediction of toxicity, using the mobile rectum as model site. The results show that motion – a hidden variable in RT treatment planning – probably influences the risk of late rectal morbidity. Further, the results may indicate that fitting outcomes data with motion simulated DVHs might be more accurate than fitting data to motion-naïve planning DVHs.
This simple model assumed organ motion to be described by normally distributed rigid translational motion, including various motion patterns. Compared to re-calculated DVHs and static/planned DVHs additional information both in terms of the appearance of the DVHs and its associations to rectal morbidity was obtained for the simulated motion-inclusive DVHs.
In the repeat imaging cohort the average relative volume difference, Vdiff, over all shifts, between the simulated dDVHs and the re-calculated DVHs was below 3%. The largest Vdiff was obtained for large isotropic shifts whereas the smallest for small anisotropic shifts. The larger differences were explained by large re-allocations both between the re-calculated DVHs and the pDVH as well as between the simulated dDVHs and the pDVH. For smaller re-allocations there was a good agreement between the dDVHs and the re-calculated DVHs ().
By introducing the organ motion model new associations between rectal morbidity and the motion-inclusive dose distributions compared to the associations with the planned dose distribution were obtained. The new associations were seen mostly for rectum volumes receiving doses in a certain range above 40 Gy. The stronger associations were observed in particular when simulating random motion. However, given the size of the material and the number of morbidity events, it was not the ambition of this study to make explicit recommendations on motion-inclusive rectal dose/volume constraints, as this will require the analysis of further and larger datasets for validation. Comparable associations were obtained for the dDVHs from the two approaches (isotropic vs. anisotropic motion) although the anisotropic motion followed the shape of the pDVH curve to a larger extent for doses up to approximately 40 Gy while for the isotropic shifts, the dDVH curves was typically smoothened up to 40 Gy ( and ). For six of the isotropic shifts an increase in the Rs-value relative to the pDVH was obtained at low doses (). Independent of either intermediate or large motion magnitude, the associations with rectal morbidity were strongest when rectum motion was simulated as random motion, compared to both systematic and combined random and systematic motion. For deformable organs such as the rectum, random day-to-day variations in volume [Citation27] and shape due to, e.g. air cavities [Citation4,Citation5] are much more likely than a systematic position change. For small isotropic shifts however the associations for random and combined random and systematic motion were of similar order.
Within the high-dose region, the associations between the dDVHs and rectal morbidity were either similar or less strong as compared to the associations with the dose/volume parameters from the pDVH. For small systematic isotropic shifts, combined small random and systematic isotropic or anisotropic shifts and small and intermediate anisotropic random shifts, the associations were on the other hand somewhat higher at 70 Gy ( and ). In a previous publication from our institution [Citation15] rectum motion modelled as volume expansion in the anterior- posterior direction was explored in the same patient population using the same rectal morbidity end-point. Similar to the findings of this study, intermediate dose levels provided a stronger association with rectal morbidity over the static rectal dose distribution. Additionally, the rectum expanded with small margins (6 mm anterior and 5 mm posterior) presented higher associations at high doses (62–71 Gy) [Citation15]. By using a static rectal dose distribution, others have previously found associations for high dose levels [Citation28–30]. For instance, in one of the early rectum publications within this field by Jackson et al. [Citation30], both high and intermediate dose levels were associated with late rectal bleeding. The so-called dose-bath effect was used to explain the associations at intermediate dose levels. It should be pointed out that these conclusions were drawn on the basis of a static rectal dose distribution [Citation30]. Despite the dDVHs from the five above-mentioned shifts giving stronger associations at 70 Gy there was an overall lack of associations at high dose levels in this study. This might partially be explained by the inability of previous studies in including the variations in rectum volume and shape as the dose distribution from the pCT represents only a sample of the dose distribution throughout the entire treatment course [Citation5,Citation31–34].
The population-based motion approach used in this study assumed that the motion was normally distributed such that convolving the dose distribution obtained from the pCT with a Gaussian probability density function described the positional uncertainty [Citation35]. Interestingly, Mavroidis and co-workers [Citation36] previously explored similar approaches for the lung in a smaller cohort of patients (60 cases) treated with RT for breast cancer although with an end-point (radiation pneumonitis) based on predictions from a radiobiological model. In any case, since organ motion in reality will not necessarily follow ‘a simple Gaussian’, a more advanced development of the present model should be pursued [Citation11,Citation37]. More complex models describing geometric variations have been presented [Citation1,Citation11,Citation37,Citation38]. In the study by Söhn et al. [Citation37] where the powerful principal component analysis was used it was still suggested that the dimensionality of the motion problem possibly is low which would support a relatively simple description of the organ motion. It is our interpretation of the present study that – given the current lack of large patient series with both real accumulated dose distributions and prospective follow-up data – a simulated motion-inclusive dose distribution may contribute to improve our understanding of dose/volume components influencing on toxicity.
To obtain a more accurate estimate of the true rectum dose, patient-specific accumulated dose distributions are required, as pointed out already in the pioneering work on adaptive RT by Yan et al. [Citation39]. In two previous studies from our institution the performance of a DIR application was investigated based on contour propagation for a fraction (four) of the nine patients included in the repeat imaging cohort [Citation40] and for another five prostate cancer patients with repeat cone-beam CTs (6–8 scans/patient) [Citation9]. Based on both quantitative and qualitative evaluation the performance of the DIR for the rectum was found insufficient [Citation9,Citation40]. Hence calculating the accumulated rectum dose based on this DIR with no further precautions would presumably compromise a reliable comparison with the planned dose distribution.
A majority of the applied shifts displayed significant tendencies in the associations between the dDVHs and rectal morbidity at both 25 Gy and 40 Gy (p < 0.07) although strictly significant associations (p < 0.05) were only obtained for some of the shifts at these particular dose levels. We certainly acknowledge the overall low predictive power of all DVH parameters (both planned and simulated) in this material, with Rs-values reaching at most 0.12. Based on this small interval, a criterion represented by a 0.02 increase in the Rs-value was therefore chosen to identify the associations between rectal morbidity and the motion-inclusive distributions vs. the associations with the static dose distribution. In any case, our primary ambition was to explore whether a motion-inclusive dose distribution has the potential of improving our ability to predict rectal morbidity rather than suggesting accurate dose/volume constraints for the rectum in the treatment planning of pelvic tumour sites.
The scoring system utilised in this study has shortcomings in describing rectal morbidity since it is unable to discriminate between small bowel and rectal toxicity [Citation21]. This is likely to mostly affect the scoring for the fraction of patients (40 cases) where also a considerable portion of the bowel was irradiated. In an upcoming study, our intention is to address this by limiting the patient population to only the remaining 190 patients that were irradiated locally and validate the model in another cohort of 159 prostate cancer patients [Citation41] with similar treatment and follow-up characteristics. Another important aspect would be to move away from the non-specific RTOG GI toxicity [Citation21] to more specific rectal end-points. In the present patient cohort and also in this validation cohort we therefore aim to investigate the associations between motion obtained from the model developed in this study and, i.e. the frequently reported late rectal bleeding end-point [Citation30] as well as other separate end-points such as faecal incontinence [Citation42] where dose/volume effect relations may be easier to interpret.
The rectum was chosen as an initial application of our organ motion model. It is likely that the model may be useful also for other treatment sites and other prediction purposes. Future studies related to this model may focus on exploring and extending the motion model for other deformable pelvic organs, e.g. the bladder and the prostate and possibly also to prediction of tumour recurrence, the latter by also incorporating patient-specific functional images and motion data.
In conclusion, we have developed an organ motion model assuming normally distributed translational motion and explored its potential use for toxicity prediction. The rectum and late rectal morbidity, highly relevant for RT of several pelvic tumour sites, was chosen as the initial application of this model. By introducing this model we found differences in the associations with rectal morbidity compared to the associations with the static dose distribution obtained from the pCT, in particular in the dose range above 40 Gy. Albeit this study revealed new associations with toxicity using a motion-inclusive dose distribution, more precise estimations are expected to result from future studies where individual motion and deformation information from repeat imaging data are used to calculate patient-specific accumulated/summed dose distributions for mobile ORs.
Supplementary Figure 1
Download PDF (409.2 KB)Acknowledgements
The authors are grateful to Ása Karlsdottir for providing the clinical outcome data used in this study.
Declaration of interest: The authors report no conflicts of interest. The authors alone are responsible for the content and writing of the paper.
This study has been supported by research grants from CIRRO – The Lundbeck Foundation Center for Interventional Research in Radiation Oncology, the Danish Cancer Society, FSS (The Danish Council for Independent Research) as well as the Danish Council for Strategic Research. Further, this study was supported by NIH grant R01 CA85181.
References
- Hoogeman MS, van Herk M, Yan D, Boersma LJ, Koper PCM, Lebesque JV. A model to simulate day-to-day variations in rectum shape. Int J Radiat Oncol Biol Phys 2002;54:615–25.
- van Haaren PM, Bel A, Hofman P, van Vulpen M, Kotte AN, van der Heide UA. Influence of daily setup measurements and corrections on the estimated delivered dose during IMRT treatment of prostate cancer patients. Radiother Oncol 2009;90:291–8.
- Kvinnsland Y, Muren LP. The impact of organ motion on intestine doses and complication probabilities in radiotherapy of bladder cancer. Radiother Oncol 2005;76:43–7.
- van Zijtveld M, Dirkx M, Breuers M, Kuipers R, Heijmen B. Evaluation of the ‘dose of the day’ for IMRT prostate cancer patients derived from portal dose measurements and cone-beam CT. Radiother Oncol 2010;96:172–7.
- Chen L, Paskalev K, Xu X, Zhu J, Wang L, Price RA, . Rectal dose variation during the course of image-guided radiation therapy of prostate cancer. Radiother Oncol 2010;95:198–202.
- McKenzie A, van Herk M, Mijnheer B. Margins for geometric uncertainty around organs at risk in radiotherapy. Radiother Oncol 2002;62:299–307.
- van Herk M. Errors and margins in radiotherapy. Semin Radiat Oncol 2004;14:52–64.
- Yan D, Jaffray DA, Wong JW. A model to accumulate fractionated dose in a deforming organ. Int J Radiat Oncol Biol Phys 1999;44:665–75.
- Thor M, Petersen JB, Bentzen L, Høyer M, Muren LP. Deformable image registration for contour propagation from CT to cone-beam CT scans in radiotherapy of prostate cancer. Acta Oncol 2011;50:918–25.
- Korreman S, Rasch C, McNair H, Verellen D, Oelfke U, Maingon P, . The European Society of Therapeutic Radiology and Oncology-European Institute of Radiotherapy (ESTRO-EIR) report on 3D CT-based in-room image guidance systems: A practical and technical review and guide. Radiother Oncol 2010;94:129–44.
- Fontenla E, Pelizzari CA, Roeske JC, Chen GT. Using serial imaging data to model variabilities in organ position and shape during radiotherapy. Phys Med Biol 2001;46:2317–36.
- Kvinnsland Y, Muren LP, Dahl O. A Monte Carlo study of the impact of the choice of rectum volume definition on estimates of equivalent uniform doses and the volume parameter. Phys Med Biol 2004;49:3341–52.
- Kvinnsland Y, Muren LP, Dahl O. Evaluation of a new method for calculation of cumulative doses in the rectum wall using repeat CT scans. Acta Oncol 2004;43:388–95.
- Muren LP, Karlsdottir A, Kvinnsland Y, Wenzel-Larsen T, Dahl O. Testing the new ICRU 62 ‘Planning Organ at Risk Volume’ concept for the rectum. Radiother Oncol 2005;75: 293–302.
- Thor M, Væth M, Karlsdottir A, Muren LP. Rectum motion and morbidity prediction: Improving correlation between late morbidity and DVH parameters through use of rectum planning organ at risk volumes. Acta Oncol 2010;49:1061–8.
- ICRU Report 62. Prescribing, recording and reporting photon beam radiotherapy (supplement to ICRU Report 50). Bethesda, MD: International Commission on Radiation Units and Measurements; 1999.
- Hysing LB, Kvinnsland Y, Lord H, Muren LP. Planning organ at risk volume margins for organ motion of the intestine. Radiother Oncol 2006;80:349–54.
- Muren LP, Ekerold R, Kvinnsland Y, Karlsdottir A, Dahl O. On the use of margins for geometrical uncertainties around the rectum in radiotherapy planning. Radiother Oncol 2004; 70:11–9.
- Deasy JO. CERR: A computational environment for radiotherapy research. Med Phys 2003;30:979–85.
- Karlsdottir A, Muren LP, Wenzel-Larsen T, Dahl O. Late gastrointestinal morbidity after three-dimensional conformal radiation therapy for prostate cancer fades with time in contrast to genitourinary morbidity. Int J Radiat Oncol Biol Phys 2008;70:1478–86.
- Cox JD, Stetz J, Pajak TF. Toxicity criteria of the Radiation Therapy Oncology Group (RTOG) and the European Organization for Research and Treatment of Cancer (EORTC). Int J Radiat Oncol Biol Phys 1995;5:1341–6.
- Muren LP, Wasbø E, Helle SI, Hysing LB, Karlsdottir A, Odland OH, . Intensity-modulated radiotherapy of pelvic lymph nodes in locally advanced prostate cancer: Planning procedures and early experiences. Int J Radiat Oncol Biol Phys 2008;71:1034–41.
- Moman MR, van der Heide UA, Kotte AN, van Moorselaar RJ, Bol GH, Franken SP, . Long-term experience with transrectal and transperineal implantations of fiducial gold markers in the prostate for position verification in external beam radiotherapy; feasibility, toxicity and quality of life. Radiother Oncol 2010;96:38–42.
- Thörnqvist S, Bentzen L, Petersen JBB, Hysing LB, Muren LP. Plan robustness of simultaneous integrated boost radiotherapy of prostate and lymph nodes for different image-guidance and delivery techniques. Acta Oncol 2011;50:926–34.
- El Naqa I, Suneja G, Lindsay PE, Hope AJ, Alaly JR, Vicic M, . Dose response explorer: An integrated open-source tool for exploring and modelling radiotherapy dose-volume outcome relationships. Phys Med Biol 2006;51: 5719–35.
- Lehmann EL. Rank tests for comparing two treatments: The treatment of ties. In: Lehmann EL, editor. Nonparametrics, statistical methods based on ranks, 1st ed. New York: Springer Science + Business Media; 2006. pp 18–22.
- Engels B, Tournel K, Soete G, Storme G. Assessment of rectal distention in radiotherapy of prostate cancer using daily megavoltage CT image guidance. Radiother Oncol 2009;90:377–81.
- Fellin G, Fiorino C, Rancati T, Vavassori V, Baccolini M, Bianchi C, . Clinical and dosimetric predictors of late rectal toxicity after conformal radiation for localized prostate cancer: Results of a large multicenter observational study. Radiother Oncol 2009;93:197–202.
- Gulliford SL, Partridge M, Sydes MR, Andreyev J, Dearnaley DP. A comparison of dose-volume constraints derived using peak and longitudinal definitions of late rectal toxicity. Radiother Oncol 2010;94:241–7.
- Jackson A, Skwarchuk MW Zelefsky MJ, Cowen DM, Venkatraman ES, Levegrun S, . Late rectal bleeding after conformal radiotherapy of prostate cancer (II): Volume effects and dose-volume histograms. Int J Radiat Oncol Biol Phys 2001;49:685–98.
- Fiorino C, Valdagni R, Rancati T, Sanguineti G. Dose-volume effects for normal tissues in external radiotherapy: Pelvis. Radiother Oncol 2009;93:153–67.
- Sripadam R, Stanford J, Henry AM, Jackson A, Moore CJ, Price P. Rectal motion can reduce CTV coverage and increase rectal dose during prostate radiotherapy: A daily cone-beam CT study. Radiother Oncol 2009;90:312–7.
- Hatton JA, Greer PB, Tang C, Wright P, Capp A, Gupta S, . Does the planning dose-volume histogram represent treatment doses in image-guided prostate radiation therapy? Assessment with cone-beam computerised tomography scans. Radiother Oncol 2011;98:162–8.
- Anderson NS, Yu JB, Peschel RE, Decker RH. A significant decrease in rectal volume and diameter during prostate IMRT. Radiother Oncol 2011;98:187–91.
- Jiang R, Barnett RB, Chow JC, Chen JZ. The use of spatial dose gradients and probability density function to evaluate the effect of internal organ motion for prostate IMRT treatment planning. Phys Med Biol 2007;52:1469–84.
- Mavroidis P, Axelsson S, Hyödynmaa S, Rajala J, Pitkänen MA, Lind BK, . Effects of positioning uncertainty and breathing on dose delivery and radiation pneumonitis prediction in breast cancer. Acta Oncol 2002;41:471–85.
- Söhn M, Birkner M, Yan D, Alber M. Modelling individual geometric variation based on dominant eigenmodes of organ deformation: Implementation and evaluation. Phys Med Biol 2005;50:5893–908.
- Budiarto E, Keijzer M, Storchi PR, Hoogeman MS, Bondar L, Mutanga TF, . A population-based model to describe geometrical uncertainties in radiotherapy: Applied to prostate cases. Phys Med Biol 2011;56:1045–61.
- Yan D, Vicini F, Wong J, Martinez A. Adaptive radiation therapy. Phys Med Biol 1997;42:123–32.
- Thörnqvist S, Petersen JBB, Høyer M, Bentzen LN, Muren LP. Propagation of target and organ at risk contours in radiotherapy of prostate cancer using deformable image registration. Acta Oncol 2010;49:1023–32.
- Liu M, Moiseenko V, Agranovich A, Karvat A, Kwan W, Saleh ZH, . Normal Tissue Complication Probability (NTCP) modeling of late rectal bleeding following external beam radiotherapy for prostate cancer: A test of the QUANTEC-recommended NTCP model. Acta Oncol 2010;49:1040–4.
- Maeda Y, Høyer M, Lundby L, Buntzen S, Laurberg S. Temporary sacral nerve stimulation for faecal incontinence following pelvic radiotherapy. Radiother Oncol 2010;97:108–12.