Abstract
Purpose. Besides basic measurements as maximum standardized uptake value (SUV)max or SUVmean derived from 18F-FDG positron emission tomography (PET) scans, more advanced quantitative imaging features (i.e. “Radiomics” features) are increasingly investigated for treatment monitoring, outcome prediction, or as potential biomarkers. With these prospected applications of Radiomics features, it is a requisite that they provide robust and reliable measurements. The aim of our study was therefore to perform an integrated stability analysis of a large number of PET-derived features in non-small cell lung carcinoma (NSCLC), based on both a test-retest and an inter-observer setup. Methods. Eleven NSCLC patients were included in the test-retest cohort. Patients underwent repeated PET imaging within a one day interval, before any treatment was delivered. Lesions were delineated by applying a threshold of 50% of the maximum uptake value within the tumor. Twenty-three NSCLC patients were included in the inter-observer cohort. Patients underwent a diagnostic whole body PET-computed tomography (CT). Lesions were manually delineated based on fused PET-CT, using a standardized clinical delineation protocol. Delineation was performed independently by five observers, blinded to each other. Fifteen first order statistics, 39 descriptors of intensity volume histograms, eight geometric features and 44 textural features were extracted. For every feature, test-retest and inter-observer stability was assessed with the intra-class correlation coefficient (ICC) and the coefficient of variability, normalized to mean and range. Similarity between test-retest and inter-observer stability rankings of features was assessed with Spearman's rank correlation coefficient. Results. Results showed that the majority of assessed features had both a high test-retest (71%) and inter-observer (91%) stability in terms of their ICC. Overall, features more stable in repeated PET imaging were also found to be more robust against inter-observer variability. Conclusion. Results suggest that further research of quantitative imaging features is warranted with respect to more advanced applications of PET imaging as being used for treatment monitoring, outcome prediction or imaging biomarkers.
Positron emission tomography (PET) has been shown to be a valuable tool for the detection and staging of lung cancer [Citation1]. In recent years PET imaging has also been increasingly used for treatment planning [Citation2] and response monitoring in radiotherapy [Citation3]. The most widely used tracer in oncological PET imaging is the glucose analog [18F] fluoro-2-deoxy-D-glucose (FDG), commonly quantified by the standardized uptake value (SUV) [Citation4]. Previous research provides evidence of basic and easily derived pre-treatment PET measurements, such as the maximum (SUVmax) or mean SUV (SUVmean), being predictors for treatment outcome in non-small cell lung cancer (NSCLC) [Citation5–7]. Besides these basic measurements, more advanced quantitative imaging features are increasingly investigated for treatment monitoring and outcome prediction in lung and other cancer sites [Citation8–10], or as potential imaging biomarkers [Citation11]. The use of basic and more advanced descriptors derived from PET imaging is within the scope of “Radiomics” [Citation12–14]: a high throughput approach to extract and mine a large number of quantitative features from medical images, where it is hypothesized that it will improve tumor characterization and treatment outcome prediction. However, with the prospect of using these Radiomics features for future prognostic and predictive models, knowledge about their reliability and variability is needed. A few recent studies have investigated these aspects of FDG-PET-derived parameters in different cancer sites, including the test-retest stability of basic SUV measurements [Citation15], test-retest stability of a number of basic and textural features [Citation16], or the variability of textural features due to image acquisition and reconstruction parameters [Citation17]. However, to our knowledge no previous study has performed an integrated stability analysis of a large number of PET features in NSCLC, based on both a test-retest and an inter-observer setup. Therefore, the aim our study is to independently examine the feature's test-retest reliability and inter-observer stability between multiple manual tumor delineations. Moreover, we aim to combine the information obtained from both analyses to assess if imaging features that are more stable in repeated PET imaging are also more robust against inter-observer variability. Based on literature research, we strived to include a broad collection of PET-based imaging features used in the context of predictive and/or prognostic modeling in cancer, to provide a comprehensive overview.
Material and methods
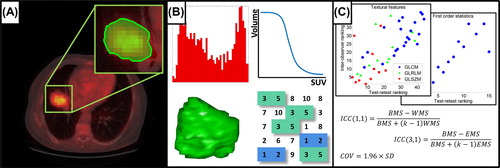
This study includes two separate patient cohorts in order to assess both the test-retest and inter-observer variability of a large number of quantitative imaging features. All patients signed an informed consent form in accordance with approval by the institutional review board. A schematic representation of the workflow applied in our study is depicted in .
Figure 1. Schematic of the workflow applied in our study. A. Acquisition of PET images (fused CT for illustrative purposes), followed by tumor delineation. B. Extraction of Radiomics features from the defined volume of interest. C. Test-retest and inter-observer stability analysis.
Test-retest cohort
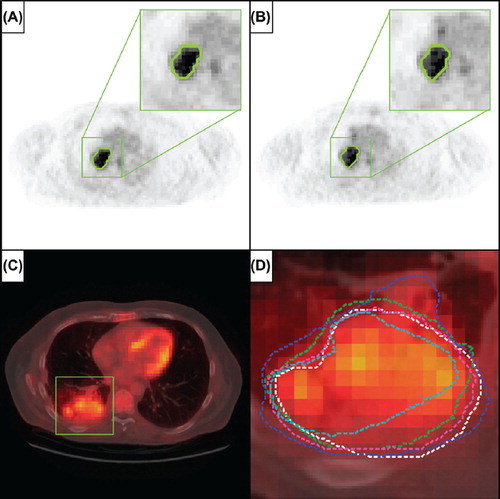
Eleven patients with histology- or cytology-diagnosed NSCLC were included in this patient cohort, as described in [Citation18]. Patients underwent two baseline 18F-FDG-PET scans within a one day interval, before any treatment was delivered. PET images were acquired on an ECAT EXACT HR1 scanner (Siemens/CTI) and iteratively reconstructed using normalization- and attenuation-weighted ordered-subset expectation maximization with two iterations and 16 subsets (OSEM 2i16s). All images had an in-plane resolution of 5.15 × 5.15 mm/pixel and a slice thickness of 2.43 mm. Further patient and imaging details are described by Frings et al. [Citation18]. Lesions with adequate uptake were first identified and subsequently delineated by applying a threshold of 50% of the maximum uptake value within the tumor [Citation19], using a semiautomatic delineation tool [Citation18] ( and ).
Figure 2. A and B. Representative images of repeated imaging of a patient from the test-retest cohort, with the 50% SUVmax tumor delineation shown outlined in green, for, respectively, the first and second baseline PET scan. C. Representative image of a patient from the inter-observer cohort, where the lesion area is outlined with the green square (fused CT for illustrative purposes). D. Enlargement of the lesion area with in different colors the five independent tumor delineations by multiple observers.
Inter-observer cohort
Twenty-three patients with histologically proven NSCLC were included in this patient cohort, as described previously in [Citation20]. Patients underwent a diagnostic whole body PET-CT scan acquired on a SOMATOM Sensation 16 with an ECAT ACCEL PET scanner (Siemens, Erlangen, Germany). PET images were iteratively reconstructed using normalization- and attenuation-weighted OSEM 4i8s. Images had an in-plane resolution of 5.31 × 5.31 mm/pixel and a 5 mm slice thickness. Primary tumors and involved lymph nodes were identified and manually delineated based on fused PET-CT images, using a standardized clinical delineation protocol. Delineation of the lesions was performed independently by five observers and all observers were blinded to the contours delineated by the others ( and ). Manual delineations were performed on XiO/Focal (Computer Medical System, Inc., St. Louis, MO, USA). For further details on the patient cohort, imaging and delineation, we refer to the publication of van Baardwijk et al. [Citation20].
Image processing and feature extraction
All image analysis was performed in Matlab R2012b (The Mathworks, Natick, MA, USA) using an adapted version of the Computational Environment for Radiotherapy Research (CERR) [Citation21] extended with in-house developed Radiomics image analysis software to extract imaging features. PET images and delineated VOIs were first imported into CERR, where the image intensities were normalized to SUV [Citation4].
First order statistics consisted of basic SUV measurements and features describing the histogram of voxel intensity values contained within the VOI. A set of metrics was derived from intensity volume histogram (IVH) representations [Citation10], which summarize the complex three dimensional (3D) data contained in the image into a single curve, allowing for a simplified interpretation. Three IVH definitions were considered: the relative volume as a function of the relative intensity (RVRIx), the absolute volume as a function of the relative intensity (AVRIx) and the intensity threshold as a function of the relative volume having a maximum intensity lower than the threshold (AIRVx). Relative steps in volume and intensity (x) were taken in 10% increments, from 10% to 90%. Furthermore, three differential IVH metrics were considered: RVRIx-RVRI(100-x), AVRIx-AVRI(100-x), and AIRVx-AIRV(100-x). Geometric features were calculated, describing the 3D shape and size of the lesions. Textural features describing patterns or the spatial distribution of voxel intensities, were calculated from, respectively, gray level co-occurrence (GLCM) [Citation22], gray level run-length (GLRLM) [Citation23] and gray level size-zone texture matrices (GLSZM) [Citation9]. Determining texture matrix representations requires the voxel intensity values within the VOI to be discretized. Voxel intensities were therefore resampled into equally spaced bins using a bin-width of 0.5 units SUV. This discretization step not only reduces image noise, but also normalizes intensities across all patients, allowing for a direct comparison of all calculated textural features between patients. Texture matrices were determined considering 26-connected voxels (i.e. voxels were considered to be neighbors in all 13 directions in three dimensions) and a distance of one voxel between consecutive voxels was set for co-occurrence and gray level run-length matrices. Features derived from co-occurrence and gray level run-length matrices were calculated by averaging their value over all 13 considered directions in three dimensions. Overall, the extracted imaging features comprised 15 first order statistics, 39 descriptors of intensity volume histograms, eight geometric features and 44 textural features. Mathematical definitions, if applicable, for features assessed in our study can be found in Supplementary Appendix A, to be found online at http://informahealthcare.com/doi/abs/10.3109/0284186X.2013.812798
Statistical analysis
The intra-class correlation coefficient (ICC) [Citation24] was calculated to provide an indication of both the test-retest and inter-observer reliability of feature measurements. The ICC is a statistical measure between 0 and 1, where 0 indicates no and 1 indicates perfect reliability. To determine the ICC, variance estimates were obtained through partitioning the total variance by means of non-parametric analysis of variance (ANOVA) by ranks. To assess test-retest reliability of imaging features, we used the definition of ICC(1,1), given by:
Where BMS and WMS are respectively the between- and within-subjects mean squares, obtained by Kruskal-Wallis one-way ANOVA, and κ is the number of repeated measurements (i.e. PET scans). Inter-observer stability was determined with the definition of ICC(3,1), with the form:
Where BMS and EMS are the between-subjects and residual mean squares acquired from Friedman's two-way ANOVA, and κ is the number of observers (i.e. delineators). Absolute variability was estimated as the coefficient of variability (COV), defined as the value below which the difference between two measurements will be with 95% probability [Citation25]:
Where SD is the standard deviation for single differences on different subjects (i.e. lesions). To provide a basis for evaluating the magnitude of the test-retest and inter-observer COV values, we normalized them to a percentage of the mean feature value (COV%mean) as well as the range of feature values (2.5–97.5 percentile; COV%range) over all included lesions. To assess the similarity of the test-retest and inter-observer stability rankings of features we ranked them, per feature group, in terms of their ICC. The similarity of feature rankings was determined with Spearman's rank correlation coefficient (ρs). All statistical analysis was performed in Matlab R2012b (The Mathworks, Natick, MA, USA).
Results
Lesion identification and delineation resulted in a total number of 18 lesions to be included for the test-retest analysis and, respectively, 27 lesions for the inter- observer analysis. Test-retest and inter-observer ICC, COV%mean and COV%range values are summarized per feature group in, respectively, Supplementary Appendix Tables BI and BII, to be found online at http://informahealthcare.com/doi/abs/10.3109/0284186X.2013.812798, where we classified features into three groups, as having a high (ICC ≥ 0.8), medium (0.8 > ICC ≥ 0.5), or low (ICC < 0.5) stability. Results for all individual features are given in Supplementary Appendix Tables BIII–BVI, to be found online at http://informahealthcare.com/doi/abs/10.3109/0284186X.2013.812798.
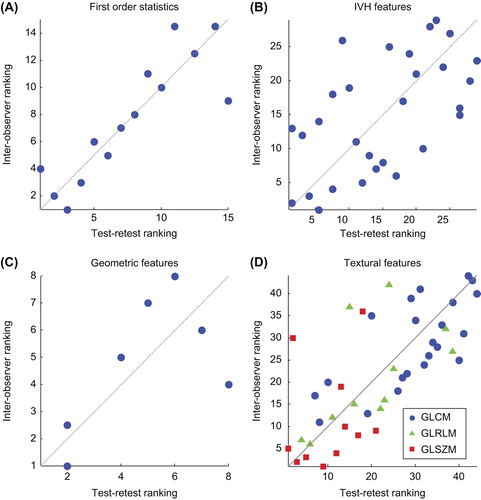
AVRIx and RVRIx for x ≤ 50% were excluded from test-retest analysis, since they represent the entire (relative) tumor volume and therefore provide no additional information on test-retest variability. In summary, 71% of all assessed features had a high, 18% a medium and 11% a low stability in terms of their test-retest ICC. We found a high inter-observer stability for 91% of the imaging features, whereas 8% and 1% of the features had a medium or respectively low stability. As expected, SUVmax and SUVpeak showed perfect inter-observer stability (ICC = 1). Due to the same reasoning outlined above, we also excluded RVRIx and AVRIx for x ≤ 50% from the comparative analysis. Scatter plots of stability rankings for every feature group are depicted in . Considering all features, we observed a good overall similarity in feature stability rankings in terms of test-retest and inter-observer ICCs (ρs = 0.665, p << 0.001). Comparing stability rankings per feature group, we found a high similarity for both the first order statistics (ρs = 0.877, p << 0.001) and the textural features (ρs = 0.719, p << 0.001). As can be observed from , features based on GLSZM have the overall lowest ranks in both analyses, indicating these features have the highest variability amongst all textural features. For the IVH features the observed similarity was more moderate (ρs = 0.572, p << 0.001). Comparing the rankings for the geometric features resulted in a non-significant ρs of 0.663 (p = 0.086). However, from , a positive trend in similarity can be observed. Overall, these results show that features that are more stable in repeated PET imaging are also more robust against inter-observer variability.
Figure 3. Scatter plots of stability rankings of test-retest versus inter-observer intra-class correlation coefficients. A higher rank corresponds with a higher stability. Plotted diagonal illustrates perfect correlation. A. First order statistics (ρs = 0.877, p << 0.001). B. Intensity volume histogram features (ρs = 0.572, p << 0.001). C. Geometric features (ρs = 0.663, p << 0.086). D. Textural features (ρs = 0.719, p << 0.001), with GLCM features in blue circles, GLRLM features in green triangles and GLSZM features in red squares.
Discussion
Increased investigation of quantitative imaging features to monitor response to treatment, treatment outcome or as potential imaging biomarkers, raised the requisite to validate their accuracy, robustness and stability. We first independently investigated the stability of imaging features in both a test-retest and inter-observer setting and subsequently performed an integrated analysis. Our results indicated high ICC values and high stability for the majority of assessed PET image features in both the test-retest (71%) and inter-observer analysis (91%). Furthermore, we found that features that were more stable in repeated imaging were also more robust against multiple tumor delineations. These results suggest that, even though there are different sources of feature variability, one can define a set of features being overall most reliable.
We focused our results mainly on the ICC. Being a dimensionless statistic, the ICC is useful when comparing the stability of measures with different units, as is the case with the PET imaging features assessed in this study. We chose arbitrary ICC thresholds to define high, medium and low stability. There is however no consensus how high the ICC should be to for a measure to be considered to have an acceptably high reliability, since the ICC is a relative measure determined from the between- and within-subject (i.e. lesion) variance, which makes it a sample specific measure. This implies that ICC values obtained from our test-retest analysis were not directly comparable to those from the inter-observer analysis, since they were independently obtained from two different patient cohorts (i.e. different lesions and differences in image acquisition and reconstruction). To overcome this limitation, we ranked features according to their ICC, allowing us to compare stability rankings of features between the two analyses.
In the inter-observer analysis, SUVmax and SUVpeak both had an ICC of 1, indicating perfect stability. However, we did observe a small COV for these features, which was unexpected. A detailed look into all delineations revealed that for only one lesion, one delineator did not include the maximum uptake voxel in the delineated tumor region. Tixier et al. [Citation16] studied the reliability of a number of basic and textural FDG-PET features in a test-retest setting in esophageal cancer. Although the results presented in that study are not directly comparable to our test-retest results, it can be observed that textural features based on gray-level size-zone matrix representations appear to be the least stable ones, which is also supported by our test-retest, inter-observer and integrated analysis.
While the ICC is a useful tool in assessing the reliability of feature measurements, it is not directly related to a feature's clinical usefulness. For a more complete picture, one would like to know if the inter-patient variability or, respectively, the change in feature values between a reference time point (e.g. pre-treatment) and a point of interest (e.g. during or post-treatment) is large enough to be considered useful. To assess this aspect of feature variability, a measure besides the ICC is necessary that provides information on the variability in terms of the feature's unit of measurement. In our study we therefore estimated both the test-retest and inter-observer COV for every feature and normalized them to a percentage of the mean feature value as well as the range, to provide easy to interpret values regarding the magnitude of the COV. The larger the COV is compared to inter-patient variability or changes in feature values, the less likely it is that the feature under consideration is a useful predictor or biomarker. One has to note, however, that like the ICC, COV values are sample specific estimates and typical feature values (i.e. mean and range) are likely to be different when considering different patient populations. Furthermore, the level of variation of a feature that is considered acceptable, depends on its intended purpose.
A limitation of our study is the small number of patients in both cohorts. Although a broad range of tumor sizes and levels of tracer uptake were included, external validation is needed to assess if our results are representative for NSCLC patients in general. Besides feature variability due to repeated imaging and inconsistency between multiple manual tumor delineations, there are more sources of variability that can be taken into consideration. Galavis et al. [Citation17] pointed out that quantitative imaging features are also subject to vary due to different acquisition modes and reconstruction parameters. Also the level of image discretization has been shown to impact the variability of certain textural features, as demonstrated by Tixier et al. [Citation16]. Taking these sources of variability into account, it is evident that standardization is desirable with the prospect of FDG-PET Radiomics features for treatment monitoring, outcome prediction or imaging biomarkers.
Conclusion
The aim of this study was to perform an integrated stability analysis of PET Radiomics features obtained from FDG-PET imaging in NSCLC. Our results showed that the majority of assessed features had both a high test-retest (71%) as well as inter-observer stability (91%) in terms of their ICC. Furthermore, it was observed that features more stable in repeated PET imaging were in general also more robust against inter-observer variability. Results suggest that further research of quantitative imaging features is warranted with respect to more advanced applications of PET imaging as being used for treatment monitoring, outcome prediction or imaging biomarkers.
Supplementary Appendix A, B, C
Download PDF (1.7 MB)Declaration of interest: The authors report no conflicts of interest. The authors alone are responsible for the content and writing of the paper.
Authors acknowledge financial support from the QuIC-ConCePT project, which is partly funded by EFPI A companies and the Innovative Medicine Initiative Joint Undertaking (IMI JU) under Grant Agreement No. 115151. Authors also acknowledge financial support from the National Institute of Health (NIH-USA U01 CA 143062–01, Radiomics of NSCLC), the CTMM framework (AIRFORCE project, grant 030–103), EU 6th and 7th framework program (EUROXY, METOXIA, EURECA, ARTFORCE), euroCAT (IVA Interreg – www.eurocat.info), Kankeronderzoekfonds Limburg from the Health Foundation Limburg and the Dutch Cancer Society (KWF UM 2011–5020, KWF UM 2009–4454).
References
- Lin P, Koh ES, Lin M, Vinod SK, Ho-Shon I, Yap J, et al. Diagnostic and staging impact of radiotherapy planning FDG-PET-CT in non-small-cell lung cancer. Radiother Oncol 2011;101:284–90.
- De Ruysscher D, Nestle U, Jeraj R, Macmanus M. PET scans in radiotherapy planning of lung cancer. Lung Cancer 2012;75:141–5.
- Van Elmpt W, Pottgen C, De Ruysscher D. Therapy response assessment in radiotherapy of lung cancer. Q J Nucl Med Mol Imaging 2011;55:648–54.
- Thie J. Understanding the standardized uptake value, its methods, and implications for usage. J Nucl Med 2004; 45:1431–4.
- van Elmpt W, Ollers M, Dingemans AM, Lambin P, De Ruysscher D. Response assessment using 18F-FDG PET early in the course of radiotherapy correlates with survival in advanced-stage non-small cell lung cancer. J Nucl Med 2012;53:1514–20.
- Takeda A, Yokosuka N, Ohashi T, Kunieda E, Fujii H, Aoki Y, et al. The maximum standardized uptake value (SUVmax) on FDG-PET is a strong predictor of local recurrence for localized non-small-cell lung cancer after stereotactic body radiotherapy (SBRT). Radiother Oncol 2011;101:291–7.
- Velazquez ER, Aerts HJ, Oberije C, De Ruysscher D, Lambin P. Prediction of residual metabolic activity after treatment in NSCLC patients. Acta Oncol 2010;49:1033–9.
- Vaidya M, Creach KM, Frye J, Dehdashti F, Bradley JD, El Naqa I. Combined PET/CT image characteristics for radiotherapy tumor response in lung cancer. Radiother Oncol 2012;102:239–45.
- Tixier F, Le Rest CC, Hatt M, Albarghach N, Pradier O, Metges JP, et al. Intratumor heterogeneity characterized by textural features on baseline 18F-FDG PET images predicts response to concomitant radiochemotherapy in esophageal cancer. J Nucl Med 2011;52:369–78.
- El Naqa I, Grigsby P, Apte A, Kidd E, Donnelly E, Khullar D, et al. Exploring feature-based approaches in PET images for predicting cancer treatment outcomes. Pattern Recognit 2009;42:1162–71.
- Buckler AJ, Bresolin L, Dunnick NR, Sullivan DC. Quantitative imaging test approval and biomarker qualification: Interrelated but distinct activities. Radiology 2011;259:875–84.
- Lambin P, van Stiphout RG, Starmans MH, Rios-Velazquez E, Nalbantov G, Aerts HJ, et al. Predicting outcomes in radiation oncology – multifactorial decision support systems. Nat Rev Clin Oncol 2013;10:27–40.
- Lambin P, Rios-Velazquez E, Leijenaar R, Carvalho S, van Stiphout RG, Granton P, et al. Radiomics: Extracting more information from medical images using advanced feature analysis. Eur J Cancer 2012;48:441–6.
- Kumar V, Gu Y, Basu S, Berglund A, Eschrich SA, Schabath MB, et al. Radiomics: The process and the challenges. Magn Reson Imaging 2012;30:1234–48.
- de Langen AJ, Vincent A, Velasquez LM, van Tinteren H, Boellaard R, Shankar LK, et al. Repeatability of 18F-FDG uptake measurements in tumors: A metaanalysis. J Nucl Med 2012;53:701–8.
- Tixier F, Hatt M, Le Rest CC, Le Pogam A, Corcos L, Visvikis D. Reproducibility of tumor uptake heterogeneity characterization through textural feature analysis in 18F-FDG PET. J Nucl Med 2012;53:693–700.
- Galavis PE, Hollensen C, Jallow N, Paliwal B, Jeraj R. Variability of textural features in FDG PET images due to different acquisition modes and reconstruction parameters. Acta Oncol 2010;49:1012–6.
- Frings V, de Langen AJ, Smit EF, van Velden FH, Hoekstra OS, van Tinteren H, et al. Repeatability of metabolically active volume measurements with 18F-FDG and 18F-FLT PET in non-small cell lung cancer. J Nucl Med 2010;51:1870–7.
- Cheebsumon P, Boellaard R, de Ruysscher D, van Elmpt W, van Baardwijk A, Yaqub M, et al. Assessment of tumour size in PET/CT lung cancer studies: PET- and CT-based methods compared to pathology. EJNMMI Res 2012;2:56.
- van Baardwijk A, Bosmans G, Boersma L, Buijsen J, Wanders S, Hochstenbag M, et al. PET-CT-based auto- contouring in non-small-cell lung cancer correlates with pathology and reduces interobserver variability in the delineation of the primary tumor and involved nodal volumes. Int J Radiat Oncol Biol Phys 2007;68:771–8.
- Deasy JO, Blanco AI, Clark VH. CERR: A computational environment for radiotherapy research. Med Phys 2003;30:979–85.
- Haralick RM, Shanmugam K, Dinstein I. Textural features of image classification. IEEE T Syst Man Cyb 1973; SMC-3:610–21.
- Galloway M. Texture analysis using gray level run lengths. Comput Vision Graph 1975;4:172–9.
- Shrout PE, Fleiss JL. Intraclass correlations: Uses in assessing rater reliability. Psychol Bull 1979;86:420–8.
- Bland J, Altman D. Agreement between methods of measurement with multiple observations per individual. J Biopharm Stat 2007;17:571–82.