Abstract
Integration of molecular imaging PET techniques into therapy selection strategies and radiation treatment planning for head and neck squamous cell carcinoma (HNSCC) can serve several purposes. First, pre-treatment assessments can steer decisions about radiotherapy modifications or combinations with other modalities. Second, biology-based objective functions can be introduced to the radiation treatment planning process by co-registration of molecular imaging with planning computed tomography (CT) scans. Thus, customized heterogeneous dose distributions can be generated with escalated doses to tumor areas where radiotherapy resistance mechanisms are most prevalent. Third, monitoring of temporal and spatial variations in these radiotherapy resistance mechanisms early during the course of treatment can discriminate responders from non-responders. With such information available shortly after the start of treatment, modifications can be implemented or the radiation treatment plan can be adapted tailing the biological response pattern. Currently, these strategies are in various phases of clinical testing, mostly in single-center studies. Further validation in multicenter set-up is needed. Ultimately, this should result in availability for routine clinical practice requiring stable production and accessibility of tracers, reproducibility and standardization of imaging and analysis methods, as well as general availability of knowledge and expertise. Small studies employing adaptive radiotherapy based on functional dynamics and early response mechanisms demonstrate promising results. In this context, we focus this review on the widely used PET tracer 18F-FDG and PET tracers depicting hypoxia and proliferation; two well-known radiation resistance mechanisms.
Over the last decades, treatment modalities for locally advanced head and neck squamous cell carcinoma (HNSCC) have shifted from mainly surgical to radiotherapy, increasingly with the addition of systemic treatments such as chemotherapy or biologically modifying agents [Citation1,Citation2]. Intensity-modulated radiation therapy (IMRT) delivers high conformal doses and facilitates dose escalation to the tumor while reducing doses to normal tissues. Although treatment options have expanded, the locoregional recurrence rate is still relatively high and five-year survival rate usually below 50% [Citation3]. New possibilities are needed to improve outcome for this patient group. Currently, treatment decisions are based on several patient – as well as tumor–parameters deduced from clinical and imaging diagnostics. Individual biological parameters are rarely taken into account, although these are dominant factors in the eventual tumor response to therapy. Also, corrections for morphological and biological tumor changes during (chemo)radiotherapy are seldom applied. In recent years, knowledge about predictive and prognostic biomarkers has increased. Using molecular and functional imaging techniques such as positron emission tomography (PET)-computed tomography (CT) scanning and magnetic resonance (MR) imaging, critical tumor characteristics such as metabolic activity, proliferation, hypoxia and vascularization can be assessed in a non-invasive manner. Definition of biological characteristics before and early during therapy may help to individually adapt and optimize treatment schedules for patients in order to procure a better prognosis and decrease treatment toxicity [Citation4]. Information from imaging modalities can be combined to form a treatment plan, and monitoring of biological response can be used to adjust plans accordingly, instead of basing the entire schedule on a momentary situation before treatment. PET can be implemented to identify specific tumor (sub)volumes with increased radiation resistance that are to receive an escalated radiation dose, to investigate applicability of specific treatment alternatives, or possibly to ascertain cases where treatment de-escalation is an option.
In this review, we discuss developments in the field of molecular PET-CT imaging that can aid the improvement of radiotherapy delivery in HNSCC and thus the improvement of long-term outcome and reduction of toxicity. We focus on the widely used PET tracer 18F-FDG and PET tracers depicting hypoxia and proliferation, which are well-known mechanisms responsible for radiation resistance.
18F-FDG PET
PET with the glucose analogue 2-[18F] fluoro-2-deoxy-D-glucose (18F-FDG) is accepted as a powerful molecular imaging method exploiting the increased metabolic activity of cancer cells. Research is still focused on unearthing the molecular mechanisms underlying the cancer cells’ altered glucose metabolism [Citation5]. Uptake of 18F-FDG has been assessed for correlation with several biological characteristics in tumors, such as glycolysis, glucose transporter-1 (GLUT-1) and hypoxic markers [Citation6,Citation7], proliferation [Citation8], epithelial growth factor receptor (EGFR) [Citation9], protein kinase B (AKT) [Citation10,Citation11] and combinations of several markers [Citation12], with conflicting results. Overall, 18F-FDG uptake in malignancies reflects multifactorial mechanisms of increased metabolic activity and glucose utilization, performed by the glucose transporters and enzymes in the glycolytic pathway, which in turn are regulated by different signaling pathways triggered by endogenous and exogenous stimulators. Attempts to attribute 18F-FDG uptake in different malignancies to expression of one specific protein are therefore debatable.
In HNSCC, 18FDG-PET can lead to TNM stage differences and treatment strategy changes by detecting lymph nodes and distant metastases not discovered using other imaging modalities [Citation13]. However, 18F-FDG PET requires cautious interpretation due to uptake in non-malignant tissues caused by peritumoral inflammation and physiologic changes in the head and neck region as well as limited sensitivity in evaluation of cervical node (micro)metastases [Citation14,Citation15]. Nonetheless, qualitative 18F-FDG PET is increasingly implemented before, during and after radiotherapy of HNSCC.
Target volume delineation for radiotherapy
The use of 18F-FDG PET for target volume delineation in radiotherapy planning for HNSCC has been investigated in single institution studies [Citation13,Citation16–25]. The simplest method for segmentation, visual interpretation of the PET tumor signal, has been commonly applied in many studies, but is highly operator dependent and influenced by window level settings [Citation13,Citation19,Citation22,Citation24]. Other investigators used fixed thresholds based on standardized uptake value (SUV) to segment PET tumor volumes, such as a SUV of 2.5 or 40%/50% of the maximum tumor intensity [Citation23,Citation26]. Models using a fixed (relative) threshold relying on SUV are questionable, notwithstanding tumoral uptake heterogeneity; the head and neck region contains several structures that tend to have a high physiological 18F-FDG uptake, such as the vocal cords and the tonsillar area, which can be erroneously included in the segmented area. Furthermore, SUV can show variation depending on the scanning protocol, blood glucose levels and other patient factors.
Various (semi-)automated PET segmentation algorithms have been proposed to reduce inter- observer variation. Several investigators used advanced adaptive relative threshold segmentation methods based on maximal tumor uptake and/or background uptake [Citation17,Citation18,Citation25,Citation27]. Other techniques have been introduced to refine HNSCC (semi-) automated segmentation, such as methods using image gradients to define tumor areas [Citation28,Citation29], halo-based contouring [Citation21], graph-based segmentation using information from co-registered PET and CT together [Citation30], or an adaptive region growing/dual front active contour model [Citation31]. Several studies addressed impact to the gross tumor volume (GTV) when using 18F-FDG PET segmentation alongside CT images; reported changes mostly concerned a decrease in GTV, especially for the more sophisticated segmentation methods [Citation13,Citation17–21,Citation23,Citation24].
A comparative study by Schinagl et al. [Citation32] of five different segmentation methods reported that PET-segmented volumes frequently extended outside CT delineations, while being smaller on average. Few groups have validated HNSCC delineation using different imaging modalities against surgical resection specimens. In these studies, although describing various PET segmentation methods, 18F-FDG PET-defined GTVs were better related to surgical resection specimens than CT- or MRI- defined GTVs [Citation17,Citation33], but still did not encompass the entire pathological GTV. A gradient-based method using the watershed transform and hierarchical cluster analysis, developed by Geets et al. [Citation20], outperformed the adaptive signal-to-background ratio thresholding method by overestimating macroscopic pathological tumor volume by only 20% instead of 68%. Zaidi et al. [Citation34] tested nine different segmentation methods against surgical specimens and found the best performance (i.e. underestimation of the actual volume by an average of 6%) for a spatial wavelet-based algorithm, which incorporates spatial information during the segmentation process. As more specialized segmentation tools that exploit the differences in metabolism between tumors and surrounding tissues are being developed, the use of 18F-FDG PET for correct primary tumor delineation alongside CT/MRI diagnostics can become a substantial asset. This not only holds true for primary tumors, but also for the correct identification and delineation of lymph node metastases [Citation35]. Furthermore, 18F-FDG PET directed dose distribution could lead to better sparing of organs at risk, such as the parotid glands [Citation18]. However, it is imperative that validated independent and robust methods, which of yet seem to function in highly specialized study settings, become readily available for the clinical practice.
IMRT planning and adaptive radiotherapy based on 18F-FDG PET
Integration of 18F-FDG PET in IMRT planning has been described as beneficial for treatment individualization and dose escalation [Citation36–38]. Groups have reported two-year overall survival of 80–90% and locoregional control of 70–80% after implementation of 8F-FDG PET-CT-based IMRT [Citation39,Citation40]. In a study of 10 HNSCC patients who underwent five 18F-FDG PET-CT scans before and during therapy, Castadot et al. [Citation29] found not only changes in the volume, but also in the position of target volumes and organs at risk during concomitant chemoradiotherapy. This may give rise to adaptive strategies, where patients are re-imaged and re-planned during therapy. However, implementation of adaptive schemes may not be straightforward. Automated delineation methods based on signal-to-background ratios may erroneously expand PET tumor volumes far beyond the actual tumor area during (chemo)therapy, because of decreasing SUV values in tumors and increasing background signals due to induced inflammation during therapy [Citation41,Citation42]. The use of an adequate delineation method during treatment is mandatory for planning adaptation. Geets et al. [Citation28] found that, using a gradient-based algorithm on five pre- and per-treatment 18F-FDG PET scans in 10 HNSCC patients treated with chemoradiotherapy, PET-segmented target volumes reduced significantly during treatment. Adaptive IMRT lead to a decrease in the high-dose volumes compared to pre-treatment CT planning, with little further impact on selected organs at risk, proving this approach useful for dose escalation schemes.
Another concept in the range of PET-based IMRT planning is theragnostic “dose painting by numbers”, where voxel-wise dose prescription and escalation is related to PET tracer uptake to procure a non-uniform radiation dose distribution [Citation43]. A phase I trial at the University of Ghent used adaptive IMRT planning based on dose painting by numbers according to 18F-FDG PET voxel intensities [Citation44]. Median total doses of 80.9 Gy or 85.9 Gy, in a total of 32 fractions, were planned to the high-dose target volumes remaining after 20 fractions. The researchers concluded that although treatment to the 85.9 Gy dose level is feasible, development of late onset mucosal ulcers designated the 80.9 Gy dose level as maximum tolerated dose. Per-treatment re-planning can be beneficial, as described in a prospective trial involving adaptive CT-based IMRT planning mid-treatment [Citation45]. A dosimetric benefit and no negative effects on outcome events were found in 22 patients after a median follow-up of 31 months. The aforementioned studies show that treatment plans can be adapted during therapy, following the metabolic response pattern.
Prognostic value of 18F-FDG PET before, during and after radiotherapy in HNSCC
Increasing numbers of treatment centers use 18F-FDG PET scans for routine diagnostic staging in HNSCC patients. Investigators have looked at the prognostic value of such imaging. Studies in often non-uniformly treated cohorts of HNSCC patients reported that a high pre-treatment 18F-FDG uptake was associated with poor outcome [Citation46–49]. A recent prospective study, however, did not report an overall consistent prognostic PET-parameter (SUV- or metabolic volume-based) for tumors within different regions of the head and neck area in 77 patients treated with (chemo)radiotherapy [Citation50].
Others have focused on the ability of 18F-FDG PET-CT to provide prognostic information and to serve as a tool for treatment response assessment after completion of (chemo)radiotherapy [Citation51]. A meta-analysis concluded that best accuracy in detecting residual or recurrent disease is achieved three months after completion of therapy [Citation52]. 18F-FDG PET could be used for decisions on salvage neck-nodal dissections after (chemo)radiotherapy [Citation53]. However, post-therapy assessment is useless when aiming for early treatment modification to improve outcome or reduce overtreatment. Brun et al. [Citation54] reported more complete remissions and better five-year overall survival in HNSCC patients with tumors showing a low metabolic rate on 18F-FDG PET scans performed 5–10 days after one cycle of neoadjuvant chemotherapy (n = 10) or after a median of 24 Gy radiotherapy (n = 37). One recent study in 37 HNSCC patients treated with chemoradiotherapy reported superior two-year overall survival and locoregional control for patients with a decrease in 18F-FDG PET SUVmax of 50% or more after 10–20 Gy compared to patients who had a lesser decrease [Citation55]. Conversely, another group did not observe a correlation between reduction of 18F-FDG uptake after two weeks of chemoradiotherapy and outcome in 26 patients [Citation56]. They found a prognostic value for 18F-FDG PET-CT performed 8–12 weeks after therapy with regard to disease specific survival and relapse free survival. The prognostic value of 18F-FDG PET before or during treatment therefore remains debated.
In conclusion, information from widely available 18F-FDG PET can complement other diagnostic modalities for treatment decisions and guidance of radiotherapy planning, but it cannot replace clinical examination or CT/MRI scans to obtain important details. Defining the primary tumor boundaries with PET is difficult. For example, it seems impossible to define superficial tumor spread as is mostly found by clinical examination [Citation17,Citation24]. To assess invasion of tumor surrounding tissues, it seems best to use the combined qualities of fused PET-MRI scans [Citation57]. Tumor limits can be misconstrued due to 18F-FDG uptake in surrounding non-malignant tissue or due to a decrease in tumor-to-background ratio during therapy. Highly specialized segmentation methods seem to comply best with histological resection specimens as compared to CT or MRI in a few small studies, and can result in an accurate reduction of GTV and in sparing of normal tissues for radiotherapy planning. Larger multi-institutional studies should generate the most robust imaging quality and segmentation methods [Citation58–60]. Adaptive IMRT planning per-treatment is possible with 18F-FDG PET determination of metabolic HNSCC activity, but more knowledge is needed on the potential volume and spatial shift in 18F-FDG uptake during therapy and its correlation with actual tumor activity as opposed to an inflammatory reaction. Also, more should be known about the relation of 18F-FDG uptake with the site of HNSCC tumor recurrence, which is situated predominantly but not exclusively inside the pretreatment PET-derived target volume in small retrospective series [Citation38,Citation61]. The prognostic value of 18F-FDG PET before and early during treatment may be a valuable asset in assigning and redirecting therapy, but the first outcomes are derived from small heterogeneous non-randomized studies that show conflicting results and have not produced validated and applicable cut-off values for the clinic.
Hypoxia
Hypoxia is an important mechanism of radioresistance in HNSCC [Citation62]. It also impacts on the tumor micro-environment by stimulating angiogenesis and metastatic potential [Citation63]. A high hypoxic fraction in HNSCC is associated with a decreased clinical outcome after radiotherapy [Citation64,Citation65]. Several options to modify hypoxia have been proven successful in improving therapy outcomes, such as accelerated radiotherapy with carbogen and nicotinamide (ARCON) [Citation66] and the hypoxic radiosensitizer nimorazole [Citation67]. Also, dose escalation can be applied to the hypoxic tumor regions. A recent meta-analysis showed an overall beneficial effect of the addition of hypoxic modification to radiotherapy of HNSCC [Citation68].
Hypoxia can be measured by invasive methods such as polarography electrodes or immunohistochemical staining for hypoxia-related markers in tumor biopsies [Citation69]. These methods are prone to sampling errors and have a limited use because of their invasive and technically demanding nature. Biopsies only represent a fraction of the total tumor volume. The extent of hypoxia can vary widely between but also within head and neck tumors. Also, results of hypoxia-modification within individual tumors cannot be monitored rapidly using repeated invasive procedures. Non-invasive hypoxia imaging can provide an attractive substitute. In the field of PET imaging, multiple hypoxia-related markers have been tested during the years. Initially 18F-FDG was thought to be a hypoxic marker, since hypoxic (tumor) cells display an elevated glycolytic activity. However, this depends on the type of glucose metabolism preferred by a tumor; since most HNSCC display an aerobic glycolysis with high glucose utilization even under well-oxygenated circumstances, 18F-FDG uptake is not specifically related to the level of hypoxia [Citation70,Citation71].
Nitroimidazole-based PET tracers
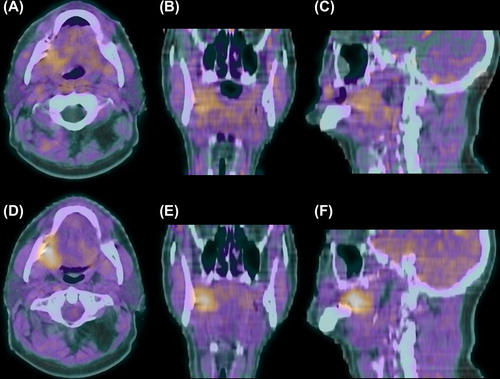
Nitroimidazole-based compounds such as misonidazole and pimonidazole are exogenous markers that selectively bind to hypoxic cells after administration and are frequently used for immunohistochemical staining of tumor sections. Labeled nitroimidazoles can be used as PET tracers of hypoxia. The first and best-known is [18F] Fluoromisonidazole (18F-FMISO) [Citation72]. In 10 HNSCC xenograft models, autoradiography of 18F-FMISO compared with the fraction of pimonidazole-stained tumor on immunohistochemistry revealed that 18F-FMISO accumulation depended on the type of hypoxia distribution pattern; ribbon-like, patchy or homogeneous, with the highest correlation found in ribbon-like hypoxia [Citation73]. Studies evaluating 18F-FMISO uptake in cervical lymph node metastases displayed conflicting correlations with pO2 polarography measurements [Citation74,Citation75]. Several authors stress the methodological limitations of 18F-FMISO and other nitroimidazole-based PET tracers. 18F-FMISO is reduced under hypoxic conditions by intracellular nitroreductase enzymes and bound to cellular macromolecules. 18F-FMISO displays a slow washout of unbound tracer from background tissues, creating a relatively low contrast in images. The spatial separation of hypoxic cells from perfused vessels results in long diffusion times for the tracer to reach hypoxic areas. Spatial information in small tumors is hampered by the inherent PET resolution and by the fact that tracer uptake only occurs in viable hypoxic cells often constituting a small subpopulation of the tumor. There has been debate regarding the ideal imaging time of 18F-FMISO, but overall reliable imaging can take place from two hours after injection onwards, when normal tissues have equilibrated with plasma and hypoxic tissues still show retention of 18F-FMISO [Citation76] (). SUV-defined contrast between HNSCC and background tissues is likely optimal four hours after injection [Citation77], but kinetic modeling can make early quantification more reliable, more appropriate for heterogeneous tumors and therefore more adjusted for individually adapted treatment planning [Citation78]. In order to procure a better contrast between tumor and background, efforts have been made to find nitroimidazole compound tracers with a faster diffusion in tumors as well as a faster whole body clearance than FMISO. Studies focused on more lipophilic nitroimidazoles, such as EF3 and EF5 based on the radiosensitizer etanidazole, resulted in tracers with a good penetration and diffusion in tumors but a simultaneous limited clearance and therefore a varying potential in tumor detection [Citation79,Citation80].
Figure 1. 18F-FMISO PET-CT scan of a cT4N0M0 oral cavity tumor 30 min after injection with diffuse uptake in tumor and normal tissues (A–C) and 3 hours after injection with specific tumor retention (D–F). Transversal (A + D), coronal (B + E) and sagittal (C + F) planes.
A more lipophilic and consequentially more rapidly clearing nitroimidazole compound, 18F- fluoroazomycin arabinoside (18F-FAZA), displayed a good correlation between PET/autoradiography uptake and pimonidazole and Hoechst (perfusion marker) immunohistochemical staining in xenograft models [Citation81]. In two clinical pilot studies, seven of 11 and six of nine HNSCC patients, respectively, showed adequate tumor PET-imaged uptake of 18F-FAZA two hours after injection [Citation82,Citation83]. In the DAHANCA 24 study, 18F-FAZA PET-CT scans prior to and during (chemo)radiotherapy combined with nimorazole, resulted in an identifiable hypoxic tumor volume in 25 of 40 and six of 13 HNSCC patients, respectively [Citation84]. If a hypoxic tumor volume was discernible on the scan procured during therapy, the location was similar but the total volume smaller compared to the pre-therapy scan. During a median follow-up of 19 months there was a significant better disease free survival for patients with non-hypoxic tumors on 18F-FAZA PET-CT than for patients with hypoxic tumors; 93% versus 60%, respectively (p = 0.04).
Another nitroimidazole-based tracer with better water solubility than 18F-FMISO, 18F-HX4 (3-[18F]fluoro-2-(4-((2-nitro-1H-imidazol-1-yl)methyl)-1H-1,2,3,-triazol-1-yl)-propan-1-ol), based on the 2-nitroimidazole pharmacophore, is currently undergoing clinical evaluation. In eight of 12 HNSCC patients, Cheng et al. [Citation85] found similar tumor-to-muscle ratios on 18F-HX4 PET scan performed 1.5 hours after injection compared to 18F-FMISO scans performed two hours after injection on the following day. Two lesions showed no tracer uptake, while two tumors only showed uptake of either 18F-HX4 or 18F-FMISO.
One study describes dynamic PET imaging with the fluorinated nitroimidazole 18F-labeled fluoroerythronitroimidazole (FETNIM) [Citation86].
Other hypoxia PET tracers
An alternative lipophilic PET tracer of hypoxia is based on a metal complex of radioactive copper with ATSM, diacetyl-bis(N4-methylthiosemicarbazone) [Citation87]. The precise mechanisms of hypoxic cell retention of Cu-ATSM and other processes affecting Cu-ATSM stability are unclear [Citation88]. While a clinical study supported the potential of (62)Cu-ATSM as prognostic marker of radiotherapy outcome [Citation89], additional investigations need to establish Cu- ATSM as a specific marker of hypoxia.
Quantifiable PET imaging of endogenous hypoxia-associated markers, such as the membrane protein carbonic anhydrase IX that is upregulated by HIF-1α under hypoxic conditions, is feasible using specific monoclonal antibody (fragments) such as G250 [Citation90,Citation91]. Even though endogenous markers are attractive for use in the clinic, no clinical studies have been undertaken as of yet.
Hypoxia instability
One issue influencing hypoxia imaging with any PET tracer is the instability of hypoxia in HNSCC. A shift in hypoxic regions of head and neck tumors develops over time, with life-times of hypoxic cells spanning from several hours to multiple days [Citation92]. It is argued that the dynamic cellular and micro-environmental processes influencing hypoxia in tumor areas dictate the uptake and retention kinetics of different PET hypoxia tracers, with a highly variable non-linear curve after administration followed by an approximately linearly sloped signal [Citation93]. Repeated 18F-FMISO PET imaging performed three days apart and a mean 162 minutes (range 117–195) after injection in 13 HNSCC patients showed variability in spatial tracer uptake – only six patients showed well-correlated tracer uptake distribution [Citation94]. However, a recent study showed highly stable hypoxic tumor areas in 10 of 11 HNSCC patients, on 18F-FMISO PET scans performed four hours after injection with a two-day interval [Citation95]. Multiple effects, such as a more stabilized tumor- to-blood ratio four hours after injection as opposed to 2–3 hours, a longer time-span between the repeated scans of the former study and differences in imaging- and reconstruction-protocols, might partly explain these outcome differences. Nevertheless, hypoxia regions may show fluctuation during a radiotherapy course and this should be taken into account if hypoxic tumor volumes are utilized for radiotherapy planning.
It is hard to argue a preference for any specific hypoxia (-related) PET tracer for HNSCC based on the currently available data. Most knowledge has been gathered concerning the characteristics of 18F-FMISO. However, more extensive clinical testing might designate another nitroimidazole-based compound, such as 18F-FAZA or 18F-HX4, as the most convenient and reliable tracer in terms of uptake and clearance, earliest post-injection time for imaging, simplicity and cost of production and general applicability in multi-institutional settings. This is unclear as of yet and efforts should focus on defining the best tracer at hand instead of developing yet another hypoxic marker in small (pre-)clinical settings.
Hypoxia PET for radiotherapy planning
Hypoxia PET imaging can be incorporated into the radiotherapy planning process to apply a radiotherapy boost for focal hypoxia. In in silico studies, Chao et al. [Citation96] and Dalah et al. [Citation97] demonstrated that IMRT dose to hypoxic regions defined by high 60Cu-ATSM or 64Cu-ATSM uptake in head and neck tumors could be escalated while normal tissues were spared. The concept of 18F-FMISO or 18F-FAZA PET-guided dose escalation in HNSCC using IMRT was applied by multiple groups [Citation98–104]. Boost doses up to 84 Gy could be achieved without exceeding normal tissue tolerance in silico (however, as mentioned before, 80.9 Gy seems to be the maximum tolerated dose to avoid late-onset mucosal ulcers inside the GTV area [Citation44]). The hypoxic volume demarcation was determined using set tumor uptake/background tissue ratio thresholds or by visual contouring. Grosu et al. [Citation100] also escalated doses to 18F-FAZA positive cervical node subvolumes, but found that specific demarcation was not feasible in 39% of patients when hypoxic areas were diffusely distributed. Most planning studies relied on the assumption of hypoxic tumor region stability, which may not reflect the actual situation. Lin et al. [Citation105] observed that IMRT planned boost doses of 84 Gy on 18F-FMISO positive tumor areas did not cover dissimilar hypoxic areas on PET images obtained three days later (before start of treatment) in four of seven HNSCC patients; the average equivalent uniform dose to the hypoxic tumor volume decreased from 87 Gy to 80 Gy.
Dose painting by numbers according to PET tracer uptake level in tumors in different head and neck areas was technically feasible using 18F-FMISO or 61Cu-ATSM PET images [Citation106–108]. A kinetic model based on repeated 18F-FMISO imaging during radiotherapy indicated that individual re- oxygenation times are linked to tumor control probability (TCP) [Citation109]. Two studies incorporated models into the radiotherapy planning system that could also adjust for tumor re-oxygenation during therapy. Thorwarth et al. [Citation106] estimated that TCP would increase from 56% to 70% using dose painting by numbers based on hypoxia PET. Toma-Dasu et al. [Citation107] proposed a dose-painting model that calculated prescription doses in the events of static or dynamic oxygenation status in tumors during therapy. Tumors with low and homogeneous tracer uptake could theoretically be controlled by prescription doses between 64 and 76 Gy. However, for hypoxic tumors with heterogeneous uptake, doses up to 121 Gy would be required to gain 95% TCP in the event of static oxygenation, which is not an attainable goal. When oxygenation dynamics were incorporated into the model, the 95% TCP dose for the same tumor would be 77 Gy, which is closer to doses used in current practice.
The common limitation in these studies is that they were planning exercises that were not actually delivered to patients.
Outcome prediction using hypoxia PET
The relevance of hypoxia for outcome prediction of advanced HNSCC has been demonstrated in several imaging studies. Elevated pre-therapy 18F-FMISO uptake is related to a worse prognosis for patients treated with (chemo)radiotherapy [Citation110–113]. More hypoxic tumors could therefore be candidates for intensified treatment protocols based on baseline values. But, as mentioned before, hypoxia is a dynamic process and therapy induces re-oxygenation of HNSCC. If partial or total re-oxygenation takes place during therapy, a single pre-therapy hypoxia measurement will be insufficient to allocate or continue hypoxia targeting modalities. Lee et al. [Citation114] found 18F-FMISO uptake in 18 of 20 stage III-IV HNSCC patients before chemoradiotherapy. In the fourth week of treatment, only two patients showed residual hypoxia, but regional/distant recurrence occurred in another patient during follow-up. In 29 patients with repeated 18F-FMISO scans during chemoradiotherapy with or without tirapazamine, all six patients with residual 18F-FMISO uptake after four weeks displayed locoregional or distant failure during follow-up [Citation112]. Zips et al. [Citation115] reported that, in a prospective cohort of 25 patients, 18F-FMISO imaging parameters after 1–2 weeks of chemoradiotherapy provided stronger prognostic potential for local recurrence than pre-treatment parameters. In the 18F-FMISO imaging substudy of a phase II randomized trial that randomized between concurrent chemoradiotherapy alone or combined with tirapazamine as hypoxic cytotoxin, patients with hypoxic tumors showed less locoregional failure in the tirapazamine group than in the chemoradiotherapy-only group [Citation112]. Absence of hypoxia was associated with low risk of locoregional failure in the group treated with chemoradiotherapy alone, suggesting that this group would not benefit from more intensive therapy. This indicates that 18F-FMISO could identify patients who are most likely to benefit from a tirapazamine containing chemoradiotherapy regimen. This notion is underlined by the outcome of a phase III trial analyzing chemoradiotherapy versus chemoradiotherapy with tirapazamine in patients unselected for hypoxia, where addition of tirapazamine to chemoradiotherapy did not improve outcome [Citation116].
In conclusion, non-invasive imaging of the therapy resistance factor hypoxia is feasible and achieved with multiple PET tracers displaying specific accumulation in hypoxic HNSCC areas. 18F-FMISO has been evaluated most extensively and seems to represent hypoxic subvolumes within HNSCC tumors adequately, but no widely applicable quantification and evaluation methods are available for the clinical practice as of yet. Several hypoxia-related PET tracers have been applied for in silico radiotherapy dose escalation planning. The hypoxic tumor subvolume provides a basis for radiotherapy boosting, but small though relevant hypoxic volumes or patterns can remain unnoticed due to the limited PET spatial resolution. Furthermore, reliable dose escalation to resistant tumor regions requires repetitive hypoxia PET imaging during therapy due to fluctuation in oxygenation status, and it is still uncertain which dose levels are necessary to eradicate hypoxic subpopulations. Hypoxia PET results have been shown to have a prognostic as well as a predictive value in small prospective series. This provides a basis for further studies allocating hypoxia modifying treatment according to hypoxia status.
Proliferation
In HNSCC, enhanced proliferative activity and compensatory tumor cell proliferation during treatment adversely affect outcome [Citation117]. Various treatment regimens have been developed to counteract this effect, such as accelerated radiotherapy [Citation118,Citation119], chemoradiotherapy [Citation1], or radiotherapy combined with cetuximab [Citation120], but these approaches also increase side effects [Citation121]. PET monitoring of proliferative activity of tumors before and during treatment may potentially assist in better patient selection and in treatment strategy modification based on early response assessment. PET of proliferation has focused on imaging of thymidine analogue tracers. Thymidine is a native nucleoside, which is incorporated into deoxyribonucleic acid (DNA). Shields et al. [Citation122] introduced the thymidine analogue 3’-deoxy-3’-[18F] fluorothymidine (18F-FLT) as PET tracer, exploiting the activity of the enzyme thymidine kinase 1 (TK1) as measure of proliferative activity. 18F-FLT is phosphorylated by TK1 and trapped intracellularly [Citation122]. During DNA synthesis, TK1 activity increases almost tenfold. 18F-FLT trapping is related to TK1 activity and closely associated with proliferative activity [Citation123]. 18F-FLT has been validated against histopathology in a variety of tumor types [Citation124–126]. In a study of 17 HNSCC patients, 18F-FLT PET SUVmax and SUVmean could not or only weakly be correlated with immunohistochemical staining for proliferation-related markers and TK1 in resected tumor sections [Citation127]. The discrepancy might have been due to differences in biomarker characteristics, discrepancies in resolution of the imaging modalities, and differences in quantification methods. Troost et al. [Citation128] found that 18F-FLT PET in 10 HNSCC patients did not discriminate between metastatic and reactive lymph nodes, since the latter also displayed reactive B-lymphocyte proliferation.
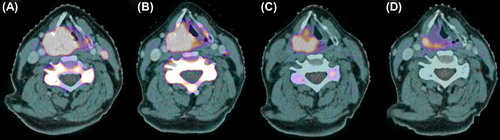
A clinical study of De Langen et al. [Citation129] exhibited the reproducibility of quantitative 18F-FLT PET measurements. Pre-clinical and clinical studies confirmed that radiotherapy reduced 18F-FLT uptake in head and neck tumors early, while no apparent changes in tumor size or morphology could be noted [Citation130,Citation131]. Menda et al. [Citation132] reported kinetic 18F-FLT PET analysis of eight HNSCC patients at baseline and after five days of chemoradiotherapy. Uptake in tumor and metastatic lymph nodes showed a significant decrease after five days of treatment relative to baseline. 18F-FLT PET response was also noted after induction cetuximab in a pilot study with six patients [Citation133]. An example of reduction of 18F-FLT uptake following cetuximab and radiotherapy is shown in .
Figure 2. 18F-FLT PET-CT scans of a patient with a cT4N2M0 hypopharyngeal tumor before therapy (A), after induction cetuximab (B), after 1 week of radiotherapy (two doses of cetuximab, 10 Gy) (C) and after 3 weeks of radiotherapy (four doses of cetuximab, 32 Gy) (D). Note the concurrent reduction in cervical vertebra marrow proliferation after start of radiotherapy.
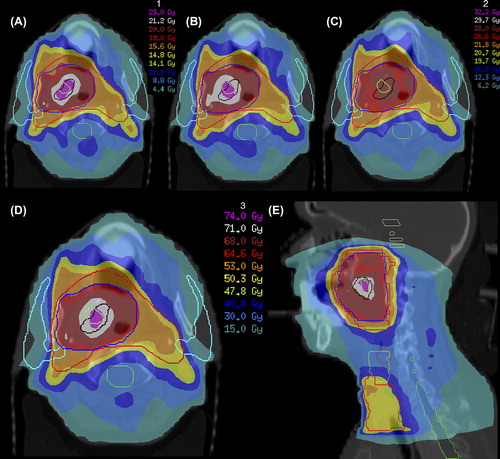
Troost et al. [Citation131] demonstrated that high proliferative tumor subvolumes, as defined by 18F-FLT PET, can provide the basis for an IMRT plan with dose escalation within these regions (). In this study concerning 10 oropharyngeal carcinoma patients, repeated 18F-FLT PET indicated that the highly proliferative volumes (delineated by 80% of SUVmax) displayed moderately stable spatial similarity between baseline PET and PET after one week of (chemo)radiotherapy, but large inter-individual differences occurred. Although SUVmax decreased significantly between scans as well, which might have influenced the segmentation method, this indicates that therapy induces spatial instability in proliferative subvolumes, similar to hypoxic subvolumes.
Figure 3. Dose-escalation to GTV80%1 (as delineated using a cut-off of 80% of maximum tumor uptake signal in a 18F-FLT PET-CT scan performed before start of radiotherapy) and GTV80%2 (as delineated in a 18F-FLT PET-CT scan performed after 1 week of radiotherapy) for a cT3N0M0 oropharyngeal tumor. Using IMRT with integrated simultaneous boost technique, total dose was 50.3 Gy to bilateral cervical lymph node regions (large planning target volume, red) and 68 Gy to primary tumor (small planning target volume, blue); in 34 fractions. GTV80%1 (black) and GTV80%2 (green) were consecutively irradiated with 2.3 Gy for 10 fractions, resulting in a dose of 71 Gy in total and a dose of 74 Gy in the overlapping region. (A and B) Dose distributions for first 2 weeks of treatment (A) and weeks 3 and 4 (B). (C) Dose distribution for remaining 14 fractions without dose-escalation. (D and E) Dose distributions of total treatment plan in transverse (D) and sagittal (E) planes. Parotid glands are delineated in sky blue and spinal cord in green. This figure was originally published in JNM. Troost EG, Bussink J, Hoffmann AL, Boerman OC, Oyen WJ, Kaanders JH. 18F-FLT PET/CT for early response monitoring and dose-escalation in oropharyngeal tumors. J Nucl Med 2010;51:866–74. © by the Society of Nuclear Medicine and Molecular Imaging, Inc.
Repeated 18F-FLT PET in HNSCC has been demonstrated to correlate with treatment outcome [Citation47,Citation134]. In a study of 48 HNSCC patients treated with (chemo)radiotherapy, Hoeben et al. [Citation134] reported early 18F-FLT PET response between baseline and after one and three weeks of therapy. SUVmax and visually contoured proliferative volumes of the primary tumors decreased significantly between consecutive scans, while signal-to-background and 50%-of-maximum signal segmentation methods failed to delineate plausible proliferative tumor volumes as the 18F-FLT tumor uptake signal reduced during therapy. Baseline tumor SUVmax and visually delineated proliferative volume, as well as their decrease early during therapy, were prognostic for three-year locoregional control and disease free survival. Kishino et al. [Citation135] performed 18F-FLT PET and 18F-FDG PET scans before therapy, after four weeks of radiotherapy and five weeks after completion of therapy in 28 patients. 18F-FLT decreased most significantly during radiotherapy, with a complete response in 63% of patients compared to 16% on 18F-FDG PET. Patients with residual post-treatment activity on either modality had significantly worse three-year local control than patients with a complete response. Specificity and overall accuracy of 18F-FLT PET were significantly higher than those of 18F-FDG PET (i.e. 72% and 74% vs. 19% and 30% after 40 Gy radiotherapy, respectively, p < 0.0001; and 80% and 81% vs. 48% and 57% five weeks after radiotherapy, respectively, p < 0.01). In a follow-up report, no clinical recurrences were diagnosed in patients showing a primary tumor SUV ratio < 1.5 for the mid-treatment versus post-treatment scan, while no such correlation was found for 18F-FDG PET [Citation136].
The high specificity of 18F-FLT PET, not influenced by inflammatory processes in the primary tumor like 18F-FDG, and its ability to characterize proliferation before and early during therapy, make it an attractive tracer in the development of individualized HNSCC patient management. It could help clinical judgments concerning the addition of systemic therapy or targeted agents to radiotherapy or concerning the application of accelerated radiotherapy. However, more detailed fundamental knowledge on 18F-FLT uptake in different tumor types is needed; e.g. the extent to which tumors depend on a de novo thymidine synthesis pathway as opposed to on a thymidine salvage pathway influences the degree in which 18F-FLT uptake represents actual proliferative activity [Citation137]. More information regarding the extent of region fluctuation of proliferation during therapy, as described by Troost et al. [Citation131], is of essence if 18F-FLT PET were to be used for (adaptive) boost localization. Furthermore, the prognostic and predictive value in different studies has not been translated into applicable quantifiers to be used for treatment allocation or patient risk group stratification in prospective studies.
Conclusions and future perspectives
The material presented in this review exemplifies a large basis for the implementation of molecular PET imaging in the management of HNSCC patients. However, this basis is multi-faceted and reliant on numerous heterogeneous small studies reporting on a range of tracers that are diversely applied, with varying analytic methodology for divergent research questions. PET tracers imaging distinct biological tumor characteristics offer specific possibilities for individualized therapy. Dirix et al. [Citation138] even reported the added value of combining 18F-FDG PET, 18F-FMISO PET, diffusion weighted MRI and dynamic contrast-enhanced MRI before and during chemoradiotherapy for radiotherapy planning, early response assessment and prognosis prediction in 15 patients. However, it is hardly feasible to perform standard multiple molecular/functional imaging modalities alongside the routine imaging modalities in HNSCC patients. A priori research questions should be clearly formulated and HNSCC patient care should be centralized to prevent an inexorable expansion of diagnostic and therapeutic procedures that do not adhere to evidence-based protocols.
Before implementation of molecular PET imaging in the clinical practice, several issues need to be addressed. The procedures for acquiring and processing PET have to be standardized before insertion into radiotherapy protocols [Citation139]. If repeated imaging before and during therapy is warranted, efforts should be taken to assure patient comfort and reproducibility. Random set-up errors in patient or tumor position should be kept to a minimum [Citation140].
Additionally, there is the issue of image resolution; a PET voxel size of approximately 4 × 4 mm cannot be optimally matched to the biological processes on a microscopic level [Citation141]. PET spatial resolution is also diminished by the physical characteristics of the positron emitter, the inherent positron range of selected tracers and by blurring and partial volume effects. It may be difficult to distinguish heterogeneous uptake areas within tumors, certainly if signal-to-background ratios are low. However, any issues regarding spatial resolution of PET are counterbalanced by the also limited precision for dose calculation and delivery over a number of radiotherapy fractions. Such matters are certainly critical obstacles in the dependable implementation of, e.g., precision-based dose painting by numbers. Regarding the reliable delineation of target volumes, additional efforts are required. There is a definite need for a validated, reliable and robust delineation method that can be widely applied before and during therapy, applicable to multiple PET systems and tracers. A strong collaboration of radiotherapy and nuclear medicine departments in broader settings can achieve the common goal of finding an optimal method in shared large, high-quality validation sets as suggested by Lee [Citation59].
Implementation of PET for tailoring of radiotherapy-based treatment and ultimately for improving HNSCC patients’ outcome will be feasible in the future, but significant hurdles remain to be taken.
Declaration of interest: The authors report no conflicts of interest. The authors alone are responsible for the content and writing of the paper.
References
- Blanchard P, Baujat B, Holostenco V, Bourredjem A, Baey C, Bourhis J, et al. Meta-analysis of chemotherapy in head and neck cancer (MACH-NC): A comprehensive analysis by tumour site. Radiother Oncol 2011;100:33–40.
- Bonner JA, Harari PM, Giralt J, Cohen RB, Jones CU, Sur RK, et al. Radiotherapy plus cetuximab for locoregionally advanced head and neck cancer: 5-year survival data from a phase 3 randomised trial, and relation between cetuximab-induced rash and survival. Lancet Oncol 2010;11:21–8.
- Pignon JP, le Maitre A, Maillard E, Bourhis J. Meta-analysis of chemotherapy in head and neck cancer (MACH-NC): An update on 93 randomised trials and 17,346 patients. Radiother Oncol 2009;92:4–14.
- Gregoire V, Jeraj R, Lee JA, O’Sullivan B. Radiotherapy for head and neck tumours in 2012 and beyond: Conformal, tailored, and adaptive?Lancet Oncol 2012;13:e292–300.
- Buerkle A, Weber WA. Imaging of tumor glucose utilization with positron emission tomography. Cancer Metastasis Rev 2008;27:545–54.
- Busk M, Horsman MR, Kristjansen PE, van der Kogel AJ, Bussink J, Overgaard J. Aerobic glycolysis in cancers: Implications for the usability of oxygen-responsive genes and fluorodeoxyglucose-PET as markers of tissue hypoxia. Int J Cancer 2008;122:2726–34.
- Yamada T, Uchida M, Kwang-Lee K, Kitamura N, Yoshimura T, Sasabe E, et al. Correlation of metabolism/hypoxia markers and fluorodeoxyglucose uptake in oral squamous cell carcinomas. Oral Surg Oral Med Oral Pathol Oral Radiol 2012;113:464–71.
- Buck AK, Halter G, Schirrmeister H, Kotzerke J, Wurziger I, Glatting G, et al. Imaging proliferation in lung tumors with PET: 18F-FLT versus 18F-FDG. J Nucl Med 2003;44:1426–31.
- Taylor MD, Smith PW, Brix WK, Wick MR, Theodosakis N, Swenson BR, et al. Correlations between selected tumor markers and fluorodeoxyglucose maximal standardized uptake values in esophageal cancer. Eur J Cardiothorac Surg 2009;35:699–705.
- Ma WW, Jacene H, Song D, Vilardell F, Messersmith WA, Laheru D, et al. [18F]fluorodeoxyglucose positron emission tomography correlates with Akt pathway activity but is not predictive of clinical outcome during mTOR inhibitor therapy. J Clin Oncol 2009;27:2697–704.
- Nguyen QD, Perumal M, Waldman TA, Aboagye EO. Glucose metabolism measured by [(1)(8)F]fluorodeoxyglucose positron emission tomography is independent of PTEN/AKT status in human colon carcinoma cells. Transl Oncol 2011;4:241–8.
- Deron P, Vangestel C, Goethals I, De Potter A, Peeters M, Vermeersch H, et al. FDG uptake in primary squamous cell carcinoma of the head and neck. The relationship between overexpression of glucose transporters and hexokinases, tumour proliferation and apoptosis. Nuklearmedizin 2011;50:15–21.
- Delouya G, Igidbashian L, Houle A, Belair M, Boucher L, Cohade C, et al. (1)(8)F-FDG-PET imaging in radiotherapy tumor volume delineation in treatment of head and neck cancer. Radiother Oncol 2011;101:362–8.
- Strauss LG. Fluorine-18 deoxyglucose and false-positive results: A major problem in the diagnostics of oncological patients. Eur J Nucl Med 1996;23:1409–15.
- Kyzas PA, Evangelou E, Denaxa-Kyza D, Ioannidis JP. 18F-fluorodeoxyglucose positron emission tomography to evaluate cervical node metastases in patients with head and neck squamous cell carcinoma: A meta-analysis. JNCI 2008;100:712–20.
- Nishioka T, Shiga T, Shirato H, Tsukamoto E, Tsuchiya K, Kato T, et al. Image fusion between 18FDG-PET and MRI/CT for radiotherapy planning of oropharyngeal and nasopharyngeal carcinomas. Int J Radiat Oncol Biol Phys 2002;53:1051–7.
- Daisne JF, Duprez T, Weynand B, Lonneux M, Hamoir M, Reychler H, et al. Tumor volume in pharyngolaryngeal squamous cell carcinoma: Comparison at CT, MR imaging, and FDG PET and validation with surgical specimen. Radiology 2004;233:93–100.
- Geets X, Daisne JF, Tomsej M, Duprez T, Lonneux M, Gregoire V. Impact of the type of imaging modality on target volumes delineation and dose distribution in pharyngo-laryngeal squamous cell carcinoma: Comparison between pre- and per-treatment studies. Radiother Oncol 2006;78:291–7.
- Riegel AC, Berson AM, Destian S, Ng T, Tena LB, Mitnick RJ, et al. Variability of gross tumor volume delineation in head-and-neck cancer using CT and PET/CT fusion. Int J Radiat Oncol Biol Phys 2006;65:726–32.
- Geets X, Lee JA, Bol A, Lonneux M, Gregoire V. A gradient-based method for segmenting FDG-PET images: Methodology and validation. Eur J Nucl Med Mol Imaging 2007;34:1427–38.
- Ashamalla H, Guirgius A, Bieniek E, Rafla S, Evola A, Goswami G, et al. The impact of positron emission tomography/computed tomography in edge delineation of gross tumor volume for head and neck cancers. Int J Radiat Oncol Biol Phys 2007;68:388–95.
- Breen SL, Publicover J, De Silva S, Pond G, Brock K, O’Sullivan B, et al. Intraobserver and interobserver variability in GTV delineation on FDG-PET-CT images of head and neck cancers. Int J Radiat Oncol Biol Phys 2007;68:763–70.
- Deantonio L, Beldi D, Gambaro G, Loi G, Brambilla M, Inglese E, et al. FDG-PET/CT imaging for staging and radiotherapy treatment planning of head and neck carcinoma. Radiat Oncol 2008;3:29.
- Thiagarajan A, Caria N, Schoder H, Iyer NG, Wolden S, Wong RJ, et al. Target volume delineation in oropharyngeal cancer: Impact of PET, MRI, and physical examination. Int J Radiat Oncol Biol Phys 2012;83:220–7.
- Perez-Romasanta LA, Bellon-Guardia M, Torres-Donaire J, Lozano-Martin E, Sanz-Martin M, Velasco-Jimenez J. Tumor volume delineation in head and neck cancer with 18-fluor-fluorodeoxiglucose positron emission tomography: Adaptive thresholding method applied to primary tumors and metastatic lymph nodes. Clin Transl Oncol 2013;15: 283–93.
- Moule RN, Kayani I, Moinuddin SA, Meer K, Lemon C, Goodchild K, et al. The potential advantages of (18)FDG PET/CT-based target volume delineation in radiotherapy planning of head and neck cancer. Radiother Oncol 2010;97:189–93.
- van Dalen JA, Hoffmann AL, Dicken V, Vogel WV, Wiering B, Ruers TJ, et al. A novel iterative method for lesion delineation and volumetric quantification with FDG PET. Nucl Med Commun 2007;28:485–93.
- Geets X, Tomsej M, Lee JA, Duprez T, Coche E, Cosnard G, et al. Adaptive biological image-guided IMRT with anatomic and functional imaging in pharyngo-laryngeal tumors: Impact on target volume delineation and dose distribution using helical tomotherapy. Radiother Oncol 2007;85:105–15.
- Castadot P, Geets X, Lee JA, Christian N, Gregoire V. Assessment by a deformable registration method of the volumetric and positional changes of target volumes and organs at risk in pharyngo-laryngeal tumors treated with concomitant chemo-radiation. Radiother Oncol 2010;95: 209–17.
- Han D, Bayouth J, Song Q, Taurani A, Sonka M, Buatti J, et al. Globally optimal tumor segmentation in PET-CT images: A graph-based co-segmentation method. Inf Process Med Imaging 2011;22:245–56.
- Hatt M, Cheze-Le Rest C, Aboagye EO, Kenny LM, Rosso L, Turkheimer FE, et al. Reproducibility of 18F-FDG and 3’-deoxy-3’-18F-fluorothymidine PET tumor volume measurements. J Nucl Med 2010;51:1368–76.
- Schinagl DA, Vogel WV, Hoffmann AL, van Dalen JA, Oyen WJ, Kaanders JH. Comparison of five segmentation tools for 18F-fluoro-deoxy-glucose-positron emission tomography-based target volume definition in head and neck cancer. Int J Radiat Oncol Biol Phys 2007;69: 1282–9.
- Caldas-Magalhaes J, Kasperts N, Kooij N, van den Berg CA, Terhaard CH, Raaijmakers CP, et al. Validation of imaging with pathology in laryngeal cancer: Accuracy of the registration methodology. Int J Radiat Oncol Biol Phys 2012;82:e289–98.
- Zaidi H, Abdoli M, Fuentes CL, El Naqa IM. Comparative methods for PET image segmentation in pharyngolaryngeal squamous cell carcinoma. Eur J Nucl Med Mol Imaging 2012;39:881–91.
- Schinagl DA, Hoffmann AL, Vogel WV, van Dalen JA, Verstappen SM, Oyen W, et al. Can FDG-PET assist in radiotherapy target volume definition of metastatic lymph nodes in head-and-neck cancer?Radiat Oncol 2009;91: 95–100.
- Schwartz DL, Ford EC, Rajendran J, Yueh B, Coltrera MD, Virgin J, et al. FDG-PET/CT-guided intensity modulated head and neck radiotherapy: A pilot investigation. Head Neck 2005;27:478–87.
- Vanderstraeten B, Duthoy W, De Gersem W, De Neve W, Thierens H.[18F]fluoro-deoxy-glucose positron emission tomography ([18F]FDG-PET) voxel intensity-based intensity-modulated radiation therapy (IMRT) for head and neck cancer. Radiother Oncol 2006;79:249–58.
- Madani I, Duthoy W, Derie C, De Gersem W, Boterberg T, Saerens M, et al. Positron emission tomography-guided, focal-dose escalation using intensity-modulated radiotherapy for head and neck cancer. Int J Radiat Oncol Biol Phys 2007;68:126–35.
- Rothschild S, Studer G, Seifert B, Huguenin P, Glanzmann C, Davis JB, et al. PET/CT staging followed by intensity-modulated radiotherapy (IMRT) improves treatment outcome of locally advanced pharyngeal carcinoma: A matched-pair comparison. Radiat Oncol 2007;2:22.
- Vernon MR, Maheshwari M, Schultz CJ, Michel MA, Wong SJ, Campbell BH, et al. Clinical outcomes of patients receiving integrated PET/CT-guided radiotherapy for head and neck carcinoma. Int J Radiat Oncol Biol Phys 2008; 70:678–84.
- Hentschel M, Appold S, Schreiber A, Abramyuk A, Abolmaali N, Kotzerke J, et al. Serial FDG-PET on patients with head and neck cancer: Implications for radiation therapy. Int J Radiat Biol 2009;85:796–804.
- Moule RN, Kayani I, Prior T, Lemon C, Goodchild K, Sanghera B, et al. Adaptive 18fluoro-2-deoxyglucose positron emission tomography/computed tomography-based target volume delineation in radiotherapy planning of head and neck cancer. Clin Oncol (R Coll Radiol) 2011; 23:364–71.
- Bentzen SM. Theragnostic imaging for radiation oncology: Dose-painting by numbers. Lancet Oncol 2005;6: 112–7.
- Madani I, Duprez F, Boterberg T, Van de Wiele C, Bonte K, Deron P, et al. Maximum tolerated dose in a phase I trial on adaptive dose painting by numbers for head and neck cancer. Radiother Oncol 2011;101:351–5.
- Schwartz DL, Garden AS, Thomas J, Chen Y, Zhang Y, Lewin J, et al. Adaptive radiotherapy for head-and-neck cancer: Initial clinical outcomes from a prospective trial. Int J Radiat Oncol Biol Phys 2012;83:986–93.
- Kim YS, Roh J-L, Kim MR, Kim JS, Choi S-H, Nam SY, et al. Use of 18F-FDG PET for primary treatment strategy in patients with squamous cell carcinoma of the oropharynx. J Nucl Med 2007;48:752–7.
- Linecker A, Kermer C, Sulzbacher I, Angelberger P, Kletter K, Dudczak R, et al. Uptake of (18)F-FLT and (18)F-FDG in primary head and neck cancer correlates with survival. Nuklearmedizin 2008;47:80–5.
- Seol YM, Kwon BR, Song MK, Choi YJ, Shin HJ, Chung JS, et al. Measurement of tumor volume by PET to evaluate prognosis in patients with head and neck cancer treated by chemo-radiation therapy. Acta Oncol 2010;49:201–8.
- Dibble EH, Alvarez AC, Truong MT, Mercier G, Cook EF, Subramaniam RM. 18F-FDG metabolic tumor volume and total glycolytic activity of oral cavity and oropharyngeal squamous cell cancer: Adding value to clinical staging. J Nucl Med 2012;53:709–15.
- Schinagl DA, Span PN, Oyen WJ, Kaanders JH. Can FDG PET predict radiation treatment outcome in head and neck cancer?Results of a prospective study. Eur J Nucl Med Mol Imaging 2011;38:1449–58.
- Hoshikawa H, Kishino T, Nishiyama Y, Yamamoto Y, Yonezaki M, Mori N. Early prediction of local control in head and neck cancer after chemoradiotherapy by FDG-PET. Nucl Med Commun 2011;32:684–9.
- Isles MG, McConkey C, Mehanna HM. A systematic review and meta-analysis of the role of positron emission tomography in the follow up of head and neck squamous cell carcinoma following radiotherapy or chemoradiotherapy. Clin Otolaryngol 2008;33:210–22.
- Schoder H, Fury M, Lee N, Kraus D. PET monitoring of therapy response in head and neck squamous cell carcinoma. J Nucl Med 2009;50(Suppl 1):74S–88S.
- Brun E, Kjellen E, Tennvall J, Ohlsson T, Sandell A, Perfekt R, et al. FDG PET studies during treatment: prediction of therapy outcome in head and neck squamous cell carcinoma. Head Neck 2002;24:127–35.
- Hentschel M, Appold S, Schreiber A, Abolmaali N, Abramyuk A, Dorr W, et al. Early FDG PET at 10 or 20 Gy under chemoradiotherapy is prognostic for locoregional control and overall survival in patients with head and neck cancer. Eur J Nucl Med Mol Imaging 2011;38:1203–11.
- Castaldi P, Rufini V, Bussu F, Micciche F, Dinapoli N, Autorino R, et al. Can “early” and “late”(18)F-FDG PET-CT be used as prognostic factors for the clinical outcome of patients with locally advanced head and neck cancer treated with radio-chemotherapy?Radiother Oncol 2012;103:63–8.
- Huang SH, Chien CY, Lin WC, Fang FM, Wang PW, Lui CC, et al. A comparative study of fused FDG PET/MRI, PET/CT, MRI, and CT imaging for assessing surrounding tissue invasion of advanced buccal squamous cell carcinoma. Clin Nucl Med 2011;36:518–25.
- Cheebsumon P, Yaqub M, van Velden FH, Hoekstra OS, Lammertsma AA, Boellaard R. Impact of [(1)(8)F]FDG PET imaging parameters on automatic tumour delineation: Need for improved tumour delineation methodology. Eur J Nucl Med Mol Imaging 2011;38:2136–44.
- Lee JA. Segmentation of positron emission tomography images: Some recommendations for target delineation in radiation oncology. Radiother Oncol 2010;96:302–7.
- Boellaard R. Standards for PET image acquisition and quantitative data analysis. J Nucl Med 2009;50(Suppl 1):11S–20S.
- Soto DE, Kessler ML, Piert M, Eisbruch A. Correlation between pretreatment FDG-PET biological target volume and anatomical location of failure after radiation therapy for head and neck cancers. Radiother Oncol 2008;89: 13–8.
- Brizel DM, Sibley GS, Prosnitz LR, Scher RL, Dewhirst MW. Tumor hypoxia adversely affects the prognosis of carcinoma of the head and neck. Int J Radiat Oncol Biol Phys 1997;38:285–9.
- Vaupel P. The role of hypoxia-induced factors in tumor progression. Oncologist 2004;9(Suppl 5):10–7.
- Nordsmark M, Bentzen SM, Rudat V, Brizel D, Lartigau E, Stadler P, et al. Prognostic value of tumor oxygenation in 397 head and neck tumors after primary radiation therapy. An international multi-center study. Radiother Oncol 2005; 77:18–24.
- Kaanders JH, Wijffels KI, Marres HA, Ljungkvist AS, Pop LA, van den Hoogen FJ, et al. Pimonidazole binding and tumor vascularity predict for treatment outcome in head and neck cancer. Cancer Res 2002;62:7066–74.
- Janssens GO, Rademakers SE, Terhaard CH, Doornaert PA, Bijl HP, van den Ende P, et al. Accelerated radiotherapy with carbogen and nicotinamide for laryngeal cancer: Results of a phase III randomized trial. J Clin Oncol 2012;30:1777–83.
- Overgaard J, Hansen HS, Overgaard M, Bastholt L, Berthelsen A, Specht L, et al. A randomized double-blind phase III study of nimorazole as a hypoxic radiosensitizer of primary radiotherapy in supraglottic larynx and pharynx carcinoma. Results of the Danish Head and Neck Cancer Study (DAHANCA) Protocol 5-85. Radiother Oncol 1998;46:135–46.
- Overgaard J. Hypoxic modification of radiotherapy in squamous cell carcinoma of the head and neck – a systematic review and meta-analysis. Radiother Oncol 2011;100: 22–32.
- Nordsmark M, Eriksen JG, Gebski V, Alsner J, Horsman MR, Overgaard J. Differential risk assessments from five hypoxia specific assays: The basis for biologically adapted individualized radiotherapy in advanced head and neck cancer patients. Radiother Oncol 2007;83:389–97.
- Busk M, Horsman MR, Jakobsen S, Bussink J, van der Kogel A, Overgaard J. Cellular uptake of PET tracers of glucose metabolism and hypoxia and their linkage. Eur J Nucl Med Mol Imaging 2008;35:2294–303.
- Rajendran JG, Mankoff DA, O’Sullivan F, Peterson LM, Schwartz DL, Conrad EU, et al. Hypoxia and glucose metabolism in malignant tumors: Evaluation by [18F]fluoromisonidazole and [18F]fluorodeoxyglucose positron emission tomography imaging. Clin Cancer Res 2004; 10:2245–52.
- Rasey JS, Grunbaum Z, Magee S, Nelson NJ, Olive PL, Durand RE, et al. Characterization of radiolabeled fluoromisonidazole as a probe for hypoxic cells. Radiat Res 1987;111:292–304.
- Troost EG, Laverman P, Philippens ME, Lok J, van der Kogel AJ, Oyen WJ, et al. Correlation of [(18)F]FMISO autoradiography and pimonodazole immunohistochemistry in human head and neck carcinoma xenografts. Eur J Nucl Med Mol Imaging 2008;35:1803–11.
- Gagel B, Piroth M, Pinkawa M, Reinartz P, Zimny M, Kaiser HJ, et al. pO polarography, contrast enhanced color duplex sonography (CDS), [18F] fluoromisonidazole and [18F] fluorodeoxyglucose positron emission tomography: Validated methods for the evaluation of therapy-relevant tumor oxygenation or only bricks in the puzzle of tumor hypoxia?BMC Cancer 2007;7:113.
- Mortensen LS, Buus S, Nordsmark M, Bentzen L, Munk OL, Keiding S, et al. Identifying hypoxia in human tumors: A correlation study between 18F-FMISO PET and the Eppendorf oxygen-sensitive electrode. Acta Oncol 2010; 49:934–40.
- Koh WJ, Rasey JS, Evans ML, Grierson JR, Lewellen TK, Graham MM, et al. Imaging of hypoxia in human tumors with [F-18]fluoromisonidazole. Int J Radiat Oncol Biol Phys 1992;22:199–212.
- Abolmaali N, Haase R, Koch A, Zips D, Steinbach J, Baumann M, et al. Two or four hour [18F]FMISO-PET in HNSCC. When is the contrast best?Nuklearmedizin 2011; 50:22–7.
- Thorwarth D, Eschmann SM, Paulsen F, Alber M. A kinetic model for dynamic [18F]-Fmiso PET data to analyse tumour hypoxia. Phys Med Biol 2005;50:2209–24.
- Komar G, Seppanen M, Eskola O, Lindholm P, Gronroos TJ, Forsback S, et al. 18F-EF5: A new PET tracer for imaging hypoxia in head and neck cancer. J Nucl Med 2008;49:1944–51.
- Mahy P, Geets X, Lonneux M, Leveque P, Christian N, De Bast M, et al. Determination of tumour hypoxia with [(18)F]EF3 in patients with head and neck tumours: A phase I study to assess the tracer pharmacokinetics, biodistribution and metabolism. Eur J Nucl Med Mol Imaging 2008;35: 1282–9.
- Busk M, Horsman MR, Jakobsen S, Keiding S, van der Kogel AJ, Bussink J, et al. Imaging hypoxia in xenografted and murine tumors with 18F-fluoroazomycin arabinoside: A comparative study involving microPET, autoradiography, PO2-polarography, and fluorescence microscopy. Int J Radiat Oncol Biol Phys 2008;70:1202–12.
- Souvatzoglou M, Grosu AL, Roper B, Krause BJ, Beck R, Reischl G, et al. Tumour hypoxia imaging with [18F]FAZA PET in head and neck cancer patients: A pilot study. Eur J Nucl Med Mol Imaging 2007;34:1566–75.
- Postema EJ, McEwan AJ, Riauka TA, Kumar P, Richmond DA, Abrams DN, et al. Initial results of hypoxia imaging using 1-alpha-D: -(5-deoxy-5-[(18)F]- fluoroarabinofuranosyl)-2-nitroimidazole ((18)F-FAZA). Eur J Nucl Med Mol Imaging 2009;36:1565–73.
- Mortensen LS, Johansen J, Kallehauge J, Primdahl H, Busk M, Lassen P, et al. FAZA PET/CT hypoxia imaging in patients with squamous cell carcinoma of the head and neck treated with radiotherapy: Results from the DAHANCA 24 trial. Radiother Oncol 2012;105:14–20.
- Chen L, Zhang Z, Kolb HC, Walsh JC, Zhang J, Guan Y. (1)(8)F-HX4 hypoxia imaging with PET/CT in head and neck cancer: A comparison with (1)(8)F-FMISO. Nucl Med Commun 2012;33:1096–102.
- Lehtio K, Oikonen V, Gronroos T, Eskola O, Kalliokoski K, Bergman J, et al. Imaging of blood flow and hypoxia in head and neck cancer: Initial evaluation with [(15)O]H(2)O and [(18)F]fluoroerythronitroimidazole PET. J Nucl Med 2001; 42:1643–52.
- Fujibayashi Y, Taniuchi H, Yonekura Y, Ohtani H, Konishi J, Yokoyama A. Copper-62-ATSM: A new hypoxia imaging agent with high membrane permeability and low redox potential. J Nucl Med 1997;38:1155–60.
- Holland JP, Lewis JS, Dehdashti F. Assessing tumor hypoxia by positron emission tomography with Cu-ATSM. Q J Nucl Med Mol Imaging 2009;53:193–200.
- Minagawa Y, Shizukuishi K, Koike I, Horiuchi C, Watanuki K, Hata M, et al. Assessment of tumor hypoxia by 62Cu-ATSM PET/CT as a predictor of response in head and neck cancer: A pilot study. Ann Nucl Med 2011; 25:339–45.
- Troost EG, Bussink J, Kaanders JH, van EJ, Peters JP, Rijken PF, et al. Comparison of different methods of CAIX quantification in relation to hypoxia in three human head and neck tumor lines. Radiother Oncol 2005;76: 194–9.
- Hoeben BA, Kaanders JH, Franssen GM, Troost EG, Rijken PF, Oosterwijk E, et al. PET of hypoxia with 89Zr-labeled cG250-F(ab’)2 in head and neck tumors. J Nucl Med 2010;51:1076–83.
- Ljungkvist AS, Bussink J, Kaanders JH, Rijken PF, Begg AC, Raleigh JA, et al. Hypoxic cell turnover in different solid tumor lines. Int J Radiat Oncol Biol Phys 2005;62: 1157–68.
- Monnich D, Troost EG, Kaanders JH, Oyen WJ, Alber M, Thorwarth D. Modelling and simulation of [18F]fluoromisonidazole dynamics based on histology-derived microvessel maps. Phys Med Biol 2011;56:2045–57.
- Nehmeh SA, Lee NY, Schroder H, Squire O, Zanzonico PB, Erdi YE, et al. Reproducibility of intratumor distribution of (18)F-fluoromisonidazole in head and neck cancer. Int J Radiat Oncol Biol Phys 2008;70:235–42.
- Okamoto S, Shiga T, Yasuda K, Ito YM, Magota K, Kasai K, et al. High reproducibility of tumor hypoxia evaluated by 18F-fluoromisonidazole PET for head and neck cancer. J Nucl Med 2013;54:201–7.
- Chao KS, Bosch WR, Mutic S, Lewis JS, Dehdashti F, Mintun MA, et al. A novel approach to overcome hypoxic tumor resistance: Cu-ATSM-guided intensity-modulated radiation therapy. Int J Radiat Oncol Biol Phys 2001; 49:1171–82.
- Dalah E, Bradley D, Nisbet A. Simulation of tissue activity curves of (64)Cu-ATSM for sub-target volume delineation in radiotherapy. Phys Med Biol 2010;55:681–94.
- Alber M, Paulsen F, Eschmann SM, Machulla HJ. On biologically conformal boost dose optimization. Phys Med Biol 2003;48:N31–5.
- Rajendran JG, Hendrickson KR, Spence AM, Muzi M, Krohn KA, Mankoff DA. Hypoxia imaging-directed radiation treatment planning. Eur J Nucl Med Mol Imaging 2006;33(Suppl 13):44–53.
- Grosu AL, Souvatzoglou M, Roper B, Dobritz M, Wiedenmann N, Jacob V, et al. Hypoxia imaging with FAZA-PET and theoretical considerations with regard to dose painting for individualization of radiotherapy in patients with head and neck cancer. Int J Radiat Oncol Biol Phys 2007;69:541–51.
- Lee NY, Mechalakos JG, Nehmeh S, Lin Z, Squire OD, Cai S, et al. Fluorine-18-labeled fluoromisonidazole positron emission and computed tomography-guided intensity-modulated radiotherapy for head and neck cancer: A feasibility study. Int J Radiat Oncol Biol Phys 2008;70: 2–13.
- Choi W, Lee SW, Park SH, Ryu JS, Oh SJ, Im KC, et al. Planning study for available dose of hypoxic tumor volume using fluorine-18-labeled fluoromisonidazole positron emission tomography for treatment of the head and neck cancer. Radiother Oncol 2010;97:176–82.
- Hendrickson K, Phillips M, Smith W, Peterson L, Krohn K, Rajendran J. Hypoxia imaging with [F-18] FMISO-PET in head and neck cancer: Potential for guiding intensity modulated radiation therapy in overcoming hypoxia-induced treatment resistance. Radiother Oncol 2011;101: 369–75.
- Chang JH, Wada M, Anderson NJ, Lim Joon D, Lee ST, Gong SJ, et al. Hypoxia-targeted radiotherapy dose painting for head and neck cancer using (18)F-FMISO PET: A biological modeling study. Acta Oncol Epub 2013 Jan 15.
- Lin Z, Mechalakos J, Nehmeh S, Schoder H, Lee N, Humm J, et al. The influence of changes in tumor hypoxia on dose-painting treatment plans based on 18F-FMISO positron emission tomography. Int J Radiat Oncol Biol Phys 2008;70:1219–28.
- Thorwarth D, Eschmann SM, Paulsen F, Alber M. Hypoxia dose painting by numbers: A planning study. Int J Radiat Oncol Biol Phys 2007;68:291–300.
- Toma-Dasu I, Uhrdin J, Antonovic L, Dasu A, Nuyts S, Dirix P, et al. Dose prescription and treatment planning based on FMISO-PET hypoxia. Acta Oncol 2012;51: 222–30.
- Korreman SS, Ulrich S, Bowen S, Deveau M, Bentzen SM, Jeraj R. Feasibility of dose painting using volumetric modulated arc optimization and delivery. Acta Oncol 2010; 49:964–71.
- Thorwarth D, Eschmann SM, Paulsen F, Alber M. A model of reoxygenation dynamics of head-and-neck tumors based on serial 18F-fluoromisonidazole positron emission tomography investigations. Int J Radiat Oncol Biol Phys 2007;68:515–21.
- Eschmann SM, Paulsen F, Reimold M, Dittmann H, Welz S, Reischl G, et al. Prognostic impact of hypoxia imaging with 18F-misonidazole PET in non-small cell lung cancer and head and neck cancer before radiotherapy. J Nucl Med 2005;46:253–60.
- Rajendran JG, Schwartz DL, O’Sullivan J, Peterson LM, Ng P, Scharnhorst J, et al. Tumor hypoxia imaging with [F-18] fluoromisonidazole positron emission tomography in head and neck cancer. Clin Cancer Res 2006;12: 5435–41.
- Rischin D, Hicks RJ, Fisher R, Binns D, Corry J, Porceddu S, et al. Prognostic significance of [18F]-misonidazole positron emission tomography-detected tumor hypoxia in patients with advanced head and neck cancer randomly assigned to chemoradiation with or without tirapazamine: A substudy of Trans-Tasman Radiation Oncology Group Study 98.02. J Clin Oncol 2006;24:2098–104.
- Kikuchi M, Yamane T, Shinohara S, Fujiwara K, Hori SY, Tona Y, et al. 18F-fluoromisonidazole positron emission tomography before treatment is a predictor of radiotherapy outcome and survival prognosis in patients with head and neck squamous cell carcinoma. Ann Nucl Med 2011; 25:625–33.
- Lee N, Nehmeh S, Schoder H, Fury M, Chan K, Ling CC, et al. Prospective trial incorporating pre-/mid-treatment [(18)F]-misonidazole positron emission tomography for head-and-neck cancer patients undergoing concurrent chemoradiotherapy. Int J Radiat Oncol Biol Phys 2009;75: 101–8.
- Zips D, Zophel K, Abolmaali N, Perrin R, Abramyuk A, Haase R, et al. Exploratory prospective trial of hypoxia-specific PET imaging during radiochemotherapy in patients with locally advanced head-and-neck cancer. Radiother Oncol 2012;105:21–8.
- Rischin D, Peters LJ, O’Sullivan B, Giralt J, Fisher R, Yuen K, et al. Tirapazamine, cisplatin, and radiation versus cisplatin and radiation for advanced squamous cell carcinoma of the head and neck (TROG 02.02, HeadSTART): A phase III trial of the Trans-Tasman Radiation Oncology Group. J Clin Oncol 2010;28:2989–95.
- Kim JJ, Tannock IF. Repopulation of cancer cells during therapy: An important cause of treatment failure. Nat Rev Cancer 2005;5:516–25.
- Fu KK, Pajak TF, Trotti A, Jones CU, Spencer SA, Phillips TL, et al. A Radiation Therapy Oncology Group (RTOG) phase III randomized study to compare hyperfractionation and two variants of accelerated fractionation to standard fractionation radiotherapy for head and neck squamous cell carcinomas: First report of RTOG 9003. Int J Radiat Oncol Biol Phys 2000;48: 7–16.
- Overgaard J, Hansen HS, Specht L, Overgaard M, Grau C, Andersen E, et al. Five compared with six fractions per week of conventional radiotherapy of squamous-cell carcinoma of head and neck: DAHANCA 6 and 7 randomised controlled trial. Lancet 2003;362:933–40.
- Bonner JA, Harari PM, Giralt J, Azarnia N, Shin DM, Cohen RB, et al. Radiotherapy plus cetuximab for squamous-cell carcinoma of the head and neck. NEJM 2006;354:567–78.
- Rütten H, Pop LA, Janssens GO, Takes RP, Knuijt S, Rooijakkers AF, et al. Long-term outcome and morbidity after treatment with accelerated radiotherapy and weekly cisplatin for locally advanced head-and-neck cancer: Results of a multidisciplinary late morbidity clinic. Int J Radiat Oncol Biol Phys 2011;81:923–9.
- Shields AF, Grierson JR, Dohmen BM, Machulla HJ, Stayanoff JC, Lawhorn-Crews JM, et al. Imaging proliferation in vivo with [F-18]FLT and positron emission tomography. Nat Med 1998;4:1334–6.
- Rasey JS, Grierson JR, Wiens LW, Kolb PD, Schwartz JL. Validation of FLT uptake as a measure of thymidine kinase-1 activity in A549 carcinoma cells. J Nucl Med 2002;43:1210–7.
- Kenny LM, Vigushin DM, Al-Nahhas A, Osman S, Luthra SK, Shousha S, et al. Quantification of cellular proliferation in tumor and normal tissues of patients with breast cancer by [18F]fluorothymidine-positron emission tomography imaging: Evaluation of analytical methods. Cancer Res 2005;65:10104–12.
- Yap CS, Czernin J, Fishbein MC, Cameron RB, Schiepers C, Phelps ME, et al. Evaluation of thoracic tumors with 18F-fluorothymidine and 18F-fluorodeoxyglucose-positron emission tomography. Chest 2006;129:393–401.
- Cobben DC, Elsinga PH, Suurmeijer AJ, Vaalburg W, Maas B, Jager PL, et al. Detection and grading of soft tissue sarcomas of the extremities with (18)F-3’-fluoro-3’-deoxy-L-thymidine. Clin Cancer Res 2004;10:1685–90.
- Troost EG, Bussink J, Slootweg PJ, Peeters WJ, Merkx MA, van der Kogel AJ, et al. Histopathologic validation of 3’-deoxy-3’-18F-fluorothymidine PET in squamous cell carcinoma of the oral cavity. J Nucl Med 2010;51:713–9.
- Troost EG, Vogel WV, Merkx MA, Slootweg PJ, Marres HA, Peeters WJ, et al. 18F-FLT PET does not discriminate between reactive and metastatic lymph nodes in primary head and neck cancer patients. J Nucl Med 2007;48: 726–35.
- de Langen AJ, Klabbers B, Lubberink M, Boellaard R, Spreeuwenberg MD, Slotman BJ, et al. Reproducibility of quantitative 18F-3’-deoxy-3’-fluorothymidine measurements using positron emission tomography. Eur J Nucl Med Mol Imaging 2009;36:389–95.
- Molthoff CF, Klabbers BM, Berkhof J, Felten JT, van Gelder M, Windhorst AD, et al. Monitoring response to radiotherapy in human squamous cell cancer bearing nude mice: Comparison of 2’-deoxy-2’-[18F]fluoro-D-glucose (FDG) and 3’-[18F]fluoro-3’-deoxythymidine (FLT). Mol Imaging Biol 2007;9:340–7.
- Troost EG, Bussink J, Hoffmann AL, Boerman OC, Oyen WJ, Kaanders JH. 18F-FLT PET/CT for early response monitoring and dose escalation in oropharyngeal tumors. J Nucl Med 2010;51:866–74.
- Menda Y, Boles Ponto LL, Dornfeld KJ, Tewson TJ, Watkins GL, Schultz MK, et al. Kinetic analysis of 3’-deoxy-3’-(18)F-fluorothymidine ((18)F-FLT) in head and neck cancer patients before and early after initiation of chemoradiation therapy. J Nucl Med 2009;50:1028–35.
- Barney BM, Lowe V, Okuno SH, Kep BJ, Jacobson MS, Price KA, et al. A pilot study comparing FLT-PET and FDG-PET in the evaluation of response to cetuximab and radiation therapy in advanced head and neck malignancies. Nucl Med Radiat Ther 2012;3:1.
- Hoeben BA, Troost EG, Span PN, Herpen CM, Bussink J, Oyen W, et al. 18F-FLT PET during radiotherapy or chemoradiotherapy in head and neck squamous cell carcinoma is an early predictor of outcome. J Nucl Med 2013;54:532–40.
- Kishino T, Hoshikawa H, Nishiyama Y, Yamamoto Y, Mori N. Usefulness of 3’-deoxy-3’-18F-fluorothymidine PET for predicting early response to chemoradiotherapy in head and neck cancer. J Nucl Med 2012;53:1521–7.
- Hoshikawa H, Mori T, Kishino T, Yamamoto Y, Inamoto R, Akiyama K, et al. Changes in (18)F-fluorothymidine and (18)F-fluorodeoxyglucose positron emission tomography imaging in patients with head and neck cancer treated with chemoradiotherapy. Ann Nucl Med 2013;27:363–70.
- McKinley ET, Ayers GD, Smith RA, Saleh SA, Zhao P, Washington MK, et al. Limits of [(18)F]-FLT PET as a biomarker of proliferation in oncology. PloS One 2013; 8:e58938.
- Dirix P, Vandecaveye V, De Keyzer F, Stroobants S, Hermans R, Nuyts S. Dose painting in radiotherapy for head and neck squamous cell carcinoma: Value of repeated functional imaging with (18)F-FDG PET, (18)F-fluoromisonidazole PET, diffusion-weighted MRI, and dynamic contrast-enhanced MRI. J Nucl Med 2009;50:1020–7.
- Thorwarth D, Beyer T, Boellaard R, de Ruysscher D, Grgic A, Lee JA, et al. Integration of FDG-PET/CT into external beam radiation therapy planning: Technical aspects and recommendations on methodological approaches. Nuklearmedizin 2012;51:140–53.
- McCall KC, Barbee DL, Kissick MW, Jeraj R. PET imaging for the quantification of biologically heterogeneous tumours: Measuring the effect of relative position on image-based quantification of dose-painting targets. Phys Med Biol 2010;55:2789–806.
- Busk M, Horsman MR, Overgaard J. Resolution in PET hypoxia imaging: Voxel size matters. Acta Oncol 2008; 47:1201–10.