
Abstract
Objective. To develop a methodology for using FDG PET/CT in adaptive dose painting by numbers (DPBN) in head and neck squamous cell carcinoma (HNSCC) patients. Issues related to noise in PET and treatment robustness against geometric errors are addressed.
Methods. Five patients with locally advanced HNSCC scheduled for chemo-radiotherapy were imaged with FDG-PET/CT at baseline and 2–3 times during radiotherapy (RT). The GTVPET was segmented with a gradient-based method. A double median filter reduces the impact of noise in the PET uptake-to-dose conversion. Filtered FDG uptake values were linearly converted into a voxel-by-voxel prescription from 70 (median uptake) to 86 Gy (highest uptake). A PTVPET was obtained by applying a dilation of 2.5 mm to the entire prescription. Seven iso-uptake thresholds led to seven sub-levels compatible with the Tomotherapy HiArt® Treatment Planning System. Planning aimed to deliver a median dose of 56 Gy and 70 Gy in 35 fractions on the elective and therapeutic PTVs, respectively. Plan quality was assessed with quality volume histogram (QVH). At each time point, plans were generated with a total of 3–4 plans for each patient. Deformable image registration was used for automatic contour propagation and dose summation of the 3 or 4 treatment plans (MIMvista®).
Results. GTVPET segmentations were performed successfully until week 2 of RT but failed in two patients at week 3. QVH analysis showed high conformity for all plans (mean VQ = 0.95 93%; mean VQ = 1.05 3.9%; mean QF 2.2%). Good OAR sparing was achieved while keeping high plan quality.
Conclusion. Our results show that adaptive FDG-PET-based escalated dose painting in patients with locally advanced HNSCC is feasible while respecting strict dose constraints to organs at risk. Clinical studies must be conducted to evaluate toxicities and tumor response of such a strategy.
Dose painting (DP) guided by molecular imaging aims at delivering a heterogeneous dose to tumors in order to boost areas of the gross tumor volume (GTV) suspected to be more radioresistant from functional imaging information [Citation1]. In head and neck squamous cell carcinoma (HNSCC), 20–30% of patients with locally advanced disease will present a local recurrence after treatment. These failures originate preferentially from the GTV, where a high dose has been delivered, thus calling for strategies that intensify dose to the GTV [Citation2]. 18F-fluorodeoxyglucose, a surrogate of tumor metabolism, has been proposed as a rationale option for DP [Citation3]. 18F-FDG-PET can identify relapse-prone regions and recently, a pattern of failure analysis showed a correlation between the intensity of the 18F-FDG uptake and the risk of local recurrence [Citation4].
Two distinct DP methodologies have been proposed. DP by contours (DPBC) boosts one or several tumor sub-volumes that are prescribed a uniform dose. In DP by numbers (DBPN) dose prescription varies locally as a function of the voxel intensity of some functional imaging [Citation5,Citation6]. DPBN can be done either by prescribing directly at the voxel level in the treatment planning system (TPS) or by discretizing the dose painted volume into several sub-contours representative of the underlying voxel dose distribution, e.g. contour-driven DPBN. These sub-contours are used only to approach the heterogeneous voxel-based prescription in the case of DPBN and should not be confused with DBPC where the dose remains homogeneous.
Several planning studies have investigated the feasibility of DPBN but actual relevance of the concept depends on clinical trials. Up to now, most planning studies and the only phase I trial ever conducted in DPBN involved treatment planning tools developed in house [Citation7–11]. This is, however, a limitation when considering the implementation of a large multi-centric phase III trial. Furthermore, although the principle of DP seems intuitive, its clinical implementation does not benefit from the same simplicity and some methodological questions are still left unanswered in the literature. Namely, PET guidance for dose painting implies that several caveats (e.g. noise, resolution, uncertainties) need to be addressed. In this context, this paper describes a planning study on the use of 18F-FDG PET/CT in adaptive DPBN in HNSCC patients using the Helical TomoTherapy (HT) systems (Accuray®). The methodology presented in our study takes into account issues related to noise in PET and treatment robustness against geometric errors.
Material and methods
Patient selection
Five patients (mean age 65.6 years; range 61–76 years) with a stage III–IV (1997 AJCC Classification) oropharyngeal SCC (minimal tumor diameter of 3 cm) were included in this planning study between December 2009 and March 2011 (see Supplementary Tables I–IV, available online at http://www.informahealthcare.com/doi/abs/10.3109/0284186X.2015.1046997). All patients but one (Patient 3) were treated by concomitant chemo-radiation with a prophylactic dose of 50 Gy in 5 weeks and a therapeutic dose of 70 Gy in 7 weeks; chemotherapy with carboplatin/5-fluorouracil on weeks 1, 4 and 7 [Citation12]. For Patient 3 the use of cetuximab was preferred.
Image acquisition
Patients underwent a contrast-enhanced computed tomography (CT) and 18F-FDG-PET on a combined PET/CT camera (Gemini TF, Philips Medical System, Cleveland, OH, USA). The image acquisitions were performed prior to radiotherapy (RT) (12–14 days; PET/CTW0) and during RT at the end of Weeks 1 (PET/CTW1), 2 (PET/CTW2) and 3 (PET/CTW3). Mean doses at the time of image acquisitions were 0 Gy (pre-treatment), 10.5 Gy (range, 10–12 Gy), 23.5 Gy (range, 22–24 Gy) and 34.4 Gy (range, 34–36 Gy). For all acquisitions, patients were immobilized on a flat table-top with the head-neck-shoulder immobilization system used for treatment. Patients 1, 2 and 3 underwent the full procedure, Patients 4 and 5 were re-imaged only twice.
Contrast-enhanced CT scans were performed using a slice thickness of 2 mm, a reconstruction interval of 2 mm and a pitch of 0.8. The tube voltage was set at 120 kV. Axial images were reconstructed using a matrix of 512 × 512 pixels with a size of 0.52 × 0.52 × 1 mm3. The longitudinal field of view (FOV) typically included the sterno-clavicular junction up to the frontal sinuses.
The three-dimensional (3D) PET images were acquired with an axial FOV of 155 mm (two bed positions centered on the primary tumor), a matrix of 288 × 288 pixels with a size of 2 × 2× 2 mm3. Acquisitions were performed 90 min after the injection of 268–304 MBq of 18F-FDG. The PET data were reconstructed with the 3D line of response-TOF blob-based OSEM algorithm from Philips with three iterations and 33 subsets [Citation13]. The resolution of the PET images measured in the center of the FOV with a point source in attenuating material led to a full width at half maximum (FWHM) of 6.5 mm.
Image processing
Delineation of primary tumor volume
A gradient-based method previously developed and validated in our unit was used to delineate automatically the external contours of the 18F-FDG-PET GTV (GTVPET) with automatic correction for air cavities [Citation14].
Conversion of the signal into dose prescription after noise reduction
The quantitative conversion of the PET signal into a heterogeneous prescription was performed using a linear uptake-to-dose conversion between the median and the maximal 18F-FDG uptake value inside the GTVPET as illustrated in . The linear relationship has previously been proposed for 18F-FDG-PET DP [Citation7,Citation8,Citation11,Citation15]. However, while the lower bound of the boost is usually set to the minimal uptake value, we proposed to start from the median uptake inside the GTVPET, which is less influenced by the low uptake background than the former. On the other hand, the maximum uptake is very difficult to estimate, for a large variety of reasons, such as the noise variance grows with the uptake, the estimator relies on one or very few voxels, and the resolution and/or image reconstruction/smoothing might introduce a bias. Furthermore, to minimize the effect of PET signal noise, a double median filtering step was applied to the raw PET image before conversion into prescription. The noise reduction through this step leads to a maximal uptake value that will be statistically more reliable [Citation16].
Figure 1. Illustration of the conversion function between the PET uptake and the dose prescription. The histogram of the uptake from Patient 1 is shown on the lower panel. The conversion takes into account bounds along both axes. The uptake bounds are given by statistics observed in the tumor volume. In the proposed solution, the minimum is overlooked, as it is likely to be contaminated by the colder background (spill in/spill out effect). Instead, the baseline uptake in the tumor is approximated by the median uptake, which is less sensitive to hot spots than the mean. The dose is interpolated linearly up to the maximum uptake in absence of further information.
Ensuring robustness against geometric uncertainties in the dose painting target
The voxel-by-voxel non-uniform dose prescription in DPBN makes usual margin recipes inadequate to account for geometric uncertainties [Citation17]. Robust treatment plans for DPBN can be achieved by incorporating geometric uncertainties in the plan optimization process [Citation18], but these are seldom available in most commercial TPS. As a workaround, robustness against geometrical uncertainties was ensured by the methodology previously developed in our unit [Citation19]. Geometric uncertainties are dealt with directly in the prescription instead of taking them into account in dose optimization [Citation18]. In this way, the robust prescription is obtained by modifying the original heterogeneous dose prescription with a geometric dilation of αΣ where Σ represents the standard deviation (SD) of all systematic errors (to account for systematic errors [Citation17]) and by a deconvolution with a Gaussian function of σ, where σ represents the SD of random errors (to account for blurring due to random errors [Citation17]). Factor α scales standard deviation Σ to span a confidence interval in the patient population, which guarantees target coverage for systematic errors of amplitude αΣ. For a confidence interval of 90% of patient population, alpha equals 2.5 [Citation17,Citation19]. However, random errors can be neglected, as demonstrated by Sterpin et al., as long as they are small (1 mm or less) [Citation19]. Using daily MVCT setup, random errors are typically small in HNSCC and were thus neglected [Citation20]. Hence, the volume candidate to DPBN (PTVPET) was obtained by applying a simple dilation of 2.5 mm to the GTVPET.
Delineation of sub-contours inside of the primary tumor
In order to allow the optimizer to approximate the voxel-by-voxel prescription, a number N of nearly equidistant sub-contours were defined inside the PTVPET using in-house software. The PTVPET was thus divided in N isolevel curves, like onion peels, starting from the median uptake value. The threshold of each level, i.e. the percentage of the maximal uptake inside the PTVPET, was converted into a dose prescription, as a percentage of the maximal dose increment, i.e. 16 Gy. This value was used as the minimum dose constraint in HT TPS. The maximum dose constraint for the ith sub- volume equaled the minimum dose constraint for contour i + 1.
Further delineation of target volumes and organs at risk
The clinical target volumes (CTVs) and organs at risk (OARs) were delineated on the pretreatment CT (CTW0). The CTV70Gy (so-called CTVtherapeutic) was defined as the GTV + 5 mm for both the primary tumor and lymph node metastases, taking into account that bone, cartilages, ligaments and muscles can prevent tumor spread. The remaining CTV for both the primary tumor (tissue nearby at risk of direct spread) and the bilateral elective lymph node areas (delineated according to Grégoire et al. [Citation21,Citation22]) were united in the CTV56Gy (so-called the CTVprophylactic). Finally, PTVs were generated by expanding the CTVs with an isotropic 4 mm margin [Citation23]. OARs included the spinal cord, brainstem, parotid glands, oral cavity, larynx, and mandible. For the spinal cord and brainstem, a planning organ at risk volume (PRV) was generated using a 4 mm margin to account for geometric uncertainty as recommended by the ICRU Report 83 [Citation24].
Treatment planning
The planning CTs including the various TVs and OARs were transferred using a DICOM RT format to a research HT TPS (Accuray®) with a fast dose engine running on a GPU architecture, previously validated elsewhere [Citation25]. The range of TPS parameterizations were the following: slice width of 1–5 cm; modulation factor of 1.5–3.0; and pitch of 0.29–0.86. The dose calculation grid was set in fine mode (pixels of about 2 × 2× 2 mm3).
Patients’ treatments were planned using a simultaneous integrated boost (SIB) IMRT approach. A median dose of 56 Gy (35 × 1.6 Gy) was prescribed to the prophylactic nodal and primary tumor PTVs. A median dose of 70 Gy (35 × 2 Gy) was prescribed to the therapeutic nodal and primary tumor PTVs. The PTVPET was prescribed a non-uniform boost dose from 70 to 86 Gy, as described above. The following dose-volume constraints were used: for all PTVs, D98% ≥ 90% of the prescribed dose (Dprescribed), D95% ≥ 95% of Dprescribed ; for PTVPET, V107% < 2%; for PRV spinal cord, D2% < 30 Gy; for PRV brainstem, D2% < 25 Gy, for the contralateral parotid, Dmean ≤ 26 Gy; for the ipsilateral parotid, Dmean ≤ 30 Gy; for the oral cavity, Dmean ≤ 30 Gy, for the larynx, Dmean ≤ 40 Gy, for the mandible, D5% < 70Gy.
To evaluate the quality of the dose distribution inside the PTVPET, quality volume histograms (QVH) and quality factors (QF) as proposed by Vanderstraeten et al. were used [Citation11]. Planning objectives were derived from QVH curves with a (VQ = 0.95) ≥ 95% and (VQ = 1.05) ≤ 5%. QF should not exceed 0.05 or 5% [Citation7,Citation8,Citation11].
Treatment adaptation and dose summation
Volumes of interest (VOIs) manually drawn on CTW0 were propagated by deformable image registration to CTW1. If necessary, they were manually adapted by a radiation oncologist, i.e. to remove air cavities or bony structures. CTVs were in this way adapted to anatomical changes. This sequence was again performed for CTW2 and CTW3.
In addition to the propagation of the VOIs from previous images, i.e. anatomical adaptation, a new GTVPET volume was obtained from the gradient-based segmentation of each respective per-treatment PET image. If necessary, parts of the new GTVPET extending outside the pre-treatment GTVPET were manually corrected as they were assumed to be the consequence of treatment-induced inflammation. These GTVPET led subsequently to new DP sub-contours. Through this step, changes in the metabolic signal were taken into account ensuring adaptation based on molecular imaging. For each per-treatment image, a new plan was then calculated.
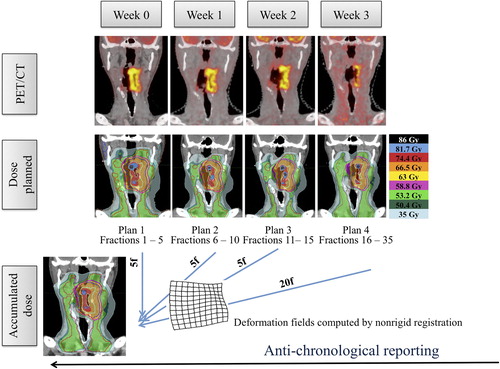
Finally, the total dose for a seven-week treatment was calculated. Per-treatment CTs (CTW1, CTW2 and CTW3) were therefore non-rigidly registered to CTW0, generating deformation maps. These deformation maps were used to deform the corresponding per-treatment dose maps on CTW0. The cumulative dose distribution was calculated taking into account the relative contribution in radiation dose of each CT image sets. The whole process is summarized in . Deformable image registration and dose accumulation were performed with the commercial software MIM 6.1. (MIMVista Corp., Cleveland, OH, USA).
Figure 2. Design of the dose adaptation procedure. Separate image sets (pre-treatment and after 5, 10 and 15 fractions of RT) were acquired for each planning phase. Using deformable image co-registration, volumes-of-interest (CTVs and OARs) were deformed from one CT to the next and manually adjusted when needed. A PTVPET and sub-contours for DP were created from each new PET image and incorporated to the deformed CTVs and OARs. For each phase, a new treatment plan was made. Dose summation was performed anti-chronologically on the pretreatment PET-CT.
Molecular and anatomic adaptation versus anatomic adaptation only
At last, in order to simulate a treatment that is adaptive with respect to anatomical evolutions seen at CT but blind to changes in the PET signal, the pre-treatment dose map was deformed on the per-treatment CT scans using deformable image registration. Assuming that the deformable registration is error-free, it amounts to perfect anatomical adaptation of the treatment plan. In this way, the plan calculated with PET-CTW0 was reported on the per-treatment CTs (CTW1, CTW2 and CTW3), simulating what would have been delivered without taking into account the changes in the PET signal. The effect of dose adaptation on the molecular conformity of dose painting was then evaluated by comparing QVH metrics of both dose maps on each per-treatment CT.
Results
Sensitivity study defining optimal planning parameters
In order to find the optimal parameters for the TPS to reproduce the DPBN prescription, several planning features were studied separately with all five patients on pretreatment images. To leave the largest freedom for the coverage of the painted target, OARs considered for this study were limited to the parotid glands, spinal cord, and brainstem.
Effect of the number of sub-contours
summarizes the results obtained by varying the number of sub-contours only. First, the treatment planning parameters were set to 1 cm slice width, 3.0 modulation factor and pitch of 0.43. Plan conformity steadily improves from 3 to 7 sub-contours. For 9 sub-contours compared to 7, the conformity only improved for three of five patients (Patients 1, 3 and 4). Using seven sub-contours, the acceptability criteria for the QVH, i.e. VQ = 0.95 ≥ 95% and VQ = 1.05 ≤ 5%, were met for all patients except Patient 5.
Table I. QVH metrics (VQ = 0.95, VQ = 1.05, QF, %) calculated for the dose-painted PTVPET on pre-treatment images with a number of sub-contours increasing from 3 to 9 (jaw width 1 cm, pitch 0.43, planned MF of 3 corresponding to a mean actual MF of 2.49 ± 0.27).
Effect of delivery parameters (jaw width, pitch, modulation factor)
Delivery parameters such as pitch, jaw width, and modulation factor were thereafter varied using seven sub-levels on two randomly selected patients (see Supplementary Tables I–IV, available online at http://www.informahealthcare.com/doi/abs/10.3109/0284186X.2015.1046997). Increasing the jaw width from 1 to 2.5 cm leads to an increase of the QF from 1.8% to 2.4% and from 1.8% to 2.2% for Patients 1 and 2, respectively. When using the 5 cm jaw width, QF increases further to 2.6% and 2.4%, respectively. Variation of the pitch from 0.287 to 0.86 did not significantly change QVH quality. In all pitch configurations, the QF does not exceed 2%. Plan conformity benefits from a high modulation factor. Most dramatic conformity degradations occur when decreasing the planned MF to 1.5 (corresponding to an actual MF of 1.15 and 1.24 for Patients 1 and 2, respectively), with a QF outgrowing up to 3.2% and 2.7%, respectively.
Results of the adaptive strategy
The optimal planning parameters defined above (i.e. seven sub-levels, 1 cm jaw width, pitch of 0.43, modulation factor of 3) were then used to test the feasibility on per-treatment images.
Segmentation of the GTVPET on per-treatment images
The segmentation of per-treatment images shows a decrease in tumor volume from the first week on (see ). However, the automatic segmentation shows its limitation for Patients 2 and 3 where the GTVPET can no longer be delineated for images acquired after the 15th fraction. For those patients, dose accumulation was performed with only three plans. Therefore, the contribution in dose of each CT image set was adjusted accordingly in the dose accumulation process, i.e. the plan calculated on CTW2 was accounting for 25 fractions. Respective contributions were similarly adjusted for Patients 4 and 5, who had been reimaged only twice during treatment.
Table II. Volume of the gross tumor volume (GTVPET) on consecutive PET/CT scans.
Dosimetric results on pre-treatment images and dose accumulation
Planning dose objectives stated in the Material and methods section were reached for all plans except for the oral cavity and the larynx. When this was the case, the mean dose was reported on the part of the oral cavity or the larynx outside of the PTV and the high gradient region, i.e. 5 mm distant from the PTVs. shows clinically relevant dose-volume characteristics for the target volumes and OARs for both the pre-treatment dose and the accumulated one. (left column) reports the QVH values for each separate plan.
Table III. Dose/volume parameters for targets and organs-at-risk for pre-treatment CT and dose accumulation. Population-average doses (mean± SD) are reported in volumes-of-interest on pre-treatment CT.
Table IV. QVH metrics (VQ = 0.95, VQ = 1.05, QF, %) calculated for the dose-painted PTVPET on per-treatment PET-CT scans with anatomic adaptation versus molecular and anatomic adaptation.
Comparison between molecular and anatomic adaptation versus anatomic only
A combined anatomic and molecular adaptive strategy improved VQ = 0.95 in all cases (range + 1.5%–+ 29.6%) but one (i.e. Patient 3), with a decrease of 16.9% (see ). VQ = 1.05 were systematically reduced (range 3.6–27.1%). QFs were improved in all cases (range 0.8–3.7%) with a median value of 2.1% and 4.7% for the combined anatomic and molecular adaptation and the anatomic adaptation only, respectively.
Discussion
A methodological approach that addresses the limitations of PET-guided DP is presented. If the concept of DP is quite intuitive and elegant, its implementation is far from being straightforward and requires much care to ensure its accuracy with respect to information conveyed by PET images.
First, using small-scale variations of the PET signal within the tumor to drive dose escalation raises several questions. The small scale variations are a natural consequence of the statistical reconstruction noise and therefore do not represent real differences in PET activity levels [Citation26]. The limiting resolution of PET dictates the attainable accuracy of DP. Previous work has shown that details seen in high-resolution auto-radiographic images are blurred to a much lower resolution in PET imaging [Citation27]. The conversion function between the PET uptake and the dose prescription, from the median to the maximum uptake value and preceded by a median filtering, is designed to cope with all observed imperfections of PET, i.e. statistical noise, uptake calibration errors, target-background cross-contamination near the tumor boundaries, etc. Furthermore, noise reduction through median filtering aims at reducing the risk of targeting a false heterogeneity. Stability of high 18F-FDG uptake regions during RT has been shown for NSCLC, but such analysis has not been performed up to now for HNSCC patients [Citation28].
Second, after uncertainties related to the molecular image itself, treatment-related uncertainties have to be considered, since positional errors severely degrade the QVH [Citation29]. However, margins around the hot spots of a tumor are almost never envisaged in the literature in the case of DPBN [Citation7–11]. More recently, the issue of uncertainties has been addressed theoretically [Citation18,Citation30]. As we believe that it is unlikely that hot spots would be positioned differently than the GTV or PTV, the effective delivery of the entire dose boost during the whole treatment cannot be ensured without considering geometrical uncertainties. The margin methodology we propose to apply for DPBN has a coverage objective, aiming at delivering at least 95% of the prescribed dose, knowing this will automatically generate some excess dose [Citation19].
Third, the magnitude of the dose escalation has not been chosen arbitrarily. Results of previous phase I studies have investigated normal tissue tolerance to dose escalation. The first clinical study on DPBN in head and neck cancer tested a dose escalation to a physical dose of 80.9 Gy to the high-dose CTV on seven patients and 85.9 Gy to the GTV delineated on 18F-FDG-PET on 14 patients. Dose-limiting toxicity was seen at dose level II with the development of late mucosal ulcers in five of 14 patients. The maximal tolerated dose was thus considered to be 80.9 Gy in 32 fractions [Citation8,Citation31]. One should be aware that 80.9 Gy in that study corresponded to the median prescribed dose, but the maximal dose prescription reached 90.92 Gy in 32 fractions. A dose escalation with a maximum of 86 Gy in 35 fractions appeared to be safe, based on previous results.
Once the methodology had been developed, we aimed to test the feasibility of DPBN with HT in clinically realistic cases, i.e. five oropharyngeal carcinoma patients. Up to now, indeed, a single study published by Deveau et al. demonstrated the ability of the TPS of HT to reproduce DPBN prescriptions [Citation32]. However, only one target volume, i.e. a pathological lymph node, was used for optimization. Therefore, we evaluated the ability of the TPS to match voxel-by-voxel prescriptions while keeping doses to normal tissue at the level of conventional IMRT. First, various planning and segmentation parameters were evaluated on pre-treatment acquisitions. The optimal settings were determined to be seven sub-contours in the GTVPET, jaw width of 1 cm, pitch of 0.43, and modulation factor of 3. In agreement with Deveau et al., the number of sub-contours was found to impact plan quality. Too few sub-contours cannot faithfully render the voxel-wise prescription, whereas too many worsened the QVH of two patients. This could result from inconsistent prescription assignments in the dose grid, due to tiny spacing between successive contours. In the end, if a number of seven sub-contours was best in this study, there is no rule to determine it, as it depends on the size and uptake distribution of each tumor. A jaw width of 1 cm has to be used to achieve good conformity, leading to treatments with a mean delivery time of 14 minutes for the pre-treatment plans.
Optimal planning parameters were then used to test the methodology in an adaptive frame. Dose adaptation allows morphological and molecular changes to be followed, with CT and 18F-FDG-PET, respectively. Several studies have shown early reduction in tumor volume after the onset of RT [Citation7,Citation8,Citation33]. Concerning the optimal time-point for re-imaging in the case of 18F-FDG-PET, it should occur in the first two weeks of treatment. After three weeks, the contrast between the tumor and surrounding tissues weakens. The tumor boundaries become indiscernible, even with the gradient-based segmentation method. This occurred in two of five patients and had already been described in previous works [Citation33].
Fine dose variations planned in DP will make sense in an adaptive frame only. Otherwise, the aforementioned uncertainties would necessarily increase and DP might become useless or even dangerous. Furthermore, temporal and spatial instability of the molecular parameters could compromise the efficacy of a DP strategy. This effect was illustrated by comparing QVHs in strategies with anatomic adaptation only or molecular and anatomic adaptation. Molecular and anatomic adaptation resulted in higher coverage and lower excess dose inside the PTVPET and QFs were systematically improved. These results show that without dose adaptation, molecular specificity of dose escalation cannot be maintained. Recently, a similar study has been published with a comparative dosimetry of adaptive (ART) and non-adaptive (RT) DPBN [Citation34]. Dose adaptation was performed after 8 and 18 fractions. Results show that compared to RT, ART increases minimum doses and decreases maximum doses in target volumes and improves dose/metrics of OARs. For the dose painted targets however, QF were not systematically improved but in 15/19 cases for the primary tumor and in 8/13 cases for the lymph nodes.
Deformable registration inherent to dose adaptation can be inaccurate, especially in low-contrast regions (soft tissue). Inaccuracy can affect the tumor volume as well as OARs, with direct repercussions on the cumulative dose. The latter will be the most affected in its extremes, i.e. the near-min and near-max doses. In other words, the cumulative dose undergoes a slight averaging that smoothes its distribution. Indeed, D2% and D95% for PTV70Gy and PTV56Gy appeared to be slightly lower on the cumulative dose than on the pretreatment dose. Dose differences were however minimal and allowed coverage to fulfil constraints except in one patient for the D98% and D95% value of the PTV56Gy. Readability of the cumulative dose inside the GTVPET remains difficult for the aforementioned reasons and the fact that the GTVPET shrank, according to the per-treatment PET images. As dose was accumulated anti-chronologically and thus reported in the larger pre-treatment VOIs, it logically follows that D2%, D50% and D98% of the GTVPET are consequently reduced. This explains also the degradation of the QVH values when computed between the cumulative dose and the voxel- by-voxel prescription derived from the pre-treatment PET image. VQ = 0.95 are significantly reduced. However, QFs remain under the limit of 5% illustrating the persistence of a correlation between the cumulative dose and the molecular signal at baseline.
Supplementary material available online
Supplementary Figure 1 and Table I–IV, available online at http://www.informahealthcare.com/doi/abs/10.3109/0284186X.2015.1046997.
ionc_a_1046997_sm9230.pdf
Download PDF (97.9 KB)Acknowledgments
S. Differding is supported by a Télévie Grant from the Belgian ‘Fonds National pour la Recherche Scientifique F.R.S.-FNRS’ (Grant number 7.4601.13F). John A. Lee is a Research Associate with the F.R.S.-FNRS. This work was supported by a grant from the Belgian Foundation against Cancer (SCIE2012-203).
Declaration of interest: The authors report no conflicts of interest. The authors alone are responsible for the content and writing of the paper.
References
- Ling CC, Humm J, Larson S, Amols H, Fuks Z, Leibel S, et al. Towards multidimensional radiotherapy (MD-CRT): Biological imaging and biological conformality. Int J Radiat Oncol Biol Phys 2000;47:551–60.
- Soto DE, Kessler ML, Piert M, Eisbruch A. Correlation between pretreatment FDG-PET biological target volume and anatomical location of failure after radiation therapy for head and neck cancers. Radiother Oncol 2008;89:13–8.
- Aerts HJ, Lambin P, Ruysscher DD. FDG for dose painting: A rational choice. Radiother Oncol 2010;97:163–4.
- Due AK, Vogelius IR, Aznar MC, Bentzen SM, Berthelsen AK, Korreman SS, et al. Recurrences after intensity modulated radiotherapy for head and neck squamous cell carcinoma more likely to originate from regions with high baseline [18F]-FDG uptake. Radiother Oncol 2014;111:360–5.
- Bentzen SM. Theragnostic imaging for radiation oncology: Dose-painting by numbers. Lancet Oncol 2005;6:112–7.
- Bentzen SM, Gregoire V. Molecular imaging-based dose painting: A novel paradigm for radiation therapy prescription. Semin Radiat Oncol 2011;21:101–10.
- Berwouts D, Olteanu LA, Duprez F, Vercauteren T, De Gersem W, De Neve W, et al. Three-phase adaptive dose-painting-by-numbers for head-and-neck cancer: Initial results of the phase I clinical trial. Radiother Oncol 2013;107:310–6.
- Duprez F, De Neve W, De Gersem W, Coghe M, Madani I. Adaptive dose painting by numbers for head-and-neck cancer. Int J Radiat Oncol Biol Phys 2011;80:1045–55.
- Lee NY, Mechalakos JG, Nehmeh S, Lin Z, Squire OD, Cai S, et al. Fluorine-18-labeled fluoromisonidazole positron emission and computed tomography-guided intensity- modulated radiotherapy for head and neck cancer: A feasibility study. Int J Radiat Oncol Biol Phys 2008;70:2–13.
- Thorwarth D, Eschmann SM, Paulsen F, Alber M. Hypoxia dose painting by numbers: A planning study. Int J Radiat Oncol Biol Phys 2007;68:291–300.
- Vanderstraeten B, Duthoy W, De Gersem W, De Neve W, Thierens H. [18F]fluoro-deoxy-glucose positron emission tomography ([18F]FDG-PET) voxel intensity-based intensity-modulated radiation therapy (IMRT) for head and neck cancer. Radiother Oncol 2006;79:249–58.
- Calais G, Alfonsi M, Bardet E, Sire C, Germain T, Bergerot P, et al. Randomized trial of radiation therapy versus concomitant chemotherapy and radiation therapy for advanced-stage oropharynx carcinoma. J Natl Cancer Inst 1999;91:2081–6.
- Surti S, Kuhn A, Werner ME, Perkins AE, Kolthammer J, Karp JS. Performance of Philips Gemini TF PET/CT scanner with special consideration for its time-of-flight imaging capabilities. J Nucl Med 2007;48:471–80.
- Geets X, Lee JA, Bol A, Lonneux M, Gregoire V. A gradient-based method for segmenting FDG-PET images: Methodology and validation. Eur J Nucl Med Mol Imaging 2007;34:1427–38.
- Alber M, Paulsen F, Eschmann SM, Machulla HJ. On biologically conformal boost dose optimization. Phys Med Biol 2003;48:N31–5.
- Arias-Castro E, Donoho DL. Does median filtering truly preserve edges better than linear filtering? Ann Stat 2009;37:1172–206.
- van Herk M, Remeijer P, Rasch C, Lebesque JV. The probability of correct target dosage: Dose-population histograms for deriving treatment margins in radiotherapy. Int J Radiat Oncol Biol Phys 2000;47:1121–35.
- Witte M, Shakirin G, Houweling A, Peulen H, van Herk M. Dealing with geometric uncertainties in dose painting by numbers: Introducing the DeltaVH. Radiother Oncol 2011;100:402–6.
- Sterpin E, Differding S, Janssens G, Geets X, Gregoire V, Lee JA. Generation of prescriptions robust against geometric uncertainties in dose painting by numbers. Acta Oncol 2014:1–8.
- Boswell S, Tome W, Jeraj R, Jaradat H, Mackie TR. Automatic registration of megavoltage to kilovoltage CT images in helical tomotherapy: An evaluation of the setup verification process for the special case of a rigid head phantom. Med Phys 2006;33:4395–404.
- Gregoire V, Ang K, Budach W, Grau C, Hamoir M, Langendijk JA, et al. Delineation of the neck node levels for head and neck tumors: a 2013 update. DAHANCA, EORTC, HKNPCSG, NCIC CTG, NCRI, RTOG, TROG consensus guidelines. Radiother Oncol 2014;110:172–81.
- Gregoire V, Daisne JF, Geets X, Levendag P. Selection and delineation of target volumes in head and neck tumors: Beyond ICRU definition. Rays 2003;28:217–24.
- Vaandering A, Lee JA, Renard L, Gregoire V. Evaluation of MVCT protocols for brain and head and neck tumor patients treated with helical tomotherapy. Radiother Oncol 2009;93:50–6.
- Prescribing, recording, and reporting photon-beam intensity- modulated radiation therapy (IMRT): Contents. J ICRU 2010;10:Np.
- Chen Q, Lu W, Chen Y, Chen M, Henderson D, Sterpin E. Validation of GPU based TomoTherapy dose calculation engine. Med Phys 2012;39:1877–86.
- Soret M, Bacharach SL, Buvat I. Partial-volume effect in PET tumor imaging. J Nucl Med 2007;48:932–45.
- Christian N, Lee JA, Bol A, De Bast M, Jordan B, Gregoire V. The limitation of PET imaging for biological adaptive-IMRT assessed in animal models. Radiother Oncol 2009;91:101–6.
- Aerts HJ, Bosmans G, van Baardwijk AA, Dekker AL, Oellers MC, Lambin P, et al. Stability of 18F-deoxyglucose uptake locations within tumor during radiotherapy for NSCLC: A prospective study. Int J Radiat Oncol Biol Phys 2008;71:1402–7.
- Korreman SS, Ulrich S, Bowen S, Deveau M, Bentzen SM, Jeraj R. Feasibility of dose painting using volumetric modulated arc optimization and delivery. Acta Oncol 2010;49:964–71.
- Alber M, Thorwarth D. Multi-modality functional image guided dose escalation in the presence of uncertainties. Radiother Oncol 2014;111:354–9.
- Madani I, Duprez F, Boterberg T, Van de Wiele C, Bonte K, Deron P, et al. Maximum tolerated dose in a phase I trial on adaptive dose painting by numbers for head and neck cancer. Radiother Oncol 2011;101:351–5.
- Deveau MA, Bowen SR, Westerly DC, Jeraj R. Feasibility and sensitivity study of helical tomotherapy for dose painting plans. Acta Oncol 2010;49:991–6.
- Geets X, Tomsej M, Lee JA, Duprez T, Coche E, Cosnard G, et al. Adaptive biological image-guided IMRT with anatomic and functional imaging in pharyngo-laryngeal tumors: Impact on target volume delineation and dose distribution using helical tomotherapy. Radiother Oncol 2007;85:105–15.
- Olteanu LA, Berwouts D, Madani I, De Gersem W, Vercauteren T, Duprez F, et al. Comparative dosimetry of three-phase adaptive and non-adaptive dose-painting IMRT for head-and-neck cancer. Radiother Oncol 2014; 111:348–53.