
Abstract
Purpose: To determine the protective effect of aliskiren on ischemia–reperfusion (I/R) injury in a rat renal (I/R) model. Methods: Rats were randomly divided into five groups: sham control group; sham control with aliskiren pretreatment; I/R group and I/R with two doses of aliskiren pretreatment. Rats were unilaterally nephrectomized and subjected to 45 min of renal pedicle occlusion followed by 24 h reperfusion. Aliskiren (50 and 100 mg/kg) was administered orally by gavage 24 and 1 h prior to ischemia. After 24 h reperfusion, kidney samples were taken for the determination of malondialdehyde (MDA) level, superoxide dismutase (SOD), glutathione (GSH) activity and histological evaluation. The level of serum creatinine (SCR) and blood urea nitrogen (BUN), renin and angiotensin II (AT-2) was measured in serum samples. Results: Kidneys from I/R groups showed significant increase in MDA level and significant decrease in GSH, and SOD activity. IL-1β, iNOS and NFkB gene expression significantly increased in the I/R groups in the rat kidney tissue. Aliskiren treatment showed a significant down-regulatory effect on IL-1β, iNOS and NFkB mRNA expression. Compared with the sham group, SCR and BUN, renin and AT-2 were significantly increased in the I/R rats, accompanied by histopathological damage to the kidney. Conclusion: Pretreatment with aliskiren ameliorated I/R-induced renal injury through decreasing nitric oxide and AT-2 levels and by the reduction of injury induced by I/R injury and ameliorated renal histopathological molecular and biochemical changes.
Introduction
Due to decreased arterial and venous blood flow, impaired tissue perfusion (or ischemia) results in cellular death. This is largely due to the depletion of energy stores and toxic metabolite accumulation. However, restoration of blood flow to the ischemic tissue may paradoxically exacerbate the injury. Although there are many mechanisms underlying ischemic–reperfusion injury, the primary mechanism is the reintroduction of molecular oxygen to a previously hypoxic tissue, resulting in quickly formed reactive oxygen species.Citation1
Nephron sparing surgery helps to maintain long-term renal function, and prevents chronic kidney disease in patients with small renal masses.Citation2 Extended warm ischemia time (WIT) greater than 30 min during open or laparoscopic partial nephrectomy can lead to considerable renal injury, and continues to be a limiting factor in performing larger, more complex partial nephrectomies. Renal damage is also proportional to increasing WIT due to a sudden lack of nutrients, severe hypoxia and/or anoxia of the renal parenchyma.Citation3,Citation4 Thus, the optimal function of the kidney postoperatively is determined by the integrity of the renal parenchyma preserved, and the extent and duration of ischemic injury.Citation5
ARI (acute renal injury) is believed to result from I/R (ischemia/reperfusion) injuries occurring during the course of hypovolemia, septic shock, renal transplantation or nephron sparing surgery. I/R leads to renal vascular dysfunction and the subsequent impairment of renal blood flow, further worsening the initial renal injury.Citation5,Citation6 The molecular mechanisms underlying I/R-induced ARI are not fully understood, but it has been reported that several causal factors, such as ATP depletion, production of reactive oxygen species (ROS), phospholipase activation, neutrophil filtration and release of vasoactive peptides, contribute to the pathogenesis of renal damage.Citation7 Among the diversity of mediators that take part in this process, the RAS (renin–angiotensin system) has progressively assumed an important role.
Many studies have shown that angiotensin II (AT-2) contributes to renal injury in ARI models.Citation8,Citation9 The RAS consists of several peptides which interact in a cascading fashion to produce AT-2. Renin is the enzyme responsible for catalyzing the metabolism of angiotensinogen to angiotensin I, which is subsequently converted by the action of angiotensin converting enzyme (ACE) to the active hormone angiotensin II. Therefore, the effect of RAS can be blocked by interrupting this cascade at different levels by agents such as ACE inhibitors and ARBs. The RAS blockade can also be achieved by renin inhibitors. Renin inhibition is expected, at least theoretically, to be more effective than the ACE inhibitors or the ARBs in blocking the function of RAS.
Aliskiren is the first oral direct renin inhibitor which has been approved for the treatment of hypertension by the US Food and Drug Administration. The protective effect of aliskiren on myocardial ischemia/reperfusion injury has been shown by previous studies.Citation10,Citation11 The effects of aliskiren on kidney function in different renal conditions, such as unilateral ureteral obstruction and chronic kidney disease, have also been studied.Citation12–14
We hypothesized that direct renin inhibition with aliskiren may protect against renal I/R injury through decreasing nitric oxide and AT-2 levels and by the reduction of injury induced by I/R injury in a rat model of renal ischemia–reperfusion.
Materials and methods
Animals
In this study, 40 adult male Wistar albino rats, weighing 220–260 g (5 months old), were obtained from the Ataturk University Experimental Animal Laboratory. The rats were divided into five groups as described in . The animals were housed at a constant temperature (22 ± 20 °C) and humidity, with a 12 h light and 12 h dark cycle. During the acclimatization period, the rats were fed a diet of standard commercial rat pellets. All animal procedures were approved by the Institutional Animal Care and Use committee.
Table 1. Experimental design.
Chemicals
All chemicals for the laboratory experiments were purchased from the Sigma Chemical Company (Germany). Thiopental sodium (Pentothal sodium) was purchased from Abbott in Istanbul, Turkey. The aliskiren (Rasilez, 300 mg tb) was obtained from the Novartis Drug Company.
Experimental design and surgical technique
The rats used in this study were randomly assigned to five experimental groups. Group 1 was the sham group (n = 8), where sham operations were performed and the animals underwent only laparotomies. The sham operated animals underwent exposure of the left renal pedicles, but did not receive any I/R. Group 2 was the sham + aliskiren 100 mg/kg group (n = 8), where the animals were administered aliskiren at 24 and 1 h before the operation, and underwent only laparotomies. Group 3 was the I/R group (n = 8), in which the animals were subjected to 45 min of left renal ischemia followed by 24 h of reperfusion. Group 4 was the I/R + aliskiren 50 mg/kg group (n = 8), and the animals were given aliskiren (50 mg/kg dose orally by gavage) 24 and 1 h prior to the ischemia, and then subjected to 45 min of left renal ischemia followed by 24 h of reperfusion. Group 5 was the I/R + aliskiren 100 mg/kg group (n = 8), where the animals were given aliskiren (100 mg/kg dose) orally by gavage 24 and 1 h prior to the ischemia, and then subjected to 45 min of left renal ischemia followed by 24 h of reperfusion.
All animals were anesthetized with an injection of thiopental sodium (25 mg/kg, i.p.), and a midline abdominal incision was performed after disinfection of the abdominal wall using povidone iodine. A right nephrectomy was performed and, in order to achieve kidney IRI in the animals, the renal artery and vein were simultaneously occluded in both kidneys by placing a clamp on the vessels for 45 min. Special care was paid to avoid damage to the organ itself. The efficacy of occlusion was confirmed by color changes in the entire kidney. After which, the clamp was removed and the rats were reperfused with care to ensure that the blood flowed into the kidneys, subjecting them to reperfusion for 24 h. To protect the rats from hypothermia, all of the animals were kept warm after surgery. At the end of 24 h of reperfusion, the animals were euthanized with a high dose of anesthesia, and blood samples were collected with the left kidneys being obtained from each rat. The serum was isolated and used for the assessment of renal function analysis. Some kidneys from each group were used as samples for histological studies, while the remaining kidneys were then stored at −80 °C for biochemical and molecular analysis.
Biochemical investigation of tissues
The tissue samples from each rat were first perfused with PBS/heparin and then ground in liquid nitrogen using the TissueLyser II grinding Jar Set. Approximately 100 mg of ground tissue was homogenized in 1 ml PBS homogenate buffer in an Eppendorf tube with TissueLyser II, and the samples were then centrifuged. Superoxide dismutase (SOD) activity,Citation15 glutathione (GSH) levels,Citation16 and malondialdehyde (MDA) levelsCitation17 from each sample supernatant and standards were measured at room temperature in duplicate according to the modified methods with an ELISA reader. The average absorbances of each sample and standard were calculated, a standard curve was plotted, and the equation was obtained from the absorbance of the standards. Linear SOD, GSH, and MDA concentrations were calculated according to this equation, and all data are presented as the mean ± standard deviation results based on per mg protein.
Assessment of renal function
As indicators of renal function, the blood urea nitrogen (BUN), creatinine (Cr) (BEN Biochemical Enterprise Ref BK151, BEN Biochemical Enterprise Ref Cr280, respectively) levels were measured with the Chemwell biochemistry analyzer.
Determination of serum renin and angiotensin II concentration
Commercially available ELISA kits were used to determine the serum concentrations of renin (Catalog No: 201-11-0549, SunRed, China) and angiotensin II (Catalog No: 201-11-0656, SunRed, China). All analyses were performed in accordance with the manufacturer’s instructions. All data are presented as the mean ± standard deviation.
Protein determination
The protein concentrations were determined with the Lowry method using commercial protein standards (Sigma Aldrich, Total Protein Kit-TP0300-1KT-USA).
Total RNA extraction and cDNA synthesis
The tissues (20 mg) were stabilized in RNA Stabilization Reagent (RNAlater, Qiagen), and then disrupted using the TissueLyser II (Qiagen). The total RNA was purified using the RNeasy Mini Kit (Qiagen) according to the manufacturer’s instructions in a QIAcube (Qiagen). The RNA samples were then reverse-transcribed into complementary DNA with the High Capacity cDNA Reverse Transcription Kit (Applied Biosystems). The cDNA concentration and quality were assessed and quantified using the Epoch Spectrophotometer System and Take3 Plate (BioTek).
Relative quantification of gene expression (real-time reverse transcriptase-polymerase chain reaction)
The relative interleukin 1 beta (IL-1β), inducible nitric oxide synthase (iNOS), and nuclear factor kappa beta (NFkB) expression analyses were performed with StepOnePlus Real Time PCR System technology (Applied Biosystems) using cDNA synthesized from rat kidney RNA. The real-time reverse transcriptase-polymerase chain reaction (qPCR) was run using the Primer Perfect Probe mix, TaqMan Probe-based technology (Primer Design Ltd., Southampton, UK), and the results are expressed as the relative-fold compared to the control animals. The expression data for β-actin in each tissue was used as the endogenous control, and the primers and probes for the β-actin were designed by Primer Design (). For each tissue, triplicate determinations were performed in a 96-well optical plate for both targets using 9 µl of cDNA (100 ng), 1 µl of Primer Perfect Probe mix, and 10 µl of QuantiTect Probe PCR Master mix (Qiagen, Hilden, Germany) in each 20 µl reaction. The plates were heated for 2 min at 50 °C and 10 min at 95 °C, and then 40 cycles of 15 s at 94 °C and 60 s at 60 °C were applied. All data are expressed as the fold-change in expression compared to the expression in other animal groups, using the 2−ΔΔCt method.Citation19,Citation18
Table 2. Primer design.
Histopathological procedures
Light microscopy
The kidneys were fixed in 10% formalin, embedded in paraffin, sectioned at 3 µm, and stained with Harris Hematoxylin and Eosin (H&E) and Periodic Acid Schiff (PAS) using standard methods. For the light microscope (Leica DM 6400, Germany) findings, the photos were taken with an Olympus DP72 camera.
Transmission electron microscopy
The kidney tissue was cut into small pieces (1 mm3) and processed for the studies of the kidney in plastic sections and by transmission electron microscopy. The steps for processing the kidney tissue samples for electron microscopy included (in order): sampling, pre-fixation, washing, post-fixation, washing, dehydration, saturation, embedding, polymerization, ultrathin sectioning, observation and photographic image capture. The 1 mm pieces of kidney were fixed in 100 mM phosphate buffer containing 2.5% glutaraldehyde for 2 h at 4 °C. The kidneys were then washed in phosphate buffer and stored at 4 °C for later processing. The kidney tissue was post-fixed in 1% osmium tetroxide, dehydrated in an ethanol series, and then embedded in an epoxy resin (Araldite CY212) kit (Agar scientific, Essex, United Kingdom). Then, 750 nm thick sagittal sections were cut and toluidine-blue stained for light microscopic analysis. The stained sections were visualized and imaged using a Leica DM 6400 (Leica Microsystems, Wetzlar, Germany). For electron microscopic analysis, ultrathin sections (60–70 nm) were cut in an ultra-microtome (LKB Nova, Sweden) set on 200-mesh copper or nickel grids. Ultrathin sections at the top of the nickel grid were stained with uranyl acetate and Reynold’s lead citrate for transmission electron microscopic analysis. These were imaged on a JEOL 100SX transmission electron microscope (JEOL Ltd., Akishima, Tokyo, Japan) with photographic image capture (Kodak 4489, Eastman Kodak Company, Rochester, NY).
Statistical analysis
For the molecular analyses, we used GraphPad Prism, version 5.0, and the results are presented as the means ± standard deviation (SD). Comparisons between the groups were performed using the one-way ANOVA and Tukey’s multiple comparison test; significance was accepted at p < 0.001. For the biochemical analyses, we used the IBM SPSS Program, version 20, and the results are presented as the means ± standard deviation (SD). Comparisons between the groups were performed using the one-way ANOVA and Duncan’s multiple comparison test; significance was accepted at p < 0.05.
Results
Biochemical results
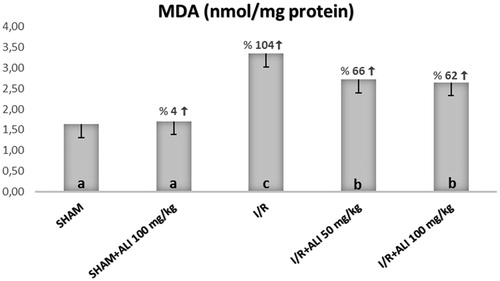
In the I/R group, the kidney tissue SOD activity and GSH levels were significantly decreased, but the tissue MDA levels were significantly increased when compared with the control group (). In the I/R + aliskiren groups, the SOD activity and GSH levels were significantly improved when compared with the I/R group (non-dose-dependent manner). The MDA levels were significantly decreased in the treatment groups in comparison to the I/R group ().
Figure 1. Effect of aliskiren treatment on SOD activity in the rats’ kidney tissues. ALI: aliskiren, I/R: ischemia/reperfusion. Notes: Means in the same column by the same letter are not significantly different to the test of Duncan (p = 0.05). Results are means ± SD.
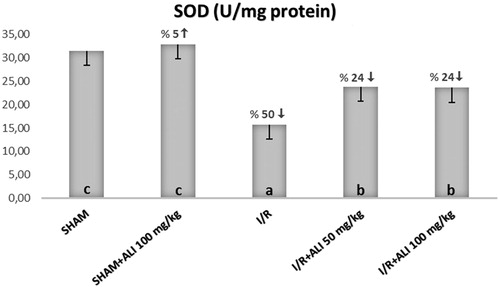
Figure 2. Effect of aliskiren treatment on GSH levels in the rats’ kidney tissues. ALI: aliskiren, I/R: ischemia/reperfusion. Notes: Means in the same column by the same letter are not significantly different to the test of Duncan (p = 0.05). Results are means ± SD.
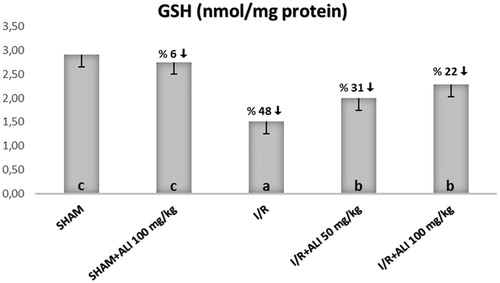
Figure 3. Effect of aliskiren treatment on MDA levels in the rats’ kidney tissues. ALI: aliskiren, I/R: ischemia/reperfusion. Notes: Means in the same column by the same letter are not significantly different to the test of Duncan (p = 0.05). Results are means ± SD.
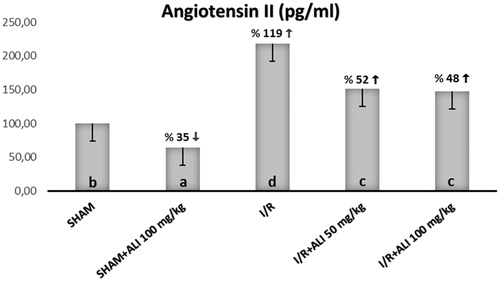
The serum biochemical analysis demonstrated a significant increase in the serum BUN, Cr, renin and AT-2 for the I/R group when compared with the sham group, as shown in . The administration of aliskiren decreased the serum levels of BUN, Cr, renin and AT-2 in comparison with the I/R group, while only renin was significantly increased in the I/R + aliskiren groups ().
Figure 4. Effect of aliskiren treatment on serum BUN levels in rats. Notes: ALI: aliskiren, I/R: ischemia/reperfusion. Means in the same column by the same letter are not significantly different to the test of Duncan (p = 0.05). Results are means ± SD.
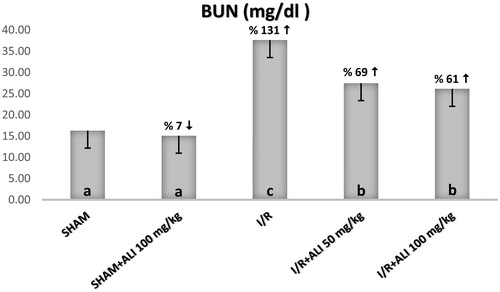
Figure 5. Effect of aliskiren treatment on serum creatinine levels in rats. Notes: ALI: Aliskiren, I/R: ischemia/reperfusion. Means in the same column by the same letter are not significantly different to the test of Duncan (p = 0.05). Results are means ± SD.
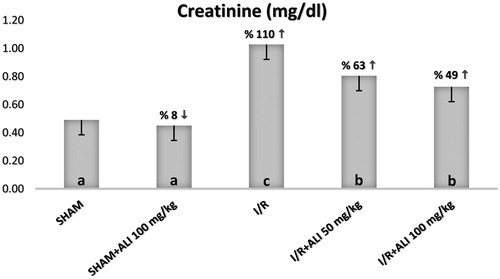
Figure 6. Effect of aliskiren treatment on serum renin levels in rats. Notes: ALI: aliskiren, I/R: ischemia/reperfusion. Means in the same column by the same letter are not significantly different to the test of Duncan (p = 0.05). Results are means ± SD.
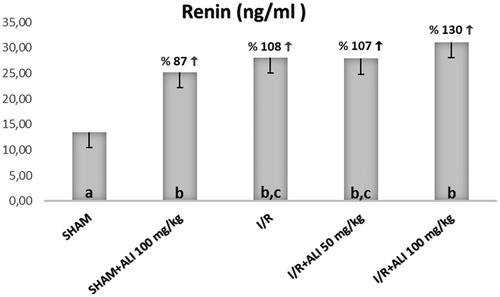
Figure 7. Effect of aliskiren treatment on serum angiotensin II levels in rats. Notes: ALI: aliskiren, I/R: ischemia/reperfusion. Means in the same column by the same letter are not significantly different to the test of Duncan (p = 0.05). Results are means ± SD.
IL-1β, iNOS and NFkB mRNA gene expression
Our results showed that the IL-1β and NFkB gene expression increased in response to I/R injury in the I/R group when compared to the control group ( and ). The aliskiren treatment groups showed a significant up-regulatory effect on IL-1β, iNOS and NFkB mRNA expression (p < 0.0001) in the I/R + aliskiren groups ( and ).
Figure 8. Effects of aliskiren treatment on relative mRNA expression levels of IL-1β in rats’ kidney tissues. Notes: Expressions of mRNAs were detected by quantitative real time PCR analysis. β-actin was used as the reference gene. Gene-specific probes were used as outlined under “Material and methods”. The relative expression levels were calculated by the 2−ΔΔCT method. ALI: aliskiren, I/R: ischemia/reperfusion. Values of all significant correlations are given with degree of significance indicated (*p < 0.05, ***p < 0.0001).
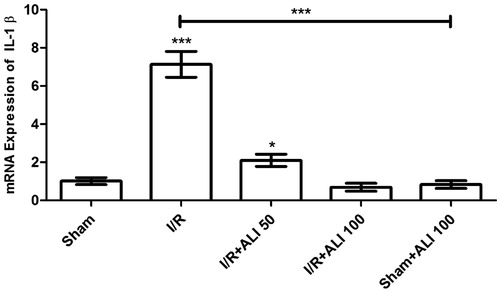
Figure 9. Effects of aliskiren treatment on relative mRNA expression levels of iNOS in rats’ kidney tissues. Notes: Expressions of mRNAs were detected by quantitative real time PCR analysis. β-actin was used as the reference gene. Gene-specific probes were used as outlined under “Material and methods”. The relative expression levels were calculated by the 2−ΔΔCT method. ALI: aliskiren, I/R: ischemia/reperfusion. Values of all significant correlations are given with degree of significance indicated (***p < 0.0001).
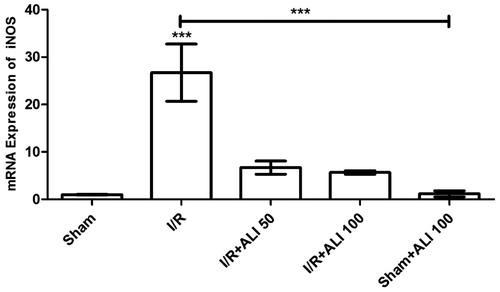
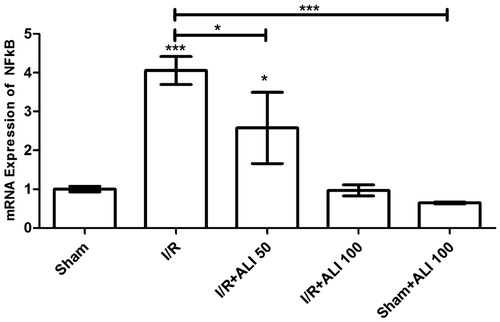
Figure 10. Effects of aliskiren treatment on relative mRNA expression levels of NFkB in rats’ kidney tissues. Notes: Expressions of mRNAs were detected by quantitative real time PCR analysis. β-actin was used as the reference gene. Gene-specific probes were used as outlined under “Material and methods”. The relative expression levels were calculated by the 2−ΔΔCT method. ALI: aliskiren, I/R: ischemia/reperfusion. Values of all significant correlations are given with degree of significance indicated (*p < 0.05, ***p < 0.0001).
When compared to the control group, the iNOS mRNA level in the I/R group was significantly higher (p < 0.0001) (), which suggested that aliskiren reduced the iNOS expression in the rat kidney. The iNOS expression of the treatment groups that were administered aliskiren at 50 and 100 mg/kg showed decreases when compared to the control group ().
The NFkB gene expression increased in the I/R groups when compared to the control group (). Aliskiren significantly decreased the NF-kB mRNA expression (p < 0.0001) in the I/R + aliskiren groups ().
Histopathological results
Light microscopy results
Under light microscopy, the slides from the control group showed glomeruli demonstrating normal Bowman’s capsules and tubular structures, as well as typical podocytes, mesangial cells and capsular space. The medullary area of the kidney showed normal tubules and tubular basement membranes, which appeared to be clear (). The light microscopic findings of the sham + aliskiren 100 mg/kg group were similar to those of the control group (). To summarize: normal structures of the tubules and Bowman’s capsules were observed, and the tubular basement membrane had obvious limits. Under light microscopy, the samples from the ischemic group showed glomerulosclerosis and widespread tubular necrosis, with tubular vacuolation, hypertrophic glomeruli and narrowing of the Bowman’s space, cast formation and capillary dilatation ().
Figure 11. (Sham Group) (A) Light microscopy of a glomerulus demonstrating typically glomerular (g) structures. Podocyte, mesangial cell appear clear (arrow). Capsular spice is shown (s). H&E stain. (B) Light microscopy of medullar region. Tubular (t) structure and tubular basement membrane (tailed arrow) appear clear. H&E stain. (C) Kidneys showing typically structured tubules (t) and glomeruli (g). Tubular basement membrane clear appeared (arrow head). Capsular spice is shown (s). Podocyte (arrow), mesangial cell (curved arrow) appear clear PAS stain, 10×.
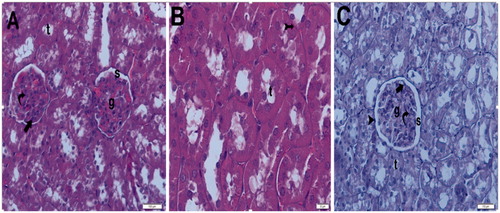
Figure 12. (Sham + aliskiren 100 mg/kg) (A) Light microscopy of a glomerulus demonstrating normal thickening of the glomerular capillary wall. Podocyte (arrow) and mesangial cell (curved arrow). Typical capsular spice (s) and tubular structure (t). H&E stain. (B) Light microscopy of a glomerulus demonstrating normal glomerular structure and typical bowman space (arrow). Typical tubular basement membrane (tailed arrow). H&E stain.
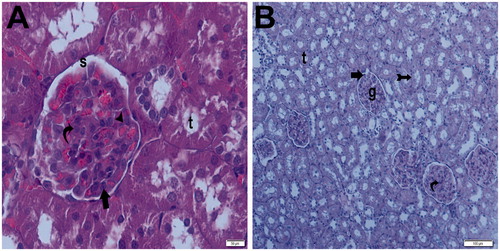
Figure 13. (Ischemia/reperfusion group) (A) Light microscopy of a glomerulosclerosis (spiral arrow) demonstrating and Bowman’s space lose (arrow). Many tubules show dense hyaline casts (arrow head). H&E stain. (B) Light microscopy of a glomerulosclerosis (spirally arrow) demonstrating and Bowman’s space lose (arrow). Many tubules show dense hyaline casts (arrow head). H&E stain. (C) Light microscopy of a glomerulosclerosis (spirally arrow). Many tubules show necrotic tubules (arrow head). H&E stain. (D) Light microscopy of a many tubules showing dense hyaline casts (arrow head).H&E stain. (E) Light microscopy of a glomerulosclerosis (spirally arrow) demonstrating and Bowman’s space lose (arrow). Many tubules show dense hyaline casts (arrow head). PAS stain. (F) Light microscopy of a glomerulosclerosis (spirally arrow) demonstrating and Bowman’s space lose (arrow). Many tubules show dense hyaline casts (arrow head). PAS stain.
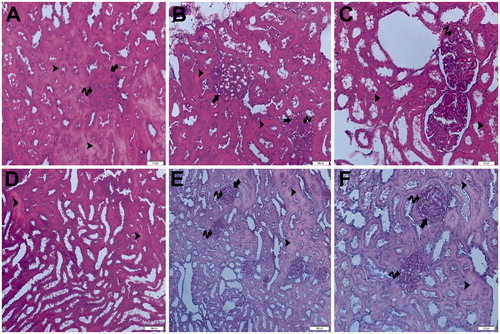
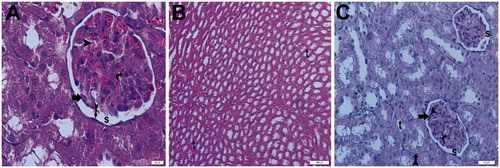
A hemorrhagic area was seen in the kidney medulla, and light microscopy has indicated necrotic cellular debris. Tubular vacuolation could also be seen. In the hemorrhagic area of the kidney medulla, infiltration and capillary basement thickening could be seen. Light microscopic samples from the ischemia + aliskiren 50 mg/kg showed normal thickening of the glomerular capillary wall, with typical podocytes and mesangial cells. The tubular basement membrane could be seen clearly. On one slide, a glomerulus demonstrating normal thickening of the glomerular capillary wall and normal tubular structure could be seen. The Bowman’s capsular space appeared to be typical ().
Figure 14. (Ischemia/reperfusion + aliskiren 50 mg/kg). (A) Light microscopy of a glomerulus demonstrating normal thickening of the glomerular capillary wall (arrow head) and typical podocyte (arrow), mesangial cell (curved arrow). Parietal endothelial cell (tailed arrow). Typical capsular spice (S). H&E stain. (B) Light microscopy of demonstrating normal tubular (t) structure. H&E stain. (C) Light microscopy of a glomerulus demonstrating normal thickening of the glomerular capillary wall (arrow head) and typical podocyte (arrow), mesangial cell (curved arrow). Tubular basement membrane appears clear (tailed arrow). Typical capsular space (s). Kidney medulla showing normal tubular structure (t) PAS stain.
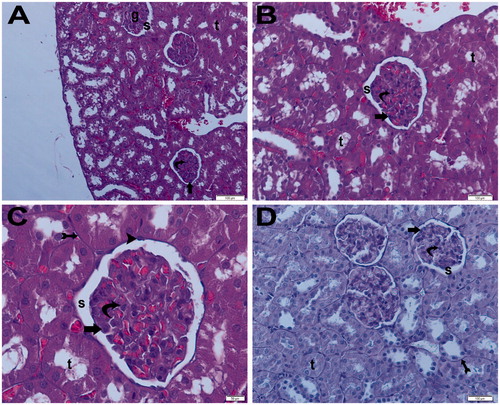
Light microscopy samples from the ischemia + aliskiren 100 mg/kg group incurred no tubular or glomerular injury, with normal glomeruli and typical podocytes, mesangial cells and tubular basement membranes appearing clearly. The medulla of the kidney showed normal tubules with no infiltration or hemorrhage. The ischemia + aliskiren 100 mg/kg group and ischemia + aliskiren 50 mg/kg group exhibited similar findings ().
Figure 15. (Ischemia/reperfusion + aliskiren 100 mg/kg) (A) Light microscopy of a glomerulus (g) demonstrating normal glomerular structure and typical podocyte (arrow), mesangial cell (curved arrow). Typical capsular space (s). Normally tubular structure (t). H&E stain. (B) Light microscopy of a glomerulus demonstrating normal glomerular structure and typical podocyte (arrow), mesangial cell (curved arrow). Typical capsular space (s). Normally tubular structure (t). H&E stain. (C) Light microscopy of a glomerulus demonstrating normal glomerular structure and typical podocyte (arrow), mesangial cell (curved arrow). Typical capsular space (s) and normally tubular structure (t). Tubular basement membrane appears clear (tail arrow). Typical parietal epithelial cell (arrow head) H&E stain. (D) Light microscopy of a glomerulus demonstrating normal glomerular structure and typical podocyte (arrow), mesangial cell (curved arrow). Typical capsular space (s) and normal tubular structure (t). Tubular basement membrane appears clear (tail arrow). PAS stain.
Electron microscopy results
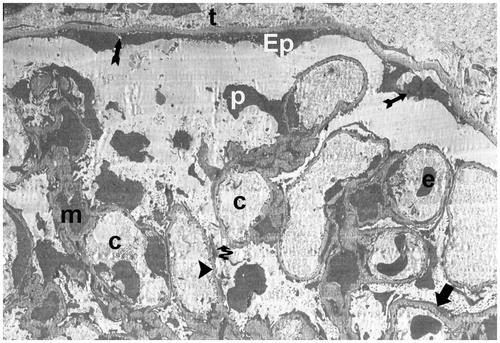
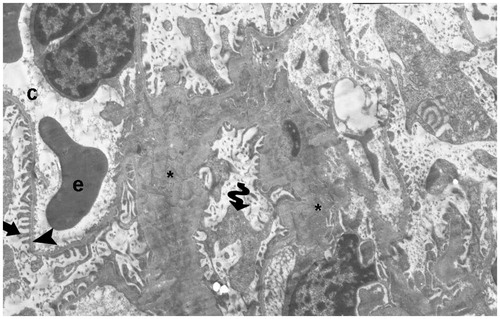
The electron micrographs showed a peritubular capillary together with a normal basal lamina in one control, as well as typical podocytes and foot processes. Additional electron micrographs showed peritubular capillaries with normal basal lamina, as well as typical podocytes and foot processes ( and ). In the I/R groups, the electron micrographs showed degenerative glomeruli, while the capillary basement membrane lamina densa, lamina rara interna and externa disappeared. Necrotic podocytes and mesangial cells, and podocyte infolding with pedicel degeneration, were also seen ().
Figure 16. (Electron micrographs show sham group ultrastructure). Electron micrographs showing peritubular capillary with normal basal lamina (arrow head) in a control. Electron microscopic findings show typical podocyte foot process (arrow). Capillary (c). Erythrocyte 3000×.
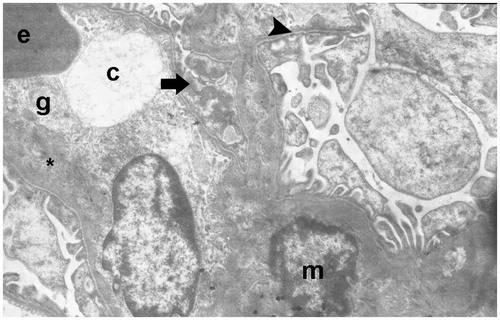
Figure 17. (Electron micrographs show Sham + aliskiren 100 mg/kg group ultrastructure). Electron micrographs showing a glomerular capillary (asterisk) with normal basal lamina and podocyte foot process (arrow head). Electron microscopic findings show typical parietal epitalial cell (Ep). Erythrocyte (e). Capillary (asterisk). Podocytes (P). Bowman’s capsular space (s). 25,000×.
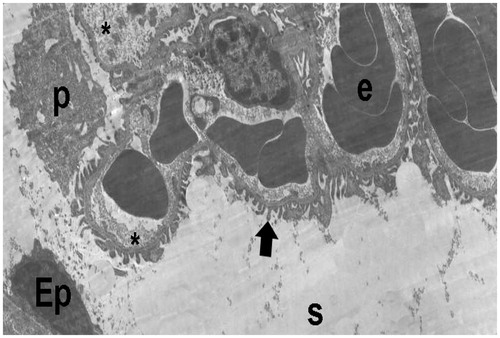
Figure 18. (Electron micrographs show ischemia–reperfusion group ultrastructure). Electron micrographs showing a glomerulosclerosis. Capillary basement membrane lamina densa, lamina rara interna and externa disappear (arrow head). Necrotic podocytes (p) and mesangial cell (m). Podocytes infolding (arrow). Necrotic paritel epithelial cell (Ep). Vacuoles in the cytoplasm of the parietal epithelial cells (tailed arrow). Small vacuoles in capillary basement membrane (spiral arrow). Capillary (c). Mesangial cell (m). Necrotic tubules (t). 15,000×.
In the I/R + aliskiren 50 mg/kg group, the electron micrographs showed a peritubular capillary with normal basal lamina. The capillary basement membrane lamina densa, lamina rara interna and externa were clearly present. Additionally, the electron microscopic findings showed typical podocytes and foot processes (). In the I/R + 100 mg/kg electron micrographs, there was a peritubular capillary with normal basal lamina. The capillary basement membrane lamina densa, lamina rara interna and externa appeared clearly, along with typical podocytes and foot processes, as well as mesangial cells ( and ).
Figure 19. (Electron micrographs show ischemia/reperfusion + aliskiren 50 mg/kg group ultrastructure). Electron micrographs showing a glomerular capillary with normal basal lamina (arrow head). Capillary basement membrane lamina densa, lamina rara interna and externa clear appear (arrow). Electron microscopic findings show typical podocytes (p) and foot process (arrow). Erythrocyte (e). Bowman’s capsular space (s). 15,000×.
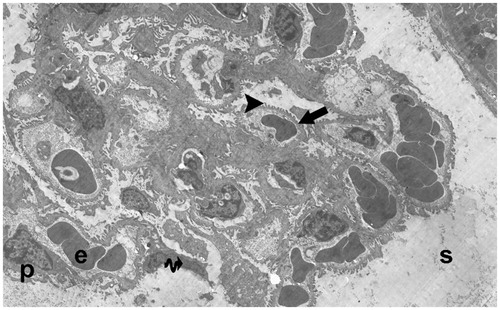
Figure 20. (Electron micrographs show ischemia–reperfusion + aliskiren 100 mg/kg group ultrastructure). Electron micrographs showing glomerular capillary (c) with normal basal lamina (arrow head). Electron microscopic findings show typical podocytes (p) and foot processes (arrow). Mesangial cell (m). Erythrocyte (e). Typical parietal epitalial cell (Ep). 10,000×.
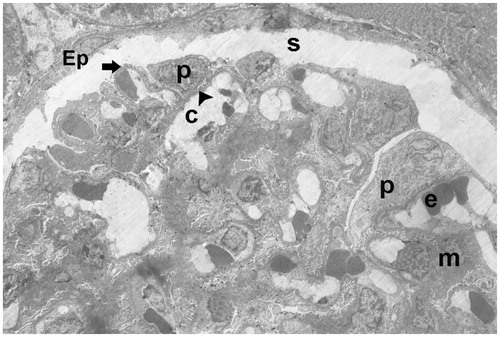
Figure 21. (Electron micrographs show ischemia–reperfusion + aliskiren 100 mg/kg group ultrastructure). Electron micrographs showing glomerular capillary (c). Capillary basement membrane (arrow head) lamina densa, lamina rara interna and externa appear clear. Electron microscopic findings show typical podocytes (spirally arrow) foot processes (arrow). Erythrocyte (e). 4000×.
Discussion
Our study examined the effect of aliskiren, which is a renin inhibitor, on renal ischemia–reperfusion using histopathological electron microscopy, both biochemically and molecularly. The effect of renin, and thus, AT-2 on ischemia–reperfusion (I/R) damage and the role of this pathway’s inhibition in preventing ischemia–reperfusion damage are shown through various methods. This renal ischemia–reperfusion study is clinically quite important, in that it is one of the first structures which are influenced in renal surgery as well as by anything that disrupts the hemodynamics of the organ. The results of our study show that IL-1β, and NF-κβ increase as molecular parameters in ischemia–reperfusion damage, while free oxygen radicals increase and the amount of iNOS increases in parallel. We could say that AT-2 is highly correlated with ischemia–reperfusion based on the thesis upon which our hypothesis relies. When we look at the routine biochemical kidney function test, which is the most objective finding of this damage, we see that the I/R damage also substantially disrupts kidney functions.
We have supported these findings through histopathological and electron microscopy, which are the gold standards of study, and can say that aliskiren treatment (i.e. renin inhibition) corrects all parameters which are disrupted in I/R.
Acute kidney damage is one of the most important reasons for mortality in intensive care units.Citation19 The early diagnosis and treatment of acute kidney damage is one of the most important factors in the correction of the progress of this disease. The most well-known diagnostic methods for determining kidney damage are the BUN and serum creatine levels.Citation20 When taking this into account in our study, the BUN and creatine levels substantially increased during the I/R period and, interestingly enough, this increase was corrected by the aliskiren treatment.
Severe tissue and organ damage occurs in ischemia and reperfusion with regard to the restarting of the subsequently developing blood supply.Citation21,Citation22 Ischemia stops the oxygen support which is necessary for the tissues to survive and maintain their functions, and thus, ischemia occurs in every tissue where there is blood build-up. However, ischemia in the kidney is very important clinically. Many conditions, such as kidney transplantation, partial nephrectomy and hydronephrosis, lead to kidney ischemia and result in renal tissue damage, and thus, dysfunction.Citation20–22 Additionally, reperfusion damage occurs when reperfusion develops following ischemia. The sudden re-oxygenation of the oxygen-starved tissues leads to oxidative stress development and regeneration problems.Citation23
Among the oxide radicals present, there are hydroxyl nitric oxide and superoxide, and several defense mechanisms step is against this extremely increased oxidative stress. With the superoxide radicals, nitric oxide and peroxynitrite are created and lead to cellular damage.Citation24,Citation25 However, they are deactivated by both superoxide radicals and peroxynitrite SOD (superoxide dismutase).Citation26,Citation27 The increase in the superoxide radicals and the decrease in the antioxidant defense mechanism are ordinary occurrences in I/R damage. In normal physiological incidents, superoxide radicals are strongly controlled by various antioxidant enzymes, such as SOD and catalase, but the increase of superoxide radicals due to antioxidants and oxygen insufficiency during renal I/R leads to a decrease in antioxidant enzymes. This is because the DNA, lipids and proteins where these enzymes are synthesized are bombarded by the superoxide radicals.
Studies have shown that the SOD activity decreases rapidly during renal I/R.Citation28–30 Our study also shows that the amount of SOD significantly decreased in I/R when we considered free oxygen radicals, and this decrease was corrected in the group which was given only aliskiren. There are various studies which show that the RAS (rennin–angiotensin system) is effective in the functional disorders which occur in renal I/R.Citation31,Citation32 The experimental studies which were done with the angiotensin receptor blockers based on this information showed that I/R related renal damage can be decreasedCitation33,Citation34; renin converts angiotensinogen into angiotensin, while in angiotensin I it is converted to ACE (angiotensin converting enzyme) and angiotensin II. Such effects shown by the ARBs (angiotensin receptor blockers) which disrupt this cascade are natural. Additionally, the renin inhibition which is commissioned in the same cascade makes one think about similar protective effects; therefore, there was a study on aliskiren in renal I/R.Citation35 However, the aliskiren dosage was low, and it does not explain the status of the cytokines and free oxygen radicals in showing the I/R. Additionally, the renin levels were not measured in this study.
In another study, aliskiren-related renal I/R was conducted as well, and although the free oxygen radicals were measured in this study, no associated cytokine studies were done. Further, the rennin–angiotensin systems were not only studied in aliskiren in renal I/R, but also in the heart and brain.Citation36,Citation37 These studies showed that AT-2 substantially increased and that the local rennin–angiotensin system had cardiac significance.Citation31,Citation38 Increased AT-2 levels aggravated the oxidative stress and inflammationCitation39,Citation40; therefore, it was observed that the amount of SOD increased in the groups which were given aliskiren.
When looking at the GSH (glutathione) levels, they are expected to decrease in conditions of high oxidative stress, like SOD. Decreased GSH was recovered in the treatment groups in which the amount of GSH decreased in I/R. The blocking of the aliskiren and rennin–angiotensin system and decrease of AT-2 reduced the oxidative stress dependent tissue damage, and thus, restored the antioxidant defense mechanism. The findings which are supportive of this hypothesis were found in a study which was done in relation to aliskiren.Citation41
Another parameter which showed oxidative stress in our study was the MDA. Our results showed that the MDA increased in I/R, and the increased MDA was decreased by aliskiren treatment. The MDA is the most important indicator showing lipid peroxidation in the ischemia–reperfusion induced tissue damage.Citation42 Additionally, in another part of our study, the iNOS was measured. It was seen that iNOS increased in the I/R, and the increased iNOS decreased in the treatment groups. The NO which was increased in the I/R creates a complex with angiotensin and reactive oxygen types. These pathways are involved in the physiopathology of several diseases.Citation43
It has been shown that AT-2 increases the synthesis of NO by stimulating cardiac myositis,Citation44 and at the same time, AT-2 increases superoxide radical production, which reacts with the increased NO, increasing the generation of peroxynitrite.Citation45 NO has important characteristics in renal circulation and urine generation,Citation46 and one study showed that iNOS expression increased in renal I/R.Citation47 While iNOS depends on a very low basal expression under normal conditions, its expression increases based on cytokines and oxidative stress.Citation48,Citation49 Several researchers have shown that iNOS increased in I/R, and the decrease in the amount of iNOS reduced renal dysfunction and damage.Citation50,Citation51 Additionally, iNOS expression substantially decreased with aliskiren treatment in our study. iNOS and AT-2 have a strong connection, in that the increase in AT-2 increases iNOS activation.Citation52 With the aliskiren treatment, the decrease in AT-2 naturally reduced the iNOS expression.
The SOD and GSH, as well as the iNOS parameters, were seen to be recovered by aliskiren treatment. With regard to what extent the aliskiren application changed the amount of angiotensin, it was seen that the AT-2 substantially increased in I/R, while it substantially decreased in the group which was given aliskiren, in accordance with the literature. Additionally, when looking at the renin level, it was seen that the amount of renin increased in the I/R group in parallel with the AT-2, while the same increase continued in the groups which were given aliskiren. This is because the aliskiren inhibits the active enzymatic part of the renin, and it does not stop renin production.Citation11
Aliskiren is a renin inhibitor, and it increases the body’s renin expression as a defense mechanism. When looking at both the biochemical and oxidative stress parameters, one can see that aliskiren has very important protective effects.
With regard to the electron microscopic findings, it can be seen that the degenerative glomerular and capillary structures are totally disrupted in the I/R group, and that the capillary membrane is more clearly seen in our treatment groups, despite observing necrotic podocytes. Thus, the podocyte structures without disruption remain steady.
When using the expressions of I/R damage, free oxygen radicals and angiotensin, it is inevitable to discuss cytokines. The increased oxidative stress in I/R damage as well as the increased AT-2 inflammation increase the expression of cytokines.Citation53 The I/R also increases the release of NF-κβ in the kidney tissue.Citation54,Citation55 In one study, it was shown that captopril application inhibited the NF-κβ signal pathway and decreased the TNF-α and iNOS.Citation56,Citation57 Therefore, ACE inhibitors and AT-2 antagonist inhibition can be used in preventing chronic complications induced by disease.Citation58,Citation59
The increase in free oxygen radicals also leads to NF-κβ activation at an early phase, and increases the release of proinflammatory cytokines.Citation60 A previous study has shown that angiotensin receptor blockers led to both the inhibition of free oxygen radicals and the inhibition of the NF-κβ signal pathway.Citation61 In our study, however, we can say that based on the I/R, the NF-κβ amounts substantially increased, while the NF-κβ amount which increased with the blockage of aliskiren and AT-2 decreased. This may have decreased the AT-2 production and led to the decrease in free oxygen radicals, and been effective in inhibiting NF-κβ expression.
Inflammation has very important functions in I/R damage, and studies have shown that neutrophils, T and B lymphocytes and macrophages controlled the dominant damage in I/R.Citation62–64 Several chemokines are released in these inflammatory cells; in particular, IL-1β, and TNF-α.Citation65,Citation66 In our study, the IL-1β levels increased in I/R damage and substantially decreased in the treatment groups which were given aliskiren. This decrease may have depended on the decrease in AT-2 levels, as we have mentioned before.
As a result of this study, we have shown again in the literature that AT-2 has important effects and aggravating properties in I/R damage. While I/R damage induced increased AT-2 levels increasing superoxide radicals, it inhibited the antioxidant enzymes of the body. It also increased the inflammatory cytokines which play important roles in I/R damage. The inhibition of the renin enzyme activation by aliskiren decreased the nitric oxide and AT-2 levels, and I/R induced renal damage was shown at biochemical, histopathological and molecular levels. Additionally, these results were supported by electron microscopic findings.
Declaration of interest
This work was supported by the Ataturk University Medical Research Council (grant number 2012/392).
None of the authors have commercial interests, financial interests and/or other relationships with the manufacturers of pharmaceuticals, laboratory supplies and/or medical devices, or with commercial providers of medically related services.
References
- Zimmerman BJ, Granger DN. Reperfusion injury. Surg Clin North America. 1992;72(1):65–83
- Huang WC, Elkin EB, Levey AS, Jang TL, Russo P. Partial nephrectomy versus radical nephrectomy in patients with small renal tumors – is there a difference in mortality and cardiovascular outcomes? J Urol. 2009;181(1):55–61; discussion 61–62
- Janetschek G. Laparoscopic partial nephrectomy for RCC: How can we avoid ischemic damage of the renal parenchyma? Eur Urol. 2007;52(5):1303–1305
- Gao Y, Chen L, Ning Y, et al. Hydro-Jet-assisted laparoscopic partial nephrectomy with no renal arterial clamping: A preliminary study in a single center. Int Urol Nephrol. 2014;46(7):1289–1293
- Versteilen AM, Di Maggio F, Leemreis JR, Groeneveld AB, Musters RJ, Sipkema P. Molecular mechanisms of acute renal failure following ischemia/reperfusion. Int J Artif Organs. 2004;27(12):1019–1029
- Molitoris BA, Sutton TA. Endothelial injury and dysfunction: Role in the extension phase of acute renal failure. Kidney Int. 2004;66(2):496–499
- Edelstein CL, Ling H, Wangsiripaisan A, Schrier RW. Emerging therapies for acute renal failure. Am J Kidney Dis. 1997;30(5 Suppl 4):S89–S95
- Mackie FE, Campbell DJ, Meyer TW. Intrarenal angiotensin and bradykinin peptide levels in the remnant kidney model of renal insufficiency. Kidney Int. 2001;59(4):1458–1465
- Siamopoulos KC, Kalaitzidis RG. Inhibition of the renin-angiotensin system and chronic kidney disease. Int Urol Nephrol. 2008;40(4):1015–1025
- Koid SS, Ziogas J, Campbell DJ. Aliskiren reduces myocardial ischemia–reperfusion injury by a bradykinin B2 receptor- and angiotensin AT2 receptor-mediated mechanism. Hypertension. 2014;63(4):768–773
- Zhang W, Han Y, Meng G, et al. Direct renin inhibition with aliskiren protects against myocardial ischemia/reperfusion injury by activating nitric oxide synthase signaling in spontaneously hypertensive rats. J Am Heart Assoc. 2014;3(1):e000606
- Choi DE, Jeong JY, Lim BJ, et al. Aliskiren ameliorates renal inflammation and fibrosis induced by unilateral ureteral obstruction in mice. J Urol. 2011;186(2):694–701
- Moriyama T, Tsuruta Y, Kojima C, et al. Beneficial effect of aliskiren combined with olmesartan in reducing urinary protein excretion in patients with chronic kidney disease. Int Urol Nephrol. 2012;44(3):841–845
- Lizakowski S, Tylicki L, Renke M, et al. Effect of aliskiren on proteinuria in non-diabetic chronic kidney disease: A double-blind, crossover, randomised, controlled trial. Int Urol Nephrol. 2012;44(6):1763–1770
- Sun Y, Oberley LW, Li Y. A simple method for clinical assay of superoxide dismutase. Clin Chem. 1988;34(3):497–500
- Sedlak J, Lindsay RH. Estimation of total, protein-bound, and nonprotein sulfhydryl groups in tissue with Ellman’s reagent. Anal Biochem. 1968;25(1):192–205
- Ohkawa H, Ohishi N, Yagi K. Assay for lipid peroxides in animal tissues by thiobarbituric acid reaction. Anal Biochem. 1979;95(2):351–358
- Livak KJ, Schmittgen TD. Analysis of relative gene expression data using real-time quantitative PCR and the 2(-Delta Delta C(T)) method. Methods. 2001;25(4):402–408
- Schrier RW, Wang W. Acute renal failure and sepsis. N Engl J Med. 2004;351(2):159–169
- Waikar SS, Bonventre JV. Biomarkers for the diagnosis of acute kidney injury. Curr Opin Nephrol Hypertens. 2007;16(6):557–564
- Grace PA. Ischemia–reperfusion injury. Br J Surg. 1994;81(5):637–647
- Anaya-Prado R, Toledo-Pereyra LH, Lentsch AB, Ward PA. Ischemia/reperfusion injury. J Surg Res. 2002;105(2):248–258
- Masztalerz M, Wlodarczyk Z, Czuczejko J, Slupski M, Kedziora J. Superoxide anion as a marker of ischemia–reperfusion injury of the transplanted kidney. Transplant Proc. 2006;38(1):46–48
- Radi R, Beckman JS, Bush KM, Freeman BA. Peroxynitrite-induced membrane lipid peroxidation: The cytotoxic potential of superoxide and nitric oxide. Arch Biochem Biophys. 1991;288(2):481–487
- Szabo C, Zingarelli B, O’Connor M, Salzman AL. DNA strand breakage, activation of poly (ADP-ribose) synthetase, and cellular energy depletion are involved in the cytotoxicity of macrophages and smooth muscle cells exposed to peroxynitrite. Proc Nat Acad Sci USA. 1996;93(5):1753–1758
- MacMillan-Crow LA, Crow JP, Kerby JD, Beckman JS, Thompson JA. Nitration and inactivation of manganese superoxide dismutase in chronic rejection of human renal allografts. Proc Nat Acad Sci USA. 1996;93(21):11853–11858
- Yamakura F, Taka H, Fujimura T, Murayama K. Inactivation of human manganese-superoxide dismutase by peroxynitrite is caused by exclusive nitration of tyrosine 34 to 3-nitrotyrosine. J Biol Chem. 1998;273(23):14085–14089
- Singh I, Gulati S, Orak JK, Singh AK. Expression of antioxidant enzymes in rat kidney during ischemia-reperfusion injury. Mol Cell Biochem. 1993;125(2):97–104
- Davies SJ, Reichardt-Pascal SY, Vaughan D, Russell GI. Differential effect of ischemia–reperfusion injury on anti-oxidant enzyme activity in the rat kidney. Exp Nephrol. 1995;3(6):348–354
- Conti M, Eschwege P, Ahmed M, et al. Antioxidant enzymatic activities and renal warm ischemia: Correlation with the duration of ischemia. Transplant Proc. 2000;32(8):2740–2741
- Kontogiannis J, Burns KD. Role of AT1 angiotensin II receptors in renal ischemic injury. Am J Physiol. 1998;274(1 Pt 2):F79–F90
- Hammad FT, Wheatley AM, Davis G. Long-term renal effects of unilateral ureteral obstruction and the role of endothelin. Kidney Int. 2000;58(1):242–250
- Habibey R, Ajami M, Hesami A, Pazoki-Toroudi H. The mechanism of preventive effect of captopril on renal ischemia reperfusion injury is independent of ATP dependent potassium channels. Iran Biomed J. 2008;12(4):241–245
- Molinas SM, Cortes-Gonzalez C, Gonzalez-Bobadilla Y, et al. Effects of losartan pretreatment in an experimental model of ischemic acute kidney injury. Nephron Exp Nephrol. 2009;112(1):e10–e19
- Hammad FT, Al-Salam S, Lubbad L. Does aliskiren protect the kidney following ischemia reperfusion injury? Physiol Res. 2013;62(6):681–690
- Schmerbach K, Pfab T, Zhao Y, et al. Effects of aliskiren on stroke in rats expressing human renin and angiotensinogen genes. PLoS One. 2010;5(11):e15052
- Shi X, Yan C, Nadtochiy SM, Abe J, Brookes PS, Berk BC. p90 Ribosomal S6 kinase regulates activity of the renin-angiotensin system: A pathogenic mechanism for ischemia–reperfusion injury. J Mol Cell Cardiol. 2011;51(2):272–275
- Oyamada S, Bianchi C, Takai S, et al. Impact of acute myocardial ischemia reperfusion on the tissue and blood-borne renin–angiotensin system. Basic Res Cardiol. 2010;105(4):513–522
- Kim SM, Kim YG, Jeong KH, et al. Angiotensin II-induced mitochondrial Nox4 is a major endogenous source of oxidative stress in kidney tubular cells. PLoS One. 2012;7(7):e39739
- Thurman JM. Triggers of inflammation after renal ischemia/reperfusion. Clin Immunol. 2007;123(1):7–13
- Rashikh A, Ahmad SJ, Pillai KK, Kohli K, Najmi AK. Aliskiren attenuates myocardial apoptosis and oxidative stress in chronic murine model of cardiomyopathy. Biomed Pharmacother. 2012;66(2):138–143
- Kacmaz A, Polat A, User Y, Tilki M, Ozkan S, Sener G. Octreotide improves reperfusion-induced oxidative injury in acute abdominal hypertension in rats. J Gastrointest Surg. 2004;8(1):113–119
- Li N, Wu X, Li L. Chronic administration of clozapine alleviates reversal-learning impairment in isolation-reared rats. Behav Pharmacol. 2007;18(2):135–145
- Ikeda U, Maeda Y, Kawahara Y, Yokoyama M, Shimada K. Angiotensin II augments cytokine-stimulated nitric oxide synthesis in rat cardiac myocytes. Circulation. 1995;92(9):2683–2689
- Haidara MA, Yassin HZ, Rateb M, Ammar H, Zorkani MA. Role of oxidative stress in development of cardiovascular complications in diabetes mellitus. Curr Vascul Pharmacol. 2006;4(3):215–227
- Adachi Y, Hashimoto K, Ono N, et al. Renal effects of a nitric oxide donor, NOC 7, in anesthetized rabbits. Eur J Pharmacol. 1997;324(2–3):223–226
- Kim JI, Jang HS, Park KM. Endotoxin-induced renal tolerance against ischemia and reperfusion injury is removed by iNOS, but not eNOS, gene-deletion. BMB Rep. 2010;43(9):629–634
- Modlinger PS, Wilcox CS, Aslam S. Nitric oxide, oxidative stress, and progression of chronic renal failure. Semin Nephrol. 2004;24(4):354–365
- Walker LM, Walker PD, Imam SZ, Ali SF, Mayeux PR. Evidence for peroxynitrite formation in renal ischemia-reperfusion injury: Studies with the inducible nitric oxide synthase inhibitor L-N(6)-(1-Iminoethyl)lysine. J Pharmacol Exp Ther. 2000;295(1):417–422
- Chatterjee PK, Patel NS, Sivarajah A, et al. GW274150, a potent and highly selective inhibitor of iNOS, reduces experimental renal ischemia/reperfusion injury. Kidney Int. 2003;63(3):853–865
- Mark LA, Robinson AV, Schulak JA. Inhibition of nitric oxide synthase reduces renal ischemia/reperfusion injury. J Surg Res. 2005;129(2):236–241
- Tan CK, Tan EH, Luo B, et al. SMAD3 deficiency promotes inflammatory aortic aneurysms in angiotensin II-infused mice via activation of iNOS. J Am Heart Assoc. 2013;2(3):e000269
- Hayashi T, Takai S, Yamashita C. Impact of the renin–angiotensin-aldosterone-system on cardiovascular and renal complications in diabetes mellitus. Curr Vascul Pharmacol. 2010;8(2):189–197
- Camara-Lemarroy CR, Guzman-de la Garza FJ, Alarcon-Galvan G, Cordero-Perez P, Fernandez-Garza NE. Effect of sulfasalazine on renal ischemia/reperfusion injury in rats. Renal Fail. 2009;31(9):822–828
- Liu WJ, Tang HT, Jia YT, et al. Notoginsenoside R1 attenuates renal ischemia–reperfusion injury in rats. Shock. 2010;34(3):314–320
- Ilieva I, Ohgami K, Jin XH, et al. Captopril suppresses inflammation in endotoxin-induced uveitis in rats. Exp Eye Res. 2006;83(3):651–657
- He X, Han B, Mura M, et al. Angiotensin-converting enzyme inhibitor captopril prevents oleic acid-induced severe acute lung injury in rats. Shock. 2007;28(1):106–111
- Casas JP, Chua W, Loukogeorgakis S, et al. Effect of inhibitors of the renin–angiotensin system and other antihypertensive drugs on renal outcomes: Systematic review and meta-analysis. Lancet. 2005;366(9502):2026–2033
- MacKinnon M, Shurraw S, Akbari A, Knoll GA, Jaffey J, Clark HD. Combination therapy with an angiotensin receptor blocker and an ACE inhibitor in proteinuric renal disease: A systematic review of the efficacy and safety data. Am J Kidney Dis. 2006;48(1):8–20
- Berthonneche C, Sulpice T, Tanguy S, et al. AT1 receptor blockade prevents cardiac dysfunction after myocardial infarction in rats. Cardiovas Drugs Ther. 2005;19(4):251–259
- Wu B, Lin R, Dai R, Chen C, Wu H, Hong M. Valsartan attenuates oxidative stress and NF-kappaB activation and reduces myocardial apoptosis after ischemia and reperfusion. Eur J Pharmacol. 2013;705(1–3):140–147
- Friedewald JJ, Rabb H. Inflammatory cells in ischemic acute renal failure. Kidney Int. 2004;66(2):486–491
- Farrar CA, Wang Y, Sacks SH, Zhou W. Independent pathways of P-selectin and complement-mediated renal ischemia/reperfusion injury. Am J Pathol. 2004;164(1):133–141
- Singbartl K, Ley K. Leukocyte recruitment and acute renal failure. J Mol Med. 2004;82(2):91–101
- Singh V, Jain S, Gowthaman U, et al. Co-administration of IL-1 + IL-6 + TNF-alpha with Mycobacterium tuberculosis infected macrophages vaccine induces better protective T cell memory than BCG. PLoS One. 2011;6(1):e16097
- Schreiber S, Nikolaus S, Hampe J, et al. Tumour necrosis factor alpha and interleukin 1beta in relapse of Crohn’s disease. Lancet. 1999;353(9151):459–461