
Abstract
Background: Hyponatremia is classified according to volume status with the help of physical examination, biochemical measures, urine and serum osmolalities, and echocardiography. Bioimpedance spectroscopy (BIS) has been getting popularity for revealing tissue compositions of various patient groups. The aim of this observational study was to investigate the role of BIS for the differential diagnosis of hyponatremia (ClinicalTrials.gov Identifier: NCT01838759). Patients and methods: Personal characteristics of age, sex, weight, height, and blood pressure were recorded. Body composition monitor (BCM) was used for hydration status for each individual. Primary outcome was investigated by the accuracy of volume status measured by BIS. Statistics: Kappa statistic (K) is a measure of agreement between two sources, which is measured on a binary scale (i.e., condition present/absent). K statistic can take values between 0 and 1: poor agreement: K < 0.20, fair agreement: 0.2.0–0.3.9, moderate agreement: 0.40–0.59, substantial: 0.60–0.79, very good agreement: 0.80–1.00. Results: Fifty-eight hyponatremia-diagnosed patients, 32 (55.2%) of male with the mean age of 65.2 ± 11 (40–89) years were included. Kappa statistic (K) were very good (K = 0.925) for male (p < 0.00), substantial agreement (K = 0.601) for female (p < 0.002) with the use of BIS for the differential diagnosis of either hypo or hypervolemia in hyponatremic patients compared with gold standard tests which were the combination of echocardiography, serum, and urine osmolality biochemical tests, and physical examination. Conclusion: Bioimpedance spectroscopy is a practical and an inexpensive method. This is the first study in the literature showing the role of BIS for the determination of the volume status and differential diagnosis of hyponatremia when compared with echocardiography.
Introduction
Volume disturbances are associated with sodium alterations. Although hypernatremia strongly indicates dehydration, hyponatremia could be seen in all hypo/hyper and euvolemic clinical settings and needs precise diagnostic tools. Hyponatremia is the most prevalent electrolyte disturbances in hospitalized and outpatients and defined as serum sodium (Na) less than 135 mEq/L.Citation1
The prevalence of hyponatremia is estimated to be nearly 1% in acute care patients and much higher rates from 18% to 30% have been observed among elderly nursing home residents and, especially, hospitalized patients. Among them, the prevalence is highest in intensive care units (ICU), usually seen with other disorders or clinical situations.Citation2
This study aims to evaluate the usefulness of the bioimpedance as a method to estimate volume status of hyponatremic patients which is very important for the differential diagnosis. To our knowledge, such an investigation has not been done elsewhere when compared echocardiography.
Material and methods
Patient selection
Patients admitted to the Bulent Ecevit University Hospital with a diagnosis of hyponatremia were included in the study. The procedures followed were in accordance with the ethical standards of the committee on human experimentation and in accordance with the Declaration of Helsinki and its revisions.Citation3 The local ethics committee of Bulent Ecevit University approved the study protocol. This cross-sectional study is registered to Clinical Trials (ClinicalTrials.gov Identifier: NCT01838759).
Exclusion criteria were the presence of cardiac stent, pacemaker, or defibrillator due to safety measures, artificial joints, pin or amputation, permanent or temporary catheters, pregnancy, or lactating in order to prevent measurement errors of bioimpedance analysis.
Clinical parameters to be recorded
Age, sex, body mass index, history of diabetes, hypertension, and blood pressure measurements were recorded.
Blood samples
Blood samples obtained under fasting conditions and studied within 2 h following centrifugation. Blood chemistry studied by using standard automated techniques (Architect C 8000 auto-analyzer and Axsyme Third-Generation Immunoassay System, Abbott, IL), including BUN, creatinine, Na, potassium (K), chlorine (Cl), serum, and urine osmolalities measured.
Study outcomes
Clinical evidence of hypervolemia
Diagnosed by pretibial edema and/or pulmonary edema or pleural effusions on chest X-ray, jugular venous pressure greater than 10 cm on physical examination (or central venous pressure greater than 10 cm H2O when measured) NYHA classes III and IV, hepatomegaly or ascites and neck vein distension ≥7 cm), and weight gain ≥2 kg during the previous week.
Echocardiographic examination
Standard echocardiographic examinations were performed using a Vingmed Vivid System 5 (General Electric, Horten, Norway) device. A 2.5 MHz probe and a 2.5–3.5 MHz probe were used for the Doppler measurements and for tissue Doppler measurements, respectively. All measurements were averaged from three cardiac cycles. 2D echocardiographic measurements were performed according to the standards outlined by the American Society of Echocardiography.Citation4 LV dimensions and wall thickness were obtained from the parasternal long axis with an M-mode cursor positioned just beyond the mitral leaflet tips, perpendicular to the long axis of the ventricle. LVEDD and LVESD diameter, thickness of the inter-ventricular septum (IVS), and PW were measured. LV ejection fraction was calculated according to the Simpson methodCitation5. All echocardiographic measurements were performed by the same observer.
Fluid overload assessment by bioimpedance
Bioimpedance measurements were performed in the supine position. The body composition monitor analyzes the total-body electrical impedance to an alternating current at 50 different frequencies (5–1000 kHz). Extracellular water (ECW), intracellular water (ICW), and total body water (TBW) are determined by the body composition monitor using the approach described previously.Citation6 The body composition monitor has been validated against bromide and deuterium dilution in patients and healthy individuals.Citation7 Fluid overload is calculated by the body composition monitor based on a physiologic tissue model.Citation8 This model separates the body into three compartments: extracellular fluid overload, normohydrated lean tissue, and normohydrated adipose tissue. Tissue properties of normohydrated lean and adipose tissue are assumed to be constant. Therefore, no adjustments for sex or ethnic origin were applied. This method calculates normal hydration status, in other words, the expected normal values for ECW and ICW that would result with healthy kidney function (normohydrated lean and adipose tissue). Because normal ECW or ICW can be determined for a given weight and body composition,Citation8 fluid overload can be calculated from the difference between the normal ECW expected and measured ECW.
Statistics
Kappa statistic (K) is a measure of agreement between two sources, which is measured on a binary scale (i.e., condition present/absent). K statistic can take values between 0 and 1: poor agreement: K < 0.20, fair agreement: 0.2.0–0.3.9, moderate agreement: 0.40–0.59, substantial: 0.60–0.79, very good agreement: 0.80–1.00.Citation9
Results
Fifty-eight hyponatremia-diagnosed patients, 32 (55.2%) of male with the mean age of 65.2 ± 11 (40–89) years were included. Mean serum Na levels were 126.2 ± 6 (110–135), K: 4.2 ± 0.9 (2.6–6.9), Cl: 93.9 ± 8.6 (77–110) meq/L, and hemoglobin (Hb) 10.85 ± 1.60 (7–14.7) g/dL.
Echocardiographic measurements: ejection fraction 49.9 ± 13.6%, LVEDD 5.15 ± 0.61, LVESD 3.40 ± 0.72, left atrium diameter 4.27 ± 0.55, aortic diameter 2.69 ± 0.54, IVS 1.23 ± 0.23, posterior wall thickness (PWT) 1.15 ± 0.15 cm, and systolic pulmonary arterial pressures were 38.13 ± 11.02 mmHg.
Bioimpedance measurements: overhydration (OH) 1.22 ± 4.23, TBW 33.11 ± 8.33, ECW: 16.42 ± 4.08, ICW: 16.70 ± 5.92 L; and fat tissue index was 17.23 ± 6.60 kg/m2, lean tissue mass 29.93 ± 10.19, and adipose tissue mass 43.14 ± 14.40 kg ().
Table 1. Clinical, laboratory, echocardiographic, and bioimpedance measurements of all patients.
In the hypervolemic group, mean Hb levels 10.60 ± 1.59 were decreased compared with the hypovolemic group 11.35 ± 1.55 g/dL (p > 0.05). In the hypervolemic group, IVS and PWT were 1.28 ± 0.26 and 1.17 ± 0.18, higher than 1.15 ± 0.11 and 1.13 ± 0.08 cm in the hypovolemic group (p > 0.05) ().
Table 2. Laboratory and echocardiographic measurements of hypervolemic and hypovolemic groups.
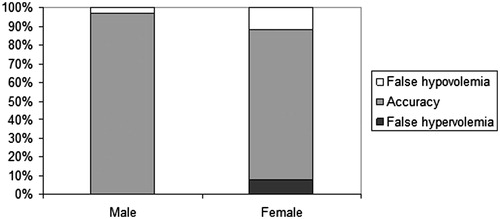
Kappa statistic (K) was very good (K = 0.925) for male (p < 0.00), substantial agreement (K = 0.601) for female (p < 0.002) with the use of BIS for the differential diagnosis of either hypo or hypervolemia in hyponatremic patients compared with gold standard tests which were the combination of echocardiography, serum and urine osmolality biochemical tests, and physical examination ().
Figure 1. Accuracy of bioimpedance measurement for the differential diagnosis of hyponatremia.
Discussion
Hyponatremia management needs comprehensive clinical assessment, history of previous diseases, risk factors, such as drugs, physical examination (signs of hyper and hypovolemia), and laboratory tests such as plasma and urine osmolality, radiological techniques chest X-ray, echocardiography, and invasive techniques central venous pressure tests.Citation10
Hyponatremia etiologies vary from hypovolemia to hypervolemia but the most commonly encountered dysnatremia in hospitalized patients is euvolemic hyponatremia. Diagnosis of euvolemic hyponatremia is not simple and needs complicated laboratory and radiodiagnostic and invasive methods in addition to physical examination. In the present study, we investigated the usefulness of bioimpedance in the differential diagnosis of hyponatremia when compared with standard techniques and echocardiography.
In the present study, Hb levels were lower in the hypervolemic group indicating that hemodilution, echocardiographically IVS, and PWT were increased showing hypervolemia but statistical differences are not significant. It may be thought to be due to a less number of study cases.
Bioimpedance analysis (BIA) technology was first used by Hoffer et al. in 1969 for the measurement of TBW.Citation11 Luskaski proposed it for the nutritional assessment in 1985.Citation12 It has been used for body water and dry weight monitorization, urea distribution volume, and nutritional assessment since 1990.Citation13–18
The analysis of body composition gained much more interest with the use of non-invasive practical method of bioimpedance. We have previously published studies about this method. Bioimpedance used for the detection of hypervolemia in hemodialysis and peritoneal dialysis patientsCitation19,Citation20 and could be used for the fluid management.Citation21 Since bioimpedance is a non-invasive and practical method, it may be easy to be used also in large-scale population studies.Citation22 Extracellular water measurements may be affected by various factors like body position and gravity, we must be careful while using the bioimpedance method.Citation23,Citation24
In the present study, the volume status was determined by the combination of physical examination, laboratory tests of complete blood count, electrolytes, urea, creatinine, serum and urine osmolalities, and echocardiography methods. Bioimpedance results of volume indices were compared with these by using kappa statistics. Fifty-eight hyponatremic patients of male predominance with the mean 65 years were studied. Both gender showed good results but male were better with bioimpedance measurements in differential diagnosis of hyponatremia. Gender difference may be due to differences of body composition of female and must be studied in further studies.
Kim et al. reported 30 patients with hyponatremia comparing bioimpedance with physical examination. Cohen’s kappa analysis showed a significant agreement between physical examination and bioimpedance spectroscopy. In addition, bioimpedance spectroscopy showed a higher level of agreement with clinical body fluid estimation than physical examination.Citation25
In our study, we classified hyponatremias in two as hypovolemia and hypervolemia since euvolemic hyponatremia in fact was true hypervolemia. Kappa statistics (K) were very good for male, substantial agreement for female with the use of BIS for the differential diagnosis of either hypo or hypervolemia in hyponatremic patients compared with gold standard tests which were the combination of echocardiography, serum and urine osmolality biochemical tests, and physical examination.
Limitations: isotope dilution methods were not used for body fluid volumes. This is the first report of BIS application for estimating body fluid volume when compared with standard clinical, biochemical tests, and echocardiography in hyponatremia differential diagnosis.
In conclusion, we suggest that BIS can be used instead of time-consuming estimation of body fluid status in hyponatremia, as a non-invasive practical and an inexpensive method for estimating body fluid status in hyponatremia.
Declaration of interest
The authors report no conflicts of interest. The authors alone are responsible for the content and writing of the paper.
References
- Elhassan EA, Schrier RW. Disorders of extracellular volume. In: Floege J, Johnson RJ, Feehally J, eds. Comprehensive Clinical Nephrology. 4th ed. St. Louis: Elsevier Saunders; 2010:85–99
- Upadhyay A, Jaber BL, Madias NE. Incidence and prevalence of hyponatremia. Am J Med. 2006;119(7 Suppl. 1):S30–S35
- Forster HP, Emanuel E, Grady C. The 2000 revision of the Declaration of Helsinki: A step forward or more confusion? Lancet. 2001;358(9291):1449–1453
- Schiller NB, Shah PM, Crawford M, et al. Recommendations for quantification of left ventricle by two-dimensional echocardiography. American Society of Echocardiography Committee on Standards, Subcommittee on Quatification of Two-Dimensional Echocardiograms. J Am Soc Echocardiogr. 1989;2:358–367
- Feigenbaum H, Armstrong WF, Ryan T. Evaluation of systolic and diastolic function of the left ventricle. In: Feigenbaum H, ed. Feigenbaum’s Echocardiography. 6th ed. Hagerstown, USA: Lippincott Williams and Wilkins; 2005:142–145
- Moissl UM, Wabel P, Chamney PW, et al. Body fluid volume determination via body composition spectroscopy in health and disease. Physiol Meas. 2006;27(9):921–933
- Wabel P, Chamney P, Moissl U, Jirka T. Importance of whole-body bioimpedance spectroscopy for the management of fluid balance. Blood Purif. 2009;27(1):75–80
- Chamney PW, Wabel P, Moissl UM, et al. A whole-body model to distinguish excess fluid from the hydration of major body tissues. Am J Clin Nutr. 2007;85(1):80–89
- Cohen J. A coefficient of agreement for nominal scales. Educ Psychol Meas. 1960;20:37–46
- Goh KP. Management of hyponatremia. Am Fam Physician. 2004;69(10):2387–2394
- Hoffer EC, Meador CK, Simpson DC. Correlation of whole-body impedance with total body water volume. J Appl Physiol. 1969;27:531–534
- Lukaski HC, Johnson PE, Bolonchuk WW, Lykken GI. Assessment of fat-free mass using bioelectrical impedance measurements of the human body. Am J Clin Nutr. 1985;41:810–817
- Spiegel DM, Bashir K, Fisch B. Bioimpedance resistance ratios for the evaluation of dry weight in hemodialysis. Clin Nephrol. 2000;53:108–114
- Zhu F, Kuhlmann MK, Sarkar S, et al. Adjustment of dry weight in hemodialysis patients using intradialytic continuous multifrequency bioimpedance of the calf. Int J Artif Organs. 2004;27:104–109
- Chamney PW, Kramer M, Rode C, Kleinekofort W, Wizemann V. A new technique for establishing dry weight in hemodialysis patients via whole body bio-impedance. Kidney Int. 2002;61:2250–2258
- Chertow GM, Lazarus JM, Lew NL, Ma L, Lowrie EG. Development of a population specific regression equation to estimate total body water in hemodialysis patients. Kidney Int. 1997;51:1578–1582
- Chertow GM, Lowrie EG, Wilmore DW, et al. Nutritional assessment with bioelectrical impe-dance analysis in maintenance hemodialysis patients. J Am Soc Nephrol. 1995;6:75–81
- Ikizler TA, Wingard RL, Harvell J, Shyr Y, Hakum RM. Association of morbidity with markers of nutrition and inflammation in chronic hemodialysis patients: A prospective study. Kidney Int. 1999;55:1945–1951
- Hur E, Yildiz G, Budak Kose S, et al. Bioimpedance and echocardiography used interchangeably in volume comparison of dialysis patients. Hippokratia. 2012;16(4):329–334
- Hur E, Gungor O, Musayev O, et al. Bioimpedance spectroscopy for the detection of hypervolemia in peritoneal dialysis patients. Adv Perit Dial. 2011;27:65–70
- Hur E, Usta M, Toz H, et al. Effect of fluid management guided by bioimpedance spectroscopy on cardiovascular parameters in hemodialysis patients: A randomized controlled trial. Am J Kidney Dis. 2013;61(6):957–965
- Hür E, Özişik M, Ural C, et al. Hypervolemia for hypertension pathophysiology: A population-based study. Biomed Res Int. 2014;2014:895401
- Sipahi S, Hur E, Demirtas S, et al. Body composition monitor measurement technique for the detection of volume status in peritoneal dialysis patients: The effect of abdominal fullness. Int Urol Nephrol. 2011;43(4):1195–1199
- Kose SB, Hür E, Taskin H, Bicak S, Duman S. Volume status effected by gravity and body fluid shifts: New protocol for bioimpedance measurements. Ren Fail. 2014;36(10):1587–1588
- Kim JS, Lee JY, Park H, Han BG, Choi SO, Yang JW. Estimation of body fluid volume by bioimpedance spectroscopy in patients with hyponatremia. Yonsei Med J. 2014;55(2):482–486