
Abstract
We have previously reported that interhemispheric regulation of medial prefrontal cortex (PFC)-mediated stress responses is subserved by glutamate (GLU)- containing callosal neurons. Evidence of chronic stress-induced dendritic and spine atrophy among PFC pyramidal neurons led us to examine how chronic restraint stress (CRS) might alter the apical dendritic morphology of callosal neurons and the acute GLU stress responses in the left versus right PFC. Morphometric analyses of retrogradely labeled, dye-filled PFC callosal neurons revealed hemisphere-specific CRS-induced dendritic retraction; whereas significant dendritic atrophy occurred primarily within the distal arbor of left PFC neurons, it was observed within both the proximal and distal arbor of right PFC neurons. Overall, CRS also significantly reduced spine densities in both hemispheres with the greatest loss occurring among left PFC neurons, mostly at the distal extent of the arbor. While much of the overall decrease in dendritic spine density was accounted by the loss of thin spines, the density of mushroom-shaped spines, despite being fewer in number, was halved. Using microdialysis we found that, compared to controls, basal PFC GLU levels were significantly reduced in both hemispheres of CRS animals and that their GLU response to 30 min of tail-pinch stress was significantly prolonged in the left, but not the right PFC. Together, these findings show that a history of chronic stress alters the dendritic morphology and spine density of PFC callosal neurons and suggest a mechanism by which this might disrupt the interhemispheric regulation of PFC-mediated responses to subsequent stressors.
Introduction
Exposure to stressors is a risk factor for several psychiatric disorders (McEwen, Citation2004) and while the mechanisms mediating the development of maladaptive stress responses remain to be fully elucidated, those that implicate the medial prefrontal cortex (PFC) are thought to be crucial. In keeping with its role in higher order emotional processing, the PFC regulates several important responses to stressors. Moreover, increasing evidence indicates that the left and right PFC regulate different aspects of the behavioral, neuroendocrine, and autonomic responses to stressors (see Gratton & Sullivan, Citation2005 for review). Hemispheric biases in PFC-mediated stress responses have been shown to depend on the severity, duration and controllability of the stressor (Berridge et al., Citation1999; Carlson et al., Citation1991, Citation1993; Stalnaker et al., Citation2009; Sullivan & Szechtman, Citation1995). The implication here is that, in mounting appropriate responses to stressors, the right and left PFC must somehow communicate with each other. Such interhemispheric exchange of stress-relevant information involves callosal neurons, a class of glutamate (GLU)-containing pyramidal neurons that send homotopic projections to the contralateral PFC (Carr & Sesack, Citation2000; Ferino et al., Citation1987). We have previously reported that stressors increase PFC levels of GLU primarily as a result of activating callosal neurons located in the opposite hemisphere (Lupinsky et al., Citation2010). These findings indicate that PFC callosal neurons and their afferentation play an important role in the hemispheric specialization of PFC-mediated responses to stressors. They also suggest that disruption of the normal interhemispheric regulation of PFC-mediated stress function might underlie the development of maladaptive responses to stressors. This idea led us to examine the possibility that this might occur as a consequence of chronic exposure to stressors.
Several studies have documented lasting morphological changes to the apical dendrites of PFC pyramidal neurons of animals repeatedly subjected to a prolonged stressor; these include dendritic retraction, impoverished dendritic branching and reduced spine densities (Cook & Wellman, Citation2004; Radley et al., Citation2004, Citation2006). Chronic stress-induced morphological changes to pyramidal neurons have been observed in several subregions of the PFC, including the prelimbic (PL)- and infralimbic (IL)-PFC where increases in GLU levels are observed in response to an acute stressor (Bagley & Moghaddam, Citation1997; Lupinsky et al., Citation2010; Steciuk et al., Citation2000). It cannot be assumed, however, that such morphological changes also occur in PFC callosal neurons given evidence that these effects of chronic stressors differ in a circuit-specific manner (Radley et al., Citation2006) and that some IL-PFC pyramidal neurons are unaffected by chronic stress (Shansky et al., Citation2009). Thus the main objective of the present study was to determine how the dendritic morphology of identified PFC callosal neurons is altered in animals that had been subjected to a regimen of chronic restraint stress (CRS). Of interest here is how CRS would alter the dendritic morphology of callosal neurons in the left and right PFC. We also explored the possibility that a history of chronic stress has functional consequences by examining whether CRS would alter the acute PFC GLU response to a heterotypic stressor. We have previously reported evidence that stress-induced activation of PFC callosal neurons elicits comparable acute GLU responses in the left and right hemispheres (Lupinsky et al., Citation2010). Thus, the question of interest here is whether CRS would result in a hemispheric bias of the acute PFC GLU stress response.
Materials and methods
CRS regimen
Adult male long-Evans rats (300 g; Charles River, St-Constant, QC, Canada) were singly housed in a dedicated temperature-controlled room (22–24°C) on a 12-h light/dark cycle (lights on at 09:00 am) with free access to food and water. All procedures were approved by McGill University’s Animal Care Committee in accordance with the guidelines of the Canadian Council on Animal Care. The animals were acclimatized to the facility for 5–7 days before being randomly assigned to either the experimental (CRS) or control (no CRS) group. All rats were briefly handled and weighed on each of 3 habituation days. On each of the subsequent 21 days, animals were first weighed and then either subjected to 6 h (10:00–16:00) of restraint stress (CRS group) or simply returned to their home cage (controls). The CRS procedure was conducted in a separate room and consisted of placing each animal in a commercial restrainer while in its home cage. The Plexiglas restrainers could accomodate rats of up to 500 g and comprised a semi-cylindrical housing (max height: 8.6 cm, length: 21.6 cm; Braintree Scientific Inc., Braintree, MA) affixed to a base plate; body heat was dissipated through several slits cut into the semi-cylindrical housing and any urine was drained through an opening cut into base plate. Control animals were treated in the same manner without being subjected to CRS.
Blood samples were collected from a subset of 10 CRS animals for the purpose of measuring plasma corticosterone (CORT) levels. Four 100 µl samples of tail blood were taken from these animals on each of CRS days 1, 10 and 21: at 10:00 h (baseline), 11:00 h, 13:00 h and 16:00 h. The samples were taken immediately upon inserting the animals in the restrainer (0 h; baseline) and at 1, 3 and 6 h into the period of restraint. CORT concentrations were determined from plasma samples (5 µl) using a rat-specific radioimmunoassay kit (MP Biomedicals, Orangeburg, NY); the limit of detection and the total binding percentage for the CORT assay were 0.3125 μg/dl and 49.7%, respectively.
Morphometric study
Retrograde labeling
Animals assigned to the CRS and control groups were anesthetized (isoflurane; 5–4% for induction and 3–2% for maintenance) and microinjected under stereotaxic guidance with a fluorescent microbead tracer solution (FluoSpheres carboxylate-modified, 0.04 μm, 580/605; Molecular Probes, Eugene, OR) into either the right or the left PFC at the following flat skull coordinates (Paxinos & Watson, Citation1996): anteroposterior (AP) +3 mm, mediolateral (ML) ±0.5 mm, dorsoventral (DV) −4.2 mm below brain surface. A 200 nl volume of retrograde tracer was deposited into the target site at a rate of ∼50 nl/min using a 0.5 -μl Hamilton Neuros Syringe; the injector was left undisturbed for an additional 5 min to allow for diffusion of the tracer. The bore hole was sealed with bone wax, the incision was closed with monofilament sutures, and antibiotic gel (BNP Ointment; bacitracin zinc: 400 IU, neomycin sulfate: 5 mg, polymyxin B sulfate: 5000 IU) was applied to the wound. Carprofen (5 mg/kg, s.c.) was injected subcutaneously as a postoperative analgesic. Animals were allowed to recover for 6 days before the start of the 3-day habituation period. Once retrogradely transported to the cell body, the microbead tracer has been shown to persist for at least 10 weeks in vivo and 1 year after fixation (Katz et al., Citation1984).
Tissue preparation
Twenty-four hours following the end of the CRS regimen, animals from both groups were deeply anesthetized and perfused transcardially with a vascular rinse (0.9% saline), followed by 4% paraformaldehyde (PFA) in 0.1 M phosphate buffered saline (PBS; pH 7.4). After perfusion, the brains were carefully removed and postfixed for 24 h in a 4% PFA 0.1 M PBS solution after which the brains were stored in 0.1 M PBS. Each brain's anterior most portion containing the PFC was blocked and the hemisphere injected with tracer was marked with a small knick. A vibrotome (VT1200 S, Leica) was used to produce four 250 µm coronal sections per animal which were stored in wells containing 0.01% sodium azide in 0.1 M PBS.
Intracellular Lucifer Yellow (LY) injections
The coronal sections were placed in an iontophoretic chamber filled with 0.1 M PBS and a fluorescence microscope (Eclipse E600FN, Nikon, Tokyo, Japan) was used to identify suitable retrogradely labeled located in layers 2/3 of the PL- and IL-PFC; that is, clearly retrogradely labeled neurons that were sufficiently isolated as to avoid the complications of having the dendritic arbor overlap too extensively with those of neighboring neurons. In some slices as many as 10 such retrogradely labeled neurons were found but in others only a few were found to be suitable. A pulled single barrel glass capillary (outer diameter: 50–200 nm, ∼130 MΩ) back-loaded with a 1% LY solution (dilithium salt, Sigma-Aldrich, St. Louis, MO) was used to iontophoretically inject identified neurons; the LY solution was ejected from the micropipette tip by applying a 1–2 nA direct current until the fluorescent tips of the neuron's distal dendrites could be clearly visualized (approx. 8–10 min). Thus, for each animal, a total of approximately 15 neurons from 2 to 4 PFC slices were injected with LY.
Immunocytochemistry
LY-loaded neurons were visualized for morphometric analysis using the immunocytochemical staining procedure of Bories et al. (Citation2013). Following the intracellular LY injections, the tissue slices were repeatedly washed in 0.1 M phosphate buffer (PB) and left to incubate overnight in a solution of 0.1 M PB, 0.1% Triton and 5% sucrose. After washing on the following day, slices were incubated in a quenching solution (0.1 M PB, 0.1% Triton and 0.3% H2O2) for 2 h at room temperature followed by a 2-h incubation in a preblocking solution (0.1 M PB, 0.1% Triton, 10% normal goat serum at room temperature; NGS, Vector Laboratories, Burlingame, CA) and then by an overnight incubation in a 4°C 0.1 M PB, 0.1% Triton and 5% NGS solution containing a rabbit anti-LY primary antibody (1:10,000; Molecular Probes). The slices were subsequently washed and incubated for 2 h at room temperature in a 0.1-M PB solution containing a biotinylated goat anti-rabbit IgG antibody (1:500, Vector Laboratories). Freshly prepared reagent (Vectastain ABC Elite kit, Vector Laboratories) was applied to the slices for 90 min at room temperature. After washing, the slices were allowed to react with the 3,3′-diaminobenzidine (DAB) substrate (DAB Peroxidase Substrate Kit, Vector Laboratories) until the desired staining was obtained (approx. 2 min) and then were mounted on gelatin subbed slides and allowed to dry overnight. In order to visualize the cortical cell layers, the mounted sections were lightly stained for Nissl bodies with cresyl violet, dehydrated (alcohol and xylene) and cover slipped with Permount (Fisher Scientific, Fair Lawn, NJ).
Dendritic reconstructions
The 140 neurons included in the present study were reconstructed by an experimenter blind to the treatment conditions (CRS vs. unstressed control; left vs. right PFC). The reconstructions were performed at 100× magnification (NA 1.40) with an oil immersion objective (Olympus BX51 light microscope) and their processes analyzed in three dimensions (3D) within single sections using Neurolucida software (Neurolucida v. 8.10.2; MBF Bioscience). For each animal, an average of six labeled callosal neurons with cell bodies in layers II/III of the PL- or IL-PFC were analyzed for dendritic length, volume and branching [control left PFC: n = 33 neurons (n = 5 animals); Control right PFC: n = 35 neurons (n = 6 animals); CRS left PFC: n = 32 neurons (n = 6 animals); CRS right PFC: n = 40 neurons (n = 7 animals)]. To be included in the analysis, the cell bodies were required to be located within layers 2/3 of the PL- or IL-PFC with complete filling of their apical dendritic projections, as evidenced by well-defined endings as described by Radley et al. (Citation2013). That the primary shaft of the apical dendrite typically ran parallel to the section plane increased the probability of conserving an intact apical dendritic tree. The neurons included in the analysis all had intact secondary and tertiary dendritic branches and truncations were permissible only in collateral branches that appeared to be near to the point of termination and thus unlikely to have any additional branches. Cell body size was determined by the area at its largest cross-sectional diameter. The 3D Sholl analysis employs a series of 10 μm concentric circles around the soma allowing for the quantification of the distribution of each parameter within a given radial distance from the cell body. For dendritic length analyses, the data obtained were then summed over 20 μm intervals.
Spine density
In each animal, the density of apical dendritic spines (no. of spines per μm) was determined for 2–3 LY-filled neurons (average n = 3/animal) randomly selected from those used for the dendritic reconstruction (above); this was done by an experimenter blind to the treatment conditions. For each neuron, dendritic spines were counted along the full extent of the apical dendritic arbor (Overall), from primary dendrites up to the maximal 13th branch order including sparsely populated segments, such as the primary apical shaft. This analysis differs from that of most other studies, where spine density is typically determined from selected branches of the dendritic arbor (Bloss et al., Citation2011; Cerqueira et al., Citation2007; Crombag et al., Citation2005; Radley et al., Citation2006, Citation2013; Seib & Wellman, Citation2003; Wallace et al., Citation2006). It is also important to emphasize here that we used brightfield microscopy which, unlike confocal imaging, does not allow spines in the z-axis to be visualized and counted. The spine densities, we report, are lower than those found in studies employing 3D confocal microscopy, however, they are similar to spine densities of PFC pyramidal neurons reported in studies using brightfield microscopy (Cerqueira et al., Citation2007; Crombag et al., Citation2005; Seib & Wellman, Citation2003; Wallace et al., Citation2006). Spines were classified into three categories (mushroom, thin and stubby) based on the relative sizes of the spine head and neck (Peters & Kaiserman-Abramof, Citation1970). Mushroom spines were identified by their distinctive large head and a narrow neck in contrast to the relatively smaller terminal swelling of thin spines, whereas stubby spines were characterized by the absence of any narrowing between the head and their attachment to the dendritic shaft. For Sholl analyses of spine density and subtype, a radial distance of 150 µm was selected as a boundary separating proximal and distal dendrites; thus the data obtained were summed from 0 to 150 µm and >150 µm, respectively.
Data format and statistical analysis
CORT data are expressed as means (±SEM). The effects of CRS on CORT levels were tested for significance with a two-way repeated measures analysis of variance (ANOVA), with both time in restrainer and day of CRS as within group factors. Post hoc comparisons were made using a Bonferroni correction (α = 0.00833 for time; α = 0.0167 for day). Group differences in body weight were tested for significance with a two-way mixed-design ANOVA, with day as a within group factor.
The morphometric data obtained from each animal were averaged and the group data were expressed as the mean of animals (±SEM); thus the unit of analysis for group comparisons was the within-animal averages of neurons studied. Also, hemisphere was treated as a between-groups factor since only one hemisphere per animal could be studied, the retrograde tracer being injected in opposite hemisphere. The (unpaired) two-tailed Student's t-test (α = 0.05) was used to assess the reliability of group differences (CRS vs. controls; right vs. left PFC) in cell body size and in total dendritic length, volume, number of branches overall spine density and overall spine subtype. A 3D version of the Sholl analysis was utilized to investigate group differences (CRS vs. unstressed controls) in the spatial distribution of apical dendritic projections and spine density. Group differences were tested for significance with a two-way mixed-design ANOVA, with radial distance from the soma as a within group factor. When appropriate (p < 0.05), planned comparisons were conducted using F tests.
Microdialysis study
Surgery
Separate groups of animals were prepared to study the effects of CRS on the left and right PFC GLU responses to an acute stressor. Half of the animals were subjected to the same CRS regimen described above while the remaining animals served as unstressed controls. Within 2 days after the CRS regimen, animals of both groups were implanted under inhalation anesthesia with a 22 gauge stainless steel guide cannula (Plastics One, Roanoke, VA) angled at 3° off the vertical AP plane into either the left or right PFC at the following flat skull coordinates (Paxinos & Watson, Citation1996): AP 3.2 mm anterior to Bregma, ML ± 0.7 mm from midline, DV 2.2 mm below the brain surface. The cannula would serve to insert the microdialysis probe into the PFC. The cannula was anchored with acrylic dental cement to three screws threaded into the cranium. An obturator extending 3.0 mm past the tip of the guide cannula was inserted to prevent infection, blockage, and cerebrospinal fluid (CSF) seepage. The incision was treated with antibiotic ointment (BNP Ointment; bacitracin zinc: 400 IU, neomycin sulfate: 5 mg, polymyxin B sulfate: 5000 IU) to prevent infection. Carprofen (5 mg/kg, s.c.) was injected subcutaneously as a postoperative analgesic. Animals were allowed to recover for 2–3 days before testing. Because of technical constraints, the GLU stress response was studied at a later post-CRS time than was the dendritic morphology of callosal neurons (4–5 days vs. 1 day). However, previous evidence shows that the effects of a 21-day CRS regimen on PFC pyramidal neurons persist beyond 4–5 days (Goldwater et al., Citation2009).
Microdialysis probes
I-shaped microdialysis probes comprised side-by-side fused silica inlet–outlet lines (internal diameter [ID]: 50 μm] that were encased in polyethylene tubing (ID: 0.58–0.38 mm) were used. A regenerated, hollow, cellulose membrane (Spectrum, molecular weight cut-off: 13 kDa, OD: 216 μm; ID: 200 μm) was secured to the end of a 26-gauge stainless steel cannula using cyanoacrylate adhesive and was sealed at its tip with epoxy; the active cellulose membrane measured 2.5 mm. The probes were fitted with a stainless steel collar that provided a secure threaded connection to the animals’ indwelling guide cannula. The probe assembly was attached to a stainless steel spring that was connected to a liquid swivel (CMA Microdialysis). Computer-controlled microinfusion pumps (CMA Microdialysis) were used to pump perfusate through the probes. Finally, dialysate was collected from the fused silica outlet line (dead-volume: 0.79 μl).
Testing procedure
Animals were tested in circular opaque 30 cm diameter chamber. The compartment contained 3 cm of bedding and the animals had ad libitum access to food and water. Before the test day, animals were habituated to the chamber for 4 h. On the day of testing, a microdialysis probe was inserted into the animal’s implanted guide cannula and perfused with sterile, artificial cerebrospinal fluid (aCSF) (26 mM NaHCO3, 3 mM NaH2PO4, 1.3 mM MgCl2, 2.3 mM CaCl2, 3.0 mM KCl, 126 mM NaCl, 0.2 mM l-ascorbic acid) at an initial rate of 0.5 μl/min increasing to a final rate of 1.5 μl/min during the 3-h stabilization period. Dialysate samples were collected once the perfusion rate of aCSF reached 1.5 μl/min but were discarded; this was done to habituate the animals to the dialysate collection process and the presence of the experimenter. Samples were collected at 15 min intervals for 60 min before (baseline), during and for 30 min after a 30-min exposure to tail-pinch stress. In our previous studies, this mild stressor reliably stimulated robust increases in extracellular PFC dopamine and GLU levels (Brake et al., Citation2000; Lupinsky et al., Citation2010; Stevenson et al., Citation2003). The 20 μl dialysate samples were collected in fraction vials that were preloaded with 1 μl of 0.25 M perchloric acid to prevent analyte degradation and then immediately stored at −20°C. The tail-pinch stressor differed slightly from the metallic clip used in our previous study (Lupinsky et al., Citation2010). Here, it consisted in securing a plastic clothespin 2 cm from the base of the animal’s tail. Animals responded to this with the usual vocalization, defecation and freezing behavior but also with bouts of gnawing on the clothespin; in the event that animals succeeded in removing the clothespin it was replaced with a new one. This minor modification is potentially significant in light of evidence that the PFC is asymmetrically activated by inescapable stressors when animals are allowed to engage in displacement or “coping” behaviors, such as chewing on inedible object (Stalnaker et al., Citation2009).
Analysis of dialysate GLU levels
GLU levels were determined by precolumn derivatization using high pressure liquid chromatography (HPLC) with fluorescence detection. The chromatographic system was composed of a pump (ESA Inc., Sunnyvale, CA, model 582) and an injector (ESA Inc., model 542) connected to an Xterra MS C18 3.0 mm × 50 mm, 5 μm analytical column (Waters Corp., Milford, MA). The mobile phase consisted of 3.5% acetonitrile, 15% methanol, and 100 mM sodium phosphate dibasic (Na2HPO4) and was adjusted to a pH of 6.7 with 85% phosphoric acid. The flow rate was set at 0.5 ml/min, and the photodetector (UltiMate 300 Fluorescence Detector, Dionex, Sunnyvale, CA) was set to an excitation frequency of 350 nm and to an emission frequency of 420 nm.
Working standards (100 ng/ml) and derivatization reagents were prepared fresh daily from stock solutions and loaded with the dialysate samples into a refrigerated (10°C) autosampler (ESA Inc., model 542). Before each fraction was injected onto the analytical column, they were sequentially mixed with 20 μl of o-phthaldehyde (0.0143 mol/l) diluted with 0.1 M sodium tetraborate and 20 μl of 3-mercaptopropionic acid (0.071 mol/l) diluted with H2O and left to react for 5 min. After each injection, the injection loop was flushed with 20% methanol to prevent contamination of subsequent samples. Under these conditions, the retention time for GLU is ∼1.06 min. The total run time was 24 min per sample. Chromatographic peak analysis was performed by identifying unknown peaks in a sample according to retention times from known standards using ESA Inc.'s CoulArray software (Version 3.10).
A perennial question is whether extracellular GLU efflux originates from neurons or glial cells. We have previously shown that PFC GLU stress responses are sodium and calcium dependant (Lupinsky et al., Citation2010); these were abolished by local sodium channel blockade with tetrodotoxin or when perfusate Ca2+ was omitted. Furthermore, PFC GLU stress responses were unaffected by glial cystine–GLU transporter blockade with (S)-4-carboxyphenylglycine. Thus, based on these observations, we conclude that stress-induced increases in PFC GLU are due mostly to increased neuronal release of the transmitter.
Histology
Animals were deeply anesthetized, decapitated and the brains extracted and frozen by submersion in 2-methylbutane for 5 s. The brains were then stored at −80°C before being sliced. Microdialysis probe tip placements were confirmed from 35 μm cresyl violet-stained coronal sections.
Data format and analyses
The microdialysis data are expressed as mean percent changes in GLU levels (±SEM) relative to the combined averages of the four baseline samples collected during the 60 min that preceded tail-pinch stress. The data were not corrected for the probe’s in vitro recovery. Outlier values with z-scores exceeding 2 SD were excluded from the analysis. Missing or outlier values were estimated using the Cochran and Cox (Citation1957) approximation. The degrees of freedom were corrected in the statistical analyses that included these estimated values. The (unpaired) two-tailed Student's t-test was used to assess group differences in basal GLU levels. The effects of CRS on the GLU response to tail-pinch stress were tested for significance with a mixed-design ANOVA with time as a within-group factor and treatment and hemisphere as between-group factors. Post hoc comparisons were made using a simple effects analysis (α = 0.05).
Results
Plasma CORT levels
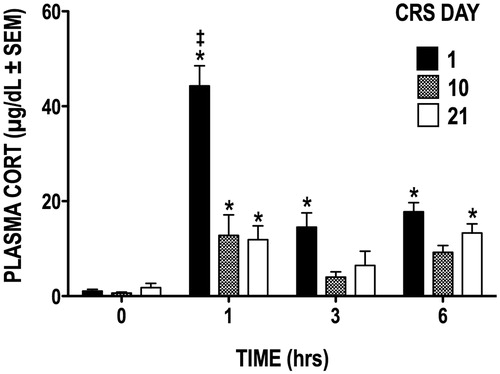
The acute plasma CORT response to 6 h of restraint was measured when animals were naïve to the stressor (day 1) as well as mid-way through (day 10) and at the end (day 21) of the CRS regimen. shows that the robust increase in plasma CORT on day 1 is dampened by the 10th day of CRS and that this apparent habituation persists until the 21st and last day of CRS. While restraint caused plasma CORT levels to increase significantly above baseline (hour 0) on all three CRS days (F(3, 27) = 42.97, p < .0001), the strongest CORT response was elicited during CRS day 1; CORT levels were highest during the first hour and remained significantly elevated throughout the 6-h period of restraint stress (p ≤ 0.05 for hours 1–6). A comparison of the CORT responses on day 1 versus days 10 and 21 revealed a significant CRS by day interaction (F(6, 54) = 11.38, p < 0.0001), indicating that the CORT response was attenuated by day 10. While CORT levels at hour 1 increased significantly above baseline on CRS days 10 and 21, post hoc analyses revealed that they remained nonetheless significantly lower than those seen on day 1 (both p ≤ 0.05). As expected, CRS animals gained significantly less weight than control animals over the course of 21 days (group × time interaction, F(20, 1000) = 49.59, p < 0.0001); by the last day of the CRS regimen, these animals had gained 46% less weight than control animals.
Figure 1. Plasma CORT levels during the CRS regimen. Restraint stress caused plasma CORT concentration to significantly increase from basal levels (hour 0) on days 1, 10, and 21 of CRS. *p < 0.05 versus basal levels at hour 0; ‡p < 0.05 versus days 10 and 21.
Retrograde tracer injections
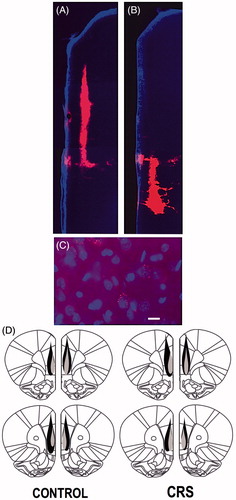
Only animals with confirmed microbead tracer injections within the PL- and IL-PFC were included in the morphometric analysis (control left PFC: n = 5 animals; control right PFC: n = 6; CRS left PFC: n = 6; CRS right PFC: n = 7). The maximum spread of the microbead tracer deposit was found in several animals to extend dorsally into the anterior cingulate cortex, but in none of the animals did the tracer spread to the opposite hemisphere (). The tracer injections resulted in retrograde labeling of numerous neurons throughout layers II–V of the contralateral PL- and IL-PFC.
Figure 2. (A–D) Retrograde microbead tracer injections in the PL- and IL-PFC. (A and B) Fluorescence photomicrographs of microbead tracer deposits within the PL-PFC (A) and IL-PFC (B) of the same animal. (C) Digital image showing examples of DAPI-stained IL-PFC cell bodies (blue) retrogradely labeled with red microbead tracer. Scale bar = 20 µm. (D) Schematic reconstruction of the maximum (black) and minimum (shaded) spread of microbead tracer injections within the PFC of control and CRS animals.
Morphometric analyses of PFC callosal neurons
Dendritic arbor
Control animals
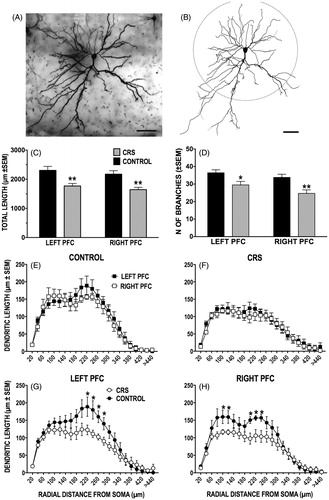
We first compared the morphology of labeled left versus right PFC neurons in unstressed control animals and found no significant inherent hemispheric differences in total dendritic length (t(9) = 0.707, p = 0.5; ), number of dendritic branches (t(9) = 1.058, p = 0.32; ), dendritic volume (t(9) = −0.222, p = 0.83; not shown) or cell body size (t(9) = −0.031; p = 0.98; not shown). A 3D Sholl analysis showed that the density of the apical dendritic arbor varies as a function of increasing radial distances from the soma (). While labeled left and right PFC neurons did not differ significantly on this measure [no effect of hemisphere (F(1, 9) = 0.6792, p = 0.4312) or of distance from soma (F(22,198) = 0.5051, p = 0.9694)], it is noteworthy that the peak dendritic densities of left PFC neurons were skewed toward the more distal (200–280 µm from soma) aspects of the arbor whereas those of right PFC neurons were evenly distributed between the arbor's proximal (80–120 µm) and distal (200–260 µm) extents.
Figure 3. (A–H) Effect of CRS on apical dendritic morphology of callosal neurons. (A and B) Photomicrograph of LY-filled callosal neuron in layer II/III of IL-PFC (A) and resulting computer-assisted morphometric reconstruction (B). Scale bars = 50 μm. The apical dendritic tree points downward toward the midline. The dashed circle delineates the 150 μm boundary between the proximal and distal extents of the apical arbor. (C and D) CRS significantly decreased length (C) and branching (D) of apical dendrites in both the left and the right PFC. (E–H) There was no difference in length at any radial distance between left and right callosal neurons in either control (E) or CRS (F) animals. CRS decreased the length of distal dendrites in the left PFC (G), while in the right PFC both proximal and distal dendritic lengths were reduced (H). In this and subsequent figures, *p < 0.05, **p < 0.01, versus unstressed controls.
Effects of CRS
When compared to unstressed controls, labeled neurons in both hemispheres of CRS animals showed significant dendritic retraction. In these animals, the total dendritic length of left and right PFC neurons had decreased by 23% (t(11) = 3.4, p = 0.006) and 24% (t(9) = 3.873, p = 0.004), respectively (). Similarly, the total number of apical branches was reduced in CRS animals by 19% in the left (t(11) = 2.529, p = 0.02801) and 27% in the right hemisphere (t(9) = 3.314, p = 0.009; ). There were significant reductions also in total apical dendritic volume of 29% (t(11) = 4.001, p = 0.00208) and 24% (t(9) = 2.725, p = 0.02342; not shown) in the left and the right PFC, respectively, but no effect on cell body size in either the left (t(11) = 0.992, p = 0.34) or right hemisphere (t(9) = −0.952, p = 0.37; not shown).
The 3D Sholl analyses revealed a significant loss in apical dendritic density the extent of which differed in the left versus right PFC. In left PFC neurons, there was a significant interaction of stress condition (CRS vs. control) and distance from soma on dendritic density (F(22, 242) = 1.831, p = 0.015); subsequent analyses revealed that the greatest dendritic loss (35–38%; p ≤ 0.05) occurred within the densest (220–280 µm) extent of the arbor (). The same analysis of right PFC neurons uncovered a significant main effect of stress (F(1, 9) = 13.22, p = 0.0054) but none of a stress by distance from soma interaction. Based on the analysis of the left PFC Sholl distribution, planned comparisons were conducted on the densest portions of the dendritic arbor of right PFC neurons. This analysis confirmed that CRS significantly (p ≤ 0.05) reduced dendritic densities by 27% and 32–35% within, respectively, the densest proximal (100–120 µm) and distal (200–240 µm) aspects of the arbor (). Finally, the 3D Sholl analysis in shows that, in CRS animals, variations in dendritic density along the apical arbor of left versus right PFC callosal neurons are very similarly distributed (p > 0.05). In effect, it appears that CRS eliminated the subtle hemispheric differences in dendritic density observed in control animals ().
Dendritic spine density
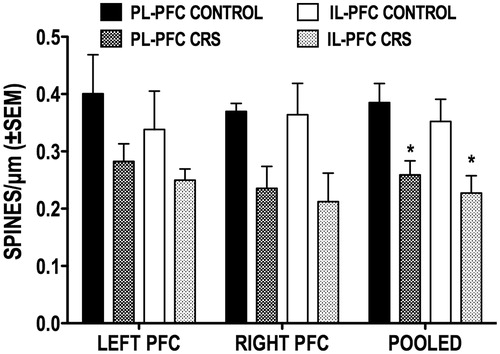
We characterized the effects of CRS on apical dendritic spine density of labeled left versus right PFC callosal neurons. Three (and no fewer than two) of the neurons that had been reconstructed during the morphometric analysis of apical dendrites were randomly chosen in each animal to be included in this part of the study. The data set comprised a total of ∼41,000 dendritic spines from 67 labeled PFC callosal neurons (control left PFC: n = 14 neurons; control right PFC: n = 17; CRS left PFC: n = 17; CRS right PFC: n = 19). We also determined the spine density over the proximal ( < 150 µm from the soma) and distal extents (>150 µm) of the dendritic arbor. These sampling ranges were selected on the basis of previous reports that chronic stress alters mostly the spine density of distal dendrites (Bloss et al., Citation2011; Liu & Aghajanian, Citation2008; Radley et al., Citation2006, Citation2013) as well as on the data reported here indicating hemisphere-dependent effects of CRS on the proximal and distal dendrites of callosal neurons.
Control animals
No significant hemispheric differences in overall spine density were found in control animals (t(9) = −0.222, p = 0.829); this was true also of spine densities within the proximal (<150 µm; t(9) = −0.192, p = 0.8519) and distal (>150 µm; t(9) = −0.188, p = 0.8547) aspects of the dendritic arbor (). While the difference is not significant, it is noteworthy that, in both hemispheres, the spine density of proximal dendrites was higher than that of distal dendrites.
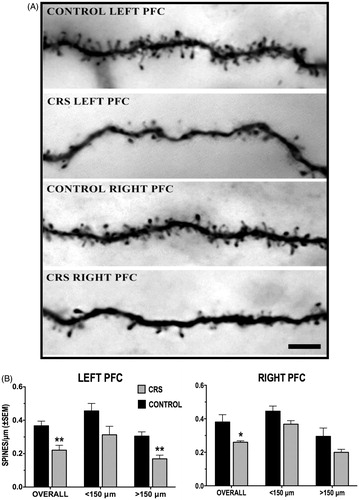
Figure 4. (A and B) Effect of CRS on apical dendritic spine density of callosal neurons. (A) Photomicrographs of dendritic spine density from callosal neurons in the left and right PFC of control and CRS animals. Scale bar = 5 μm. (B) CRS resulted in a significant overall decrease in spine density in both the left and the right PFC. Spine loss was more pronounced in left PFC neurons, particularly within the distal (>150 μm) dendritic arbor.
Effects of CRS
also shows that CRS reduced the overall dendritic spine density by 40% and 31% in the left (t(11) = 3.612, p = 0.004) and the right (t(9) = 2.925, p = 0.017) PFC, respectively. In the left PFC, further analysis revealed a main effect of CRS (F(1, 11) = 8.115, p = 0.016) on the spine densities of proximal and distal dendrites with subsequent comparisons showing a significant (44%) reduction in the spine density of distal dendrites (F(1,11) = 4.065, p = 0.002); a noticeable, but non-significant decrease in the spine density of proximal dendrites was also observed. The same analysis uncovered a main effect of CRS on spine densities of right PFC neurons as well (F(1,9) = 5.631, p = 0.042) but subsequent comparisons indicated that neither of the decreases in spine density on proximal (F(1,9) = 2.147, p = 0.06) and distal (F(1,9) = 1.952, p = 0.083) dendrites was significant.
Branch order analysis
We also analyzed the extent of CRS-induced reductions in overall spine densities in left versus right PFC as a function of branch order (data not shown); this was done in all neurons from the 1st to the 10th order branch and, in some cases, up to the 13th branch order. In control animals, the highest overall spine densities were observed on the 4th and 5th order branches of both left and right PFC callosal neurons with comparable densities across all branch orders. CRS-induced reductions in overall spine densities were observed primarily on the 3rd to the 10th order branches of both left and right PFC callosal neurons; statistically significant (p < 0.05) spine loss occurred on the 4th to the 8th order branches of left PFC neurons and on the 5th to the 8th order branches of right PFC neurons. However, no reliable hemispheric differences emerged from this branch order analysis.
PL- versus IL-PFC callosal neurons
It has been previously reported that chronic stress results in apical dendritic spine loss among randomly selected and amygdala-projecting PL-PFC, but not among IL-PFC pyramidal neurons (Shansky et al., Citation2009). Thus, we also examined whether the effects of CRS on overall dendritic spine densities differed on PL- versus IL-PFC callosal neurons. Of the 67 callosal neurons analyzed for spine density, 36 were located in the PL-PFC and 31 in IL-PFC. shows that, in both hemispheres, CRS resulted in similar reductions in the overall spine densities of PL- and IL-PFC callosal neurons; no statistical analyses were conducted here because the number of animals (and neurons) within each subregion (PL vs. IL) by hemisphere grouping was judged to be too low for meaningful comparisons. However, the same conclusion emerged when the left and right hemisphere data for each subregion were pooled (PL-PFC control n = 10; PL-PFC CRS n = 12; IL-PFC control n = 11; IL-PFC CRS n = 10; 1–3 neurons per animal). The statistical analysis (two-tailed Student's t-test of animal means) of these data confirmed that CRS significantly reduced the overall spine densities of PL- and IL-PFC callosal neurons by a mean 32% (t(20) = 3.128, p = 0.005) and 35% (t(19) = 2.442, p = 0.025), respectively.
Figure 5. Effect of CRS on the overall spine density of callosal neurons located in the PL and IL subregions of the left and right PFC. Also shown are the pooled left and right hemisphere data for each subregion. *p < 0.05 versus corresponding control group.
Dendritic spine subtype density
We also examined the effects of CRS on the density of the thin, mushroom-shaped and stubby subtypes of dendritic spines. The results of this analysis are shown in . First, there were no significant hemispheric differences among control animals in the overall density of either thin, mushroom or stubby spines nor in the density of each spine subtype within the proximal (<150 μm) and distal (>150 μm) domains of the dendritic arbor. Second, while it appears that the density of all three dendritic spine subtypes was reduced to some extent in CRS animals, only among thin and mushroom spines was this effect found to be statistically reliable.
Figure 6. (A–G) Effect of CRS on the density of dendritic spine subtypes. (A) Photomicrograph of a dendritic segment with examples of thin, stubby and mushroom-shaped spines. Scale bar = 5 μm. (B and C) CRS significantly reduced overall density of thin spines in both left (B) and right (C) PFC callosal neurons; this effect was more pronounced in left PFC neurons, particularly on distal ( > 150 μm) dendrites. (D and E) CRS decreased the overall density of mushroom-shaped spines in both hemispheres; significant CRS-induced loss of mushroom-shaped spine was localized to distal dendrites (>150 μm) of left PFC neurons (D) and to the proximal dendrites (<150 μm) of right PFC neurons (E). (F and G) CRS had no significant effect on the density of stubby spines of either left (F) or right (G) PFC neurons.
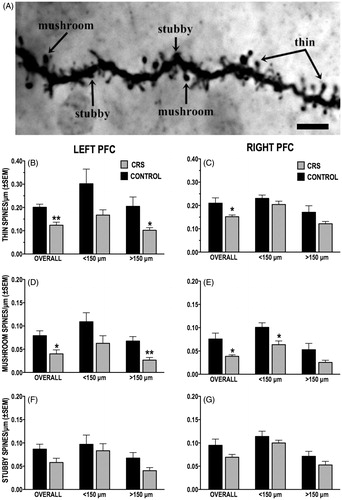
Thin spines
When compared to unstressed controls, CRS animals showed significant 38% (t(11) = 4.096, p = 0.002) and 28% (t(9) = 2.601, p = 0.029) decreases in the overall thin dendritic spine density of, respectively, left and right PFC callosal neurons (). Further analyses revealed a significant main effect of CRS on the thin dendritic spine density of left PFC neurons (F(1,11) = .572, p = 0.038) and subsequent planned comparisons indicated a significant (44%) loss of thin spines on distal (F(1,11) = 2.652, p = 0.022) but not proximal dendrites. In contrast, there was no significant main effect of CRS on the thin spine density of proximal and distal dendrites in right PFC neurons (F(1,9) = 3.109, p = 0.111).
Mushroom-shaped spines
The overall density of mushroom-shaped spines in CRS animals was reduced by half in both left (t(11) = 2.982, p = 0.013) and right (t(9) = 3.001, p = 0.015) PFC neurons (). Further analyses revealed a significant main effect of CRS on the mushroom spine density of left PFC neurons (F(1,11) = 6.351, p = 0.029) and subsequent planned comparisons indicated a significant (61%) loss of mushroom spines on distal (F(1,11) = 3.787, p = 0.003) but not proximal dendrites. There was also a significant main effect of CRS on the mushroom spine density of right PFC neurons (F(1,9) = 8.511, p = 0.017). Subsequent comparisons, however, revealed a significant (51%) loss of mushroom spine density on proximal (F(1,9) = 3.0, p = 0.015) but not distal dendrites.
PFC GLU stress response
Data were obtained from 34 animals with confirmed microdialysis probe placements within the ventral-dorsal extent of either the left (controls: n = 8; CRS: n = 8) or right (controls: n = 9; CRS: n = 9) PL- and IL-PFC (). is a comparison of the basal (prestress) levels of GLU in the left and the right PFC of CRS animals and unstressed controls. In comparison to control animals the basal PFC GLU levels of CRS animals were significantly reduced by 36% in the left hemisphere (t(62) = 2.785, p = 0.007) and by 41% in the right (t(70) = 3.201, p = 0.002). There were no hemispheric differences in the basal GLU levels of either control (t(70) = 1.281, p = 0.204) or CRS animals (t(66) = 0.315, p = 0.753).
Figure 7. (A–F) Basal and stress-induced changes in dialysate levels of GLU in the left and right PFC of control and CRS animals. (A and B) Schematic reconstruction of microdialysis probe (vertical bars) placements within the right and the left PL/IL of control and CRS animals. Length of vertical bars corresponds to the length of the active portion of the microdialysis membrane (2.5 mm). (C) Photomicrograph depicting typical damage produced by PFC microdialysis probe. (D) Basal (prestress) levels of GLU in the left and the right PFC of control and CRS rats. CRS reduced basal GLU levels in both the left and the right PFC. (E and F) Comparison of stress-induced increases in dialysate GLU levels in the right (E) and the left (F) PFC of control and CRS rats. The length of the black bar corresponds to the duration of the tail-pinch (TP) stress episode (30 min). There was a hemispheric difference in the timing of the GLU stress response of unstressed control rats: TP stress elicited an increase in GLU transmission in the right PFC before it did in the left PFC. CRS eliminated this hemispheric difference. In the left PFC, CRS animals had a prolonged GLU stress response compared to controls. CRS did not significantly alter the GLU stress response in the right PFC. **p < 0.01 versus prestress baseline.
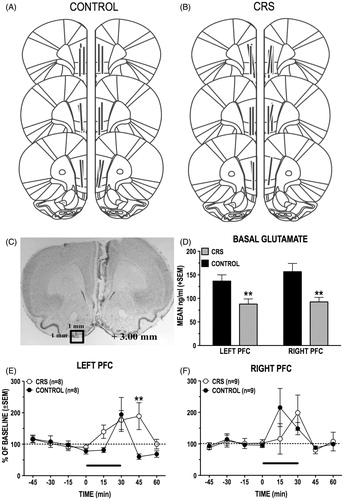
The GLU response of CRS and control animals to a 30-min episode of tail-pinch stress was recorded in the left () and right () PFC. A comparison of the left versus right PFC GLU stress response of control animals revealed a significant hemisphere by time interaction (F(7,100) = 2.35, p = 0.029). Subsequent analyses indicated that, while GLU levels in both the left and right PFC rose significantly above baseline in response to tail-pinch, they did so at different times following onset of the stressor; whereas the peak GLU response occurred 15 min after stress onset in the right PFC, the left PFC GLU response reached peak levels only 30 min after onset of the stressor. The same comparison of the left versus right PFC GLU stress responses in CRS animals uncovered a significant main effect only of time from tail-pinch onset (F(7,103) = 2.76, p = 0.011), indicating that tail-pinch stress elicited in these animals comparable GLU responses in the left and right PFC.
A comparison of the left PFC GLU stress responses of control and CRS animals revealed a significant group by time interaction (F(7, 103) = 2.29, p = 0.033); post hoc analyses confirmed that, 15 min after the stress episode (at 45 min), left PFC GLU levels recorded in CRS animals remained significantly higher than those of control animals (p < 0.001). Although the difference did not reach statistical significance (p = 0.0542), it is noteworthy that left PFC GLU levels of CRS animals increased earlier in response to the stressor (at 15 min) than in control animals. In contrast to the left PFC, the right PFC GLU stress response of CRS animals did not differ from that of control animals (stress group, F(1,13) = 0.15, p = 0.7003).
Finally, the subgroup of CRS animals from which blood (CORT) samples were obtained did not differ on measures of PFC GLU levels from those CRS animals that did not provide blood samples.
Discussion
We report that CRS results in significant apical dendritic retraction and spine loss in identified callosal neurons within the IL- and PL-PFC. This finding suggests that a history of chronic stress can have lasting effects on the interhemispheric regulation of PFC-mediated function in general and, in particular, on the manner in which the left and right PFC interact in responding to subsequent stressful events. Hemispheric specialization of PFC-mediated stress responses rests in part on evidence of inherent functional asymmetries in the DA-sensitive mechanisms of this cortical region (Gratton & Sullivan, Citation2005). From this we have argued that the effects of different stressors and the coping responses they engage are mediated by functionally distinct yet complementary mechanisms in the left and right PFC. This implies that, in processing stressful events, the left and right PFC must communicate with each other. We have previously reported evidence that such interhemispheric communication is subserved by the stress-induced release of GLU from callosal neurons in the PL/IL-PFC. The stress response of callosal neurons is itself driven by a GLU input and, importantly, is asymmetrically modulated in the left and right PFC by DA most likely acting at D1 receptors on local GABA interneurons and/or terminals (Lupinsky et al., Citation2010). Our working hypothesis is that the development of maladaptive responding to stressors, and the increased vulnerability to disease it imparts, emerge as a consequence of a disequilibrium in the interhemispheric regulation of PFC function. The present study provides insights into the mechanisms by which this might occur.
We found that CRS induces dendritic atrophy and spine loss in callosal neurons located in the PL-PFC as well as in those located in the IL-PFC. Chronic stress-induced dendritic retraction and/or spine loss has previously been observed in different subpopulations of pyramidal neurons within the dorsal regions of PFC, including the PL-PFC (Cook & Wellman, Citation2004; Liston et al., Citation2006; Radley et al., Citation2004, Citation2006). In the IL-PFC, however, previous studies indicate that the effects of chronic stress differ markedly in different subpopulations of pyramidal neurons. For instance, whereas chronic stress-induced dendritic retraction is observed in IL-PFC pyramidal neurons projecting to the entorhinal cortex no such morphological alterations were seen among IL-PFC neurons that project to the basolateral amygdala and, in contrast with PL-PFC neurons, none of the IL-PFC neurons sampled showed evidence of dendritic spine loss (Shansky et al., Citation2009). Thus, in keeping with this and other evidence of circuit-specific effects of chronic stress, our data indicate that IL-PFC callosal neurons differ from other subpopulations of pyramidal neurons in this region in their sensitivity to CRS. While the extent of dendritic retraction seen in PFC callosal neurons (20–25%) is generally comparable to that previously reported for other subpopulations of PFC pyramidal neurons, the (30–40%) overall decrease in spine density observed in these neurons is unexpected as it seems greater than that observed among the general population of PFC pyramidal neurons (i.e. Radley et al., Citation2006). The apparent discrepency is probably due in part to methodological differences. In the present study, spine density was determined across the entire apical arbor whereas, in previous studies, it was assessed from a selected sampling of dendrites. Using bright field microscopy, which yields estimates of spine density that are lower than those derived from confocal microscopy, probably also contributed to the variance.
Our data indicate that, while much of the overall CRS-induced decrease in spine density is accounted by the (approx 35%) loss of thin spines, the density of mushroom-shaped spines, despite being considerably fewer in number, was reduced by half in chronically stressed animals. This finding is at odds with previous evidence that mushroom-shaped spines remain stable after CRS (Bloss et al., Citation2011) but is generally consistent with the results of Radley et al. (Citation2013) showing a 35% loss of mushroom-shaped dendritic spines on PL-PFC pyramidal neurons projecting to the anterior bed nuclei of the stria terminalis (BNST). The functional significance of this finding lies in the fact that, unlike the immature and unstable thin spines which are thought to be more plastic (Portera-Cailliau et al., Citation2003; Wallace & Bear, Citation2004; Yuste & Bonhoeffer, Citation2001), mushroom-shaped spines are crucial for the formation of mature, long-lasting excitatory synapses (Holtmaat et al., Citation2005; Kasai et al., Citation2003; Matsuzaki et al., Citation2001, Citation2004; Petrak et al., Citation2005).
Dendritic spines and the AMPA and NMDA receptors co-localized there form the predominant excitatory postsynaptic site of action of GLU. Several lines of evidence indicate that the stability and maintenance of dendritic spine density are strongly influenced by activity-dependent changes in GLU signaling (see McKinney, Citation2010 for review). NMDA receptor activation has been implicated in stress-induced alterations in dendritic morphology; NMDA receptor activation causes dendritic shrinkage and dendritic spine loss (Hasbani et al., Citation2001; Iki et al., Citation2005; Koleske, Citation2013) and NMDA receptor blockade prevents chronic stress-induced dendritic retraction in both hippocampal and PL-PFC pyramidal neurons (Magariños & McEwen, Citation1995; Martin & Wellman, Citation2011). Also relevant to the present findings is evidence that the stability and maintenance of dendritic spines require the activation of AMPA receptors by synaptically released GLU. Blocking hippocampal (CA3-CA1) AMPA receptors or GLU release result in decreased spine density; AMPA receptor blockade decreased the density mostly of thin spines, while apparently having little effect on the density of mushroom-shaped spines (Mateos et al., Citation2007; McKinney et al., Citation1999). The decrease in thin spine density resulting from AMPA receptor blockade was accompanied by a loss in spine synapses and, interestingly, by a concomitant increase in the number of excitatory dendritic shaft synapses. Thus, it would seem that sustained activation of AMPA receptors by synaptically released GLU is essential to maintain thin dendritic spines. However, the increased number of dendritic shaft synapses reported under low GLU conditions would presumably serve to compensate for the loss of thin spine synaptic sites. To the extent that this is true also of PFC callosal neurons, these findings raise the possibility that the loss of thin dendritic spines reported here, occurred as a consequence of the low basal levels of extracellular GLU observed in CRS animals; under these conditions tonic activation of AMPA receptors would presumably have been insufficient to maintain stable dendritic spine densities.
That the CRS regimen used in the present study caused such a substantial loss of mushroom-shaped spines was unexpected given evidence that this subtype of dendritic spine is relatively insensitive to impaired GLU signaling. However, there is evidence that CRS-induced loss of mature spines, such as mushroom-shaped spines, is mediated by a glucocorticoid (GC) receptor-dependent mechanism in keeping with evidence that GCs cause changes in dendritic morphology similar to those caused by chronic stress (Cerqueira et al., Citation2007; Liston & Gan, Citation2011; Liu & Aghajanian, Citation2008). Radley et al. (Citation2013) recently reported that a chronic variable stress (CVS) regimen causes similar decreases in the density of mushroom-shaped spines among PFC neurons that project to the anterior BNST. However, unlike the present CRS paradigm which eventually elicited a very attenuated CORT response after 21 days, the acute CORT stress response in the study of Radley et al. (Citation2013) is clearly shown have sensitized after repeated daily CVS. Thus, the loss of mushroom-shaped spines reported by Radley et al. (Citation2013) may well have occurred as a consequence of the repeated prolonged GC exposure elicited by CVS. However, notwithstanding that CRS still elicited significant albeit very attenuated increases in CORT levels, this appears not to have been the case in the present study. Thus, the mechanism mediating the CRS-induced loss of mushroom-shaped spines on PFC callosal neurons remains to be elucidated.
While chronic stress has been reported to cause hemisphere-specific alterations in the dendritic morphology of unidentified PL- and IL-PFC pyramidal neurons (Perez-Cruz et al., Citation2007), the present study did not uncover any similar evidence of hemispheric differences in the dendritic morphology and spine density of callosal neurons in either CRS or control animals. Yet, our study also indicates that CRS-induced alterations to the dendritic morphology of PFC callosal neurons are accompanied by hemisphere-specific changes in the acute PFC GLU response to a heterotypic stressor; while the GLU stress response was clearly prolonged in the left PFC no reliable effect was observed on the right PFC GLU response to the stressor. The strongest conclusion that can be derived from these data is that the stress-responsivity of callosal neurons located in the right IL-PFC is augmented following CRS. Beyond that we can only speculate as to a functional relationship between the effects of CRS on the dendritic morphology of callosal neurons and the GLU stress response. The CRS-induced decrease in the density of mushroom-shaped dendritic spines and the concomitant loss of excitatory postsynaptic sites presumably associated with it would be expected to disrupt the GLU input to callosal neurons. However, it is difficult to reconcile this possibility with the prolonged GLU stress response observed in the left PFC; if anything the loss of excitatory spine synapses in right PFC callosal neurons would be expected to dampen their responsivity to stress activated inputs. Clearly, this was not the case. Nonetheless, if the prolonged left PFC GLU stress response cannot be ascribed directly to a putative reduction of excitatory inputs to the apical dendritic spines of right PFC callosal neurons it might still have occurred as a consequence of compensatory, functionally opposite, morphological changes to their basilar arbor. Another likely possibility is that CRS also caused morphological alterations to other neurochemical systems known to regulate the activity of PFC callosal neurons. Of the many such systems, DA and GABA stand out. That both basal extracellular DA levels and D1 receptor density have been found to be diminished in the PFC of chronically stressed animals is significant in this respect (Goldwater et al., Citation2009; Mizoguchi et al., Citation2000). Indeed, we have previously reported evidence showing that DA acting at D1 receptors exerts an inhibitory influence on the GLU stress response of callosal neurons (Lupinsky et al., Citation2010). Our previous data also suggest that this regulatory influence of DA on the stress response of PFC callosal neurons is indirect and most likely mediated by D1 receptors located on GABA interneurons. Interestingly, PFC GABA interneurons have recently been shown to undergo dendritic remodeling in chronically stressed mice (Gilabert-Juan et al., Citation2013). Taken together, these lines of evidence raise the possibility that CRS-induced changes in the responsivity of callosal neurons to subsequent stressors might not only reflect inherent dendritic alterations to these neurons, but also morphological changes to systems that regulate their activity.
Acknowledgements
The help of Guillaume Ducharme and of S. Gabriela Torres-Platas and the advice of Drs Dominique Walker, Sylvain Williams and Naguib Mechawar is gratefully acknowledged.
Declaration of interest
We have read and understood the ICMJE policy on declaration of interests and declare that we have no competing interests. This work was supported by a Canadian Institutes for Health Research grant to A.G.
References
- Bagley J, Moghaddam B. (1997). Temporal dynamics of glutamate efflux in the prefrontal cortex and in the hippocampus following repeated stress: effects of pretreatment with saline or diazepam. Neuroscience 77:65–73
- Berridge CW, Mitton E, Clark W, Roth RH. (1999). Engagement in a non-escape (displacement) behavior elicits a selective and lateralized suppression of frontal cortical dopaminergic utilization in stress. Synapse 32:187–97
- Bloss EB, Janssen WG, Ohm DT, Yuk FJ, Wadsworth S, Saardi KM, McEwen BS, Morrison JH. (2011). Evidence for reduced experience-dependent dendritic spine plasticity in the aging prefrontal cortex. J Neurosci 31:7831–9
- Bories C, Husson Z, Guitton MJ, De Koninck Y. (2013). Differential balance of prefrontal synaptic activity in successful versus unsuccessful cognitive aging. J Neurosci 33:1344–56
- Brake WG, Sullivan RM, Gratton A. (2000). Perinatal distress leads to lateralized medial prefrontal cortical dopamine hypofunction in adult rats. J Neurosci 20:5538–43
- Carlson JN, Fitzgerald LW, Keller RW Jr, Glick SD. (1991). Side and region dependent changes in dopamine activation with various durations of restraint stress. Brain Res 550:313–18
- Carlson JN, Fitzgerald LW, Keller RW Jr, Glick SD. (1993). Lateralized changes in prefrontal cortical dopamine activity induced by controllable and uncontrollable stress in the rat. Brain Res 630:178–87
- Carr DB, Sesack SR. (2000). Dopamine terminals synapse on callosal projection neurons in the rat prefrontal cortex. J Comput Neurol 425:275–83
- Cerqueira JJ, Taipa R, Uylings HBM, Almeida OFX, Sousa N. (2007). Specific configuration of dendritic degeneration in pyramidal neurons of the medial prefrontal cortex induced by differing corticosteroid regimens. Cereb Cortex 17:1998–2006
- Cochran WC, Cox GM. (1957). Experimental designs. 2nd ed. New York: John Wiley & Sons
- Cook SC, Wellman CL. (2004). Chronic stress alters dendritic morphology in rat medial prefrontal cortex. J Neurobiol 60:236–48
- Crombag HS, Gorny G, Li Y, Kolb B, Robinson TE. (2005). Opposite effects of amphetamine self-administration experience on dendritic spines in the medial and orbital prefrontal cortex. Cereb Cortex 15:341–8
- Ferino F, Thierry AM, Saffroy M, Glowinski J. (1987). Interhemispheric and subcortical collaterals of medial prefrontal cortical neurons in the rat. Brain Res 417:257–66
- Gilabert-Juan J, Castillo-Gomez E, Guirado R, Moltó MD, Nacher J. (2013). Chronic stress alters inhibitory networds in the medial prefrontal cortex of adult mice. Brain Struct Funct 218:1591–605
- Goldwater DS, Pavildes C, Hunter RG, Bloss EB, Hof PR, McEwen BS, Morrison JH. (2009). Structural and functional alterations to rat medial prefrontal cortex following chronic restraint stress and recovery. Neuroscience 164:798–808
- Gratton A, Sullivan RM. (2005). Role of the prefrontal cortex in stress responsivity. In: Steckler T, Kalin N, Reul JMHM, editors. Handbook of stress and the brain, Pt 1. The neurobiology of stress. Vol. 15. Amsterdam: Elsevier Science. p 807–18
- Hasbani MJ, Viquez NM, Goldberg MP. (2001). NMDA receptors mediate hypoxic spine loss in cultured neurons. Neuroreport 12:2731–5
- Holtmaat AJ, Trachtenberg JT, Wilbrecht L, Shepherd GM, Zhang X, Knott GW, Svoboda K. (2005). Transient and persistent dendritic spines in the neocortex in vivo. Neuron 45:279–91
- Iki J, Inoue A, Bito H, Okabe S. (2005). Bi-directional regulation of postsynaptic cortactin distribution by BDNF and NMDA receptor activity. Eur J Neurosci 22:2985–994
- Kasai H, Matsuzaki M, Noguchi J, Yasumatsu N, Nakahara H. (2003). Structure–stability–function relationships of dendritic spines. Trends Neurosci 26:360–8
- Katz LC, Burkhalter A, Dreyer WJ. (1984). Fluorescent latex microspheres as a retrograde neuronal marker for in vivo and in vitro studies of visual cortex. Nature 310:498–500
- Koleske AJ. (2013). Molecular mechanisms of dendrite stability. Nat Rev Neurosci 14:536–50
- Liston C, Gan WB. (2011). Glucocorticoids are critical regulators of dendritic spine development and plasticity in vivo. Proc Natl Acad Sci USA 108:16074–9
- Liston C, Miller MM, Goldwater DS, Radley JJ, Rocher AB, Hof PR, Morrison JH, McEwen BS. (2006). Stress-induced alterations in prefrontal cortical dendritic morphology predict selective impairments in perceptual attentional set-shifting. J Neurosci 26:7870–4
- Liu RJ, Aghajanian GK. (2008). Stress blunts serotonin- and hypocretin-evoked EPSCs in prefrontal cortex: role of corticosterone-mediated apical dendritic atrophy. Proc Natl Acad Sci USA 105:359–64
- Lupinsky D, Moquin L, Gratton A. (2010). Interhemispheric regulation of the medial prefrontal cortical glutamate stress response in rats. J Neurosci 30:7624–33
- Magariños AM, McEwen BS. (1995). Stress-induced atrophy of apical dendrites of hippocampal CA3c neurons: involvement of glucocorticoid secretion and excitatory amino acid receptors. Neuroscience 69:89–98
- Martin KP, Wellman CL. (2011). NMDA receptor blockade alters stress-induced dendritic remodeling in medial prefrontal cortex. Cereb Cortex 21:2366–73
- Mateos JM, Lüthi A, Savic N, Stierli B, Streit P, Gähwiler BH, McKinney RA. (2007). Synaptic modifications at the CA3-CA1 synapse after chronic AMPA receptor blockade in rat hippocampal slices. J Physiol 581:129–38
- Matsuzaki M, Ellis-Davies GC, Nemoto T, Miyashita Y, Iino M, Kasai H. (2001). Dendritic spine geometry is critical for AMPA receptor expression in hippocampal CA1 pyramidal neurons. Nat Neurosci 4:1086–92
- Matsuzaki M, Honkura N, Ellis-Davies GC, Kasai H. (2004). Structural basis of long-term potentiation in single dendritic spines. Nature 429:761–6
- McEwen BS. (2004). Protection and damage from acute and chronic stress: allostasis and allostatic overload and relevance to the pathophysiology of psychiatric disorders. Ann NY Acad Sci 1032:1–7
- McKinney RA. (2010). Excitatory amino acid involvement in dendritic spine formation, maintenance and remodelling. J Physiol 588:107–16
- McKinney RA, Capogna M, Dürr R, Gähwiler BH, Thompson SM. (1999). Miniature synaptic events maintain dendritic spines via AMPA receptor activation. Nat Neurosci 2:44–9
- Mizoguchi K, Tuzurihara M, Ishige A, Sasaki H, Chui DH, Tabira T. (2000). Chronic stress induces impairment of spatial working memory because of prefrontal dopaminergic dysfunction. J Neurosci 20:1568–74
- Paxinos G, Watson C. (1996). The rat brain in stereotaxic coordinates. New York:Academic
- Perez-Cruz C, Muller-Keuker JIH, Heilbronner U, Fuchs E, Flugge G. (2007). Morphology of pyramidal neurons in the rat prefrontal cortex: lateralized dendritic remodeling by chronic stress. Neural Plast 2007:46276
- Peters A, Kaiserman-Abramof IR. (1970). The small pyramidal neurons of the rat cerebral cortex. The perikaryon, dendrites and spines. Am J Anat 127:321–55
- Petrak LJ, Harris KM, Kirov SA. (2005). Synaptogenesis on mature hippocampal dendrites occurs via filopodia and immature spines during blocked synaptic transmission. J Comput Neurol 484:183–90
- Portera-Cailliau C, Pan DT, Yuste R. (2003). Activity-regulated dynamic behavior of early dendritic protrusions: evidence for different types of dendritic filopodia. J Neurosci 23:7129–42
- Radley JJ, Anderson RA, Hamilton BA, Alcock JA, Romig-Martin SA. (2013). Chronic stress-induced alterations of dendritic spine subtypes predict functional decrements in an hypthalamo-pituitary-adrenal-inhibitory prefrontal circuit. J Neurosci 3:14379–91
- Radley JJ, Rocher AB, Miller M, Janssen WG, Liston C, Hof PR, McEwen BS, Morrison JH. (2006). Repeated stress induces dendritic spine loss in the rat medial prefrontal cortex. Cereb Cortex 16:313–20
- Radley JJ, Sisti HM, Hao J, Rocher AB, McCall T, Hof PR, McEwen BS, Morrison JH. (2004). Chronic behavioral stress induces apical dendritic reorganization in pyramidal neurons of the medial prefrontal cortex. Neuroscience 125:1–6
- Seib LM, Wellman CL. (2003). Daily injections alter spine density in rat medial prefrontal cortex. Neuroscience 337:29–32
- Shansky RM, Hamo C, Hof PR, McEwen BS, Morrison JH. (2009). Stress-induced dendritic remodeling in the prefrontal cortex is circuit specific. Cereb Cortex 19:2479–84
- Stalnaker TA, España RA, Berridge CW. (2009). Coping behavior causes asymmetric changes in neuronal activation in the prefrontal cortex and amygdala. Synapse 63:82–5
- Steciuk M, Kram M, Kramer GL, Petty F. (2000). Immobilization-induced glutamate efflux in medial prefrontal cortex: blockade by (+)-Mk-801, a selective NMDA receptor antagonist. Stress 3:195–9
- Stevenson CW, Sullivan RW, Gratton A. (2003). Effects of basolateral amygdala dopamine depletion on the nucleus accumbens and medial prefrontal cortical dopamine responses to stress. Neuroscience 116:285–93
- Sullivan RM, Szechtman H. (1995). Asymmetrical influence of mesocortical dopamine depletion on stress ulcer development and subcortical dopamine systems in rats: implications for psychopathology. Neuroscience 65:757–66
- Wallace W, Bear MF. (2004). A morphological correlate of synaptic scaling in visual cortex. J Neurosci 24:6928–38
- Wallace M, Luine V, Arallanos A, Frankfurt M. (2006). Ovariectomized rats show decreased recognition memory and spine density in the hippocampus and prefrontal cortex. Brain Res 1126:176–82
- Yuste R, Bonhoeffer T. (2001). Morphological changes in dendritic spines associated with long-term synaptic plasticity. Ann Rev Neurosci 24:1071–89