
Abstract
The HESI RISK21 project formed the Dose-Response/Mode-of-Action Subteam to develop strategies for using all available data (in vitro, in vivo, and in silico) to advance the next-generation of chemical risk assessments. A goal of the Subteam is to enhance the existing Mode of Action/Human Relevance Framework and Key Events/Dose Response Framework (KEDRF) to make the best use of quantitative dose-response and timing information for Key Events (KEs). The resulting Quantitative Key Events/Dose-Response Framework (Q-KEDRF) provides a structured quantitative approach for systematic examination of the dose-response and timing of KEs resulting from a dose of a bioactive agent that causes a potential adverse outcome. Two concepts are described as aids to increasing the understanding of mode of action—Associative Events and Modulating Factors. These concepts are illustrated in two case studies; 1) cholinesterase inhibition by the pesticide chlorpyrifos, which illustrates the necessity of considering quantitative dose-response information when assessing the effect of a Modulating Factor, that is, enzyme polymorphisms in humans, and 2) estrogen-induced uterotrophic responses in rodents, which demonstrate how quantitative dose-response modeling for KE, the understanding of temporal relationships between KEs and a counterfactual examination of hypothesized KEs can determine whether they are Associative Events or true KEs.
| Abbreviations: | ||
| AChE | = | acetyl cholinesterase |
| AE | = | associative event |
| AOP | = | adverse outcome pathway |
| As3mt | = | arsenic methyltransferase |
| AUC | = | area under the curve |
| BMDL | = | benchmark dose lower confidence limit |
| BMR | = | benchmark response |
| BPA | = | bisphenol A |
| BrdU | = | bromodeoxyuridine |
| BuChE | = | butyrylcholinesterase |
| ChE | = | cholinesterase |
| CPF | = | chlorpyrifos |
| CYP450 | = | cytochrome P450 |
| DES | = | diethylstilbestrol |
| DMAIII | = | dimethylarsinic acid (reactive metabolite trivalent) |
| DMAV | = | dimethylarsinic acid |
| DMPS | = | dimercaptopropanesulfonic acid |
| DR | = | dose-response |
| EC | = | European Commission |
| EC50 | = | median effective concentration |
| EFSA | = | European Food Safety Authority |
| EPA | = | Environmental Protection Agency (US) |
| ER | = | estrogen receptor |
| ERα | = | estrogen receptor alpha |
| HESI | = | Health and Environmental Sciences Institute |
| HRF | = | Human Relevance Framework |
| ILSI | = | International Life Sciences Institute |
| IVIVE | = | in vitro to in vivo extrapolation |
| KE | = | key event |
| KEDRF | = | Key Events/Dose-Response Framework |
| L-NAME | = | L-NG-nitroarginine methyl ester |
| ModF | = | modulating factor |
| MIE | = | molecular initiating event |
| MOA | = | mode of action |
| MOE | = | margin of exposure |
| NOAEL | = | no-observed-adverse-effect level |
| NRC | = | National Research Council |
| OECD | = | Organisation for Economic Co-operation and Development |
| OP | = | organophosphate |
| PBPK | = | physiologically based pharmacokinetic |
| PD | = | pharmacodynamic |
| PON1 | = | Paraoxonase 1 |
| PR | = | progesterone receptors |
| Q-KEDRF | = | Quantitative Key Events/Dose-Response Framework |
| QSAR | = | quantitative structure- activity relationship |
| RBC | = | red blood cell |
| REACH | = | Registration, Evaluation, Authorisation and Restriction of Chemicals |
| RIP140 | = | receptor interacting protein 140 |
| SAM | = | S-adenosyl methionine |
| SRC-1 | = | steroid receptor coactivator-1 |
| TCPy | = | 3,5,6-trichloro-2-pyridinol |
| TDV | = | traditional dose value |
| WoE | = | weight of evidence |
Introduction
As society progresses through the second decade of the 21st century, there is increased pressure to embrace new ideas and new information in the practice of toxicology and risk assessment. Modern biological science has provided many assessment tools—genomics, transcriptomics, proteomics, metabolomics, and others—that enable scientists to dissect and ultimately understand the biological pathways underlying toxicity. Disruption of these pathways is associated with adverse outcomes.
The progression of this understanding of these adverse outcome pathways fosters and enables the use of these new tools in the practice of chemical risk assessment (CitationAnkley et al. 2010, CitationNRC 2007). What is needed is the knowledge of the biological pathways that underlie a given toxicity and an estimate of the degree or amount of disruption each pathway can tolerate without the occurrence of pathway-specific toxicity (CitationBoekelheide and Andersen 2010, CitationBoekelheide and Campion 2010, CitationHartung and McBride 2011). The use of mode of action (MOA) currently is the most reliable way for developing sufficient knowledge and understanding of these biological pathways.
RISK21 project
For a number of years, the International Life Sciences Institute (ILSI) Research Foundation has assembled cross-disciplinary working groups to examine current risk assessment approaches for evaluating dose-response and identifying safe exposure levels (CitationJulien et al. 2009). Recently, these efforts were applied to four categories of bioactive agents—food allergens, nutrients, pathogenic microorganisms, and environmental chemicals—and from the lessons learned, a common analytical framework was developed for understanding MOA—the Key Events/Dose-Response Framework (KEDRF; CitationBoobis et al. 2009, CitationBuchanan et al. 2009, CitationJulien et al. 2009, CitationRoss et al. 2009, CitationTaylor et al. 2009).
The present paper describes ways to incorporate information about the timing of occurrence and quantitative dose-response of Key Events (KE) into the KEDRF. This expanded framework is known as the Quantitative Key Events/Dose-Response Framework or Q-KEDRF. In one sense, this is a “how-to” paper, which describes methods to incorporate additional information for understanding the particulars of the MOA of a chemical. In addition to a discussion of these methods, examples are provided for illustration.
Dose-response/Mode-of-Action Subteam
A central issue in 21st century toxicology and risk assessment is dose-response analysis and its extrapolation to human exposure levels. Building on the KEDRF, the Dose-Response (DR)/Mode-of-Action (MOA) Subteam within the ILSI Health and Environmental Sciences Institute's (HESI's) RISK21 project was formed to develop a clear strategy for using all available data (in vitro, in vivo, and in silico) in both qualitative and quantitative ways to develop the methods to be used in next-generation risk assessments of substances. The gathering of these various types of data is best accomplished in a tiered fashion suggested by the red triangle labeled as “Toxicity” in the upper left portion of .
Figure 1. The HESI RISK21 Roadmap and Matrix.
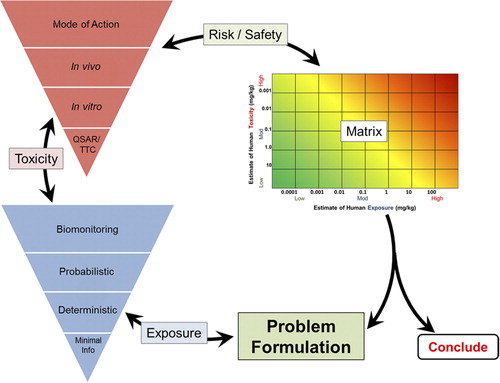
The DR/MOA Subteam has three main objectives: 1) to provide a forum to discuss approaches to dose extrapolation in human health risk assessment; 2) to address how an understanding of MOA will influence low-dose extrapolation; and 3) to enhance the existing MOA/Human Relevance Framework (HRF) and KEDRF. Specifically, this third objective aims to use quantitative dose-response and temporal information about both KEs and the adverse outcome in a more robust way. Consistent with all HESI projects, participation in the Risk21 Dose-Response Subteam included tripartite representation from government, academia, and industry, with subteam co-leadership provided by expert scientists from academia and industry.
History and uses of MOA/HRF frameworks
MOA is defined specifically in the US Environmental Protection Agency's (EPA's) 2005 Guidelines for Carcinogen Risk Assessment as follows:
… a sequence of Key Events and processes, starting with interaction of an agent with a cell, proceeding through operational and anatomical changes, and resulting in cancer formation. A “key event” is an empirically observable precursor step that is itself a necessary element of the mode of action or is a biologically based marker for such an element. Mode of action is contrasted with “mechanism of action,” which implies a more detailed understanding and description of events (CitationUSEPA 2005a).
While necessary, single KEs by themselves are not usually sufficient for the adverse outcome to occur, as noted by CitationJulien et al. (2009):
Hence, a key event is a necessary, though not a sufficient, step in a process that results in a specific adverse effect.
CitationJulien et al. (2009) also provide some historical perspective on the concept of MOA and broadened the definition as the “fundamental biological events and processes that underlie the effect of a bioactive agent”. In risk assessment, consideration of MOA likely originated from the work of CitationLehman-McKeeman et al. (1989) on male rat nephrotoxicity associated with accumulation of alpha 2μ-globulin, the work of CitationCohen and Ellwein (1990) and CitationCohen (1995) on bladder carcinogenesis, and that of CitationFaustman et al. (1997) on the evaluation of mechanisms of developmental toxicity.
The KEDRF provides a structured approach for systematic examination of KEs that occur between the initial dose of a bioactive agent and the final or apical effect of concern (CitationJulien et al. 2009). Here, not only are the timing of KEs and the quantitative aspects of dose-response examined, but also two additional concepts for understanding MOA are discussed—Associative Events (AEs) and Modulating Factors (ModFs). These concepts were defined in CitationAndersen et al. (2014). AEs essentially provide biomarkers for KEs, and a full definition is provided in a later section. ModFs affect the timing and/or dose-response of KEs and include variability in homeostasis or repair capacities, adaptive or immune mechanisms, enzyme polymorphisms, and other biological factors. The nature and strength of ModFs varies between individuals and in the same individual over time. Life stage, disease state, genetics, lifestyle, and other factors underlie this inter- and intra-individual variability. The Q-KEDRF provides a means to incorporate ModFs in specific situations (described below), and thus, to understand how these result in distributions of population sensitivity in the dose-response of the various KEs and, ultimately, the adverse outcome.
MOA included in regulatory guidance
Government regulatory agencies around the world have incorporated MOA/HRFs into guidance documents because of their ability to inform risk assessments. For example, the European Commission (EC) has incorporated MOA in its risk assessment guidance for industrial chemicals and biocides, and the US EPA's Guidelines for Carcinogen Risk Assessment specifically emphasizes the use of MOA information for interpreting and quantifying the potential cancer risks to humans (CitationEC-JRC 2003, CitationUSEPA 2005a). In addition, EPA's Supplemental Guidance for Assessing Susceptibility from Early-Life Exposure to Carcinogens (or Supplemental Guidance) also relies on knowledge of the MOA (CitationUSEPA 2005b). The EPA has also drafted a Framework for Determining a Mutagenic Mode of Action for Carcinogenicity that is also based upon MOA, but this guidance has not yet been finalized (CitationUSEPA 2007). Health Canada considers MOA in development of drinking water guidelines and pesticide resistance management labeling (CitationHealth Canada 1999, Citation2009, Citation2011, CitationLiteplo and Meek 2003).
The European Food Safety Authority (EFSA) includes a MOA assessment in its guidance on Harmonizing Cancer and Non-cancer Risk Assessment Approaches (CitationEFSA 2005). MOA is recommended in the EC Registration, Evaluation, Authorisation and Restriction of Chemicals (REACH) Regulation guidance for conducting a chemical safety assessment, and in the new “classification, labelling, and packaging” regulation on chemical substances and mixtures (EC Citation2008). The Organisation for Economic Co-operation and Development (OECD) recommends using MOA to support the building of chemical categories or when using read-across approaches (www.oecd.org/chemicalsafety/risk-assessment/groupingofchemicalschemicalcategoriesandread-across.htm). OECD has further embraced the concept of MOA in its recent use of adverse outcome pathways (AOPs; CitationAnkley et al. 2010, CitationOECD 2013). With the push to use more systematic and weight-of-evidence (WoE) approaches in risk assessment, both the recognition of the value and importance of the MOA/HRF and KEDRF and their use in risk assessments will increase.
MOA reduces uncertainty and informs quantitative risk assessment
MOA is a fundamental component of risk assessment for the classification of carcinogens and systemic toxicants, and informing the choice of whether a nonlinear or linear approach to low-dose extrapolation is appropriate. Evaluators can use quantitative kinetic and/or dynamic data considered in MOA analysis in at least five ways. These are listed below, along with specific examples:
| 1) | replace default species extrapolation factors; | ||||
| 2) | evaluate more directly the relevant concentrations in the target tissue; | ||||
| 3) | determine the most representative dose metric; | ||||
| 4) | choose the most appropriate quantitative dose-response model; and | ||||
| 5) | assess quantitatively the overall relevance to humans. | ||||
Replacement of the default toxicodynamic component of the species extrapolation factor was based on species-dependent differences in the dose-response for AHR activation between humans and rodents in a risk assessment for dioxin based on the 2006 NTP cancer bioassay (CitationBudinsky et al. 2014, CitationNTP 2006, CitationSimon et al. 2009). The understanding gained by investigation into the MOA of small intestinal carcinogenesis by hexavalent chromium led to the identification of the flux of hexavalent chromium entering each segment of the small intestine as the best measure of concentration affecting the target tissue (CitationKirman et al. 2012, CitationThompson et al. 2014). The extensive work on the MOA of the pesticide chlorpyrifos (discussed in detail below) enabled the recent identification of brain cholinesterase inhibition as the most appropriate dose metric for a risk assessment based on cholinesterase inhibition (CitationReiss et al. 2012). An examination of the MOA of acrylamide-induced mammary tumors in F344 rats suggested that nonlinear low-dose extrapolation was a more appropriate method than linear extrapolation (CitationMaier et al. 2012). Last, the Q-KEDRF is part of the MOA/human relevance framework (MOA/HRF) and the purpose of this larger framework is the assessment of human relevance (CitationBoobis et al. 2006, CitationBoobis et al. 2008, CitationCohen et al. 2003, CitationCohen et al. 2004, CitationCohen and Arnold 2011, CitationMeek et al. 2003, CitationMeek 2008, CitationSeed et al. 2005, CitationMeek et al. 2014a, CitationMeek et al. 2014b).
An understanding of MOA is also needed to account for the role of metabolism in various tissues and to decide which early metabolic changes may be KEs. This understanding enables the evaluator to account for induction or inhibition of metabolism of a particular chemical and for potential first-pass effects that may increase or decrease toxicity due to metabolite formation or reduction in the systemic dose of the parent compound. Variations in patterns of toxicity with different metabolic profiles exist across species, strains and sexes in animals and across potentially susceptible subgroups and different life stages in humans. These variations need to be considered so that appropriate and defensible quantitative adjustments can be made for purposes of incorporation of these differences into risk assessments. The overall result is that MOA information can reduce uncertainties in risk assessments in a number of areas.
MOA is the foundation of 21st century toxicology testing and risk assessment
The interpretation of traditional animal toxicity studies for their relevance to humans is difficult, at times impossible, and, more often than not, fraught with controversy (CitationSeok et al. 2013, CitationBeyer et al. 2011, CitationGori 2013, CitationNRC 1983). These studies generally use high doses resulting in considerable uncertainty when attempting to extrapolate the effects observed in animals to humans, especially when humans are experiencing much lower environmental exposures (CitationNRC 1983). Aspects of this interpretation no less important than human relevance include: 1) the advances in understanding MOA, including the molecular and cellular events responsible for toxicity; 2) the desire to refine, reduce and replace the use of animals in regulatory toxicity testing; and 3) the need for toxicity evaluations for the large number of chemicals in commercial use. In response to these issues, the National Research Council (NRC) developed recommendations on toxicity testing that incorporated new in vitro and in silico technologies and computational systems biology to complement, and eventually replace, whole animal testing. The new strategy was presented in a report titled Toxicity Testing in the 21st Century: a Vision and a Strategy (CitationNRC 2007).
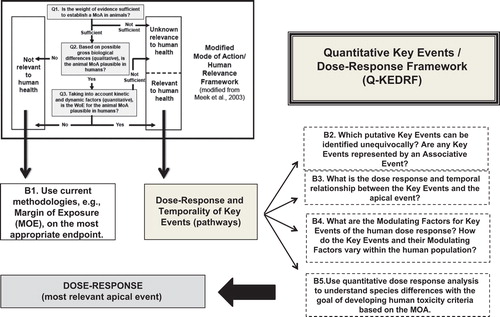
The report emphasized the importance of relating events leading to toxicity in the context of perturbations in biologic functions, some of which may be reversible or may represent biologically appropriate adaptations to stressors. Twenty–first century risk assessment uses the knowledge of MOA to link together perturbations in biological pathways observed in humans, in animals, in experiments with in vitro systems, and even those predicted by quantitative structure–activity relationships (QSAR) or other computational methods with the goal of determining the likelihood of adverse health outcomes in humans (upper left box in ).
Figure 2. Quantitative Key Events/Dose-Response Framework (Q-KEDRF) and Its Relationship to the Mode of Action/Human Relevance Framework.
One vital aspect of this new strategy and the vision of 21st century risk assessment is the development of appropriate prediction models (CitationAdeleye et al. 2014, CitationJudson et al. 2014, CitationPatlewicz et al. 2013). Statistical approaches that attempt to correlate high throughput assay results with adverse outcomes appear to possess a level of predictivity no better than that derived from chemical structure (CitationThomas et al. 2012). The realization of this difficulty has fostered the curation of AOPs for use in prediction models (CitationLandesmann et al. 2013, CitationOECD 2013, CitationVinken 2013). In addition, attempts are being made to develop broad categories of MOAs for the purpose of exploiting extant knowledge across categories in a new application of read across (CitationBriggs et al. 2012, CitationThomas et al. 2013, CitationVink et al. 2010). Understanding MOA seems to be a necessary part of eventual use of AOPs for risk assessment. Both dose and time contribute to the development of a biologically adverse response—hence, knowledge of MOA requires a detailed understanding of the dose- and time-dependency of the steps that lead from the initial interaction with a chemical to a specific toxic effect (CitationRowlands et al. 2014).
The Q-KEDRF—a tool for understanding MOA
MOA provides a link between exposure and the risk of adverse health outcomes—but only when the observed pathway perturbations can be characterized in terms of KEs. An important aspect of the definition of a KE is that its occurrence is necessary for the apical event. The other part of the definition is that a KE is “empirically observable.” Necessity, as part of the definition, allows one to develop a counterfactual experiment for a putative KE (, Box B2) and actually pose the question of whether it truly is a KE—if the event does not occur, will the adverse outcome occur?
Organizing questions and a toolbox for the Q-KEDRF
Box 1 provides a set of organizing questions for MOA as a prelude to applying the Q-KEDRF for specific MOA analyses. These general questions were developed from the charge questions provided to three expert panels in a workshop held at NIEHS to evaluate nuclear receptor-mediated MOAs for liver carcinogenicity (CitationBudinsky et al. 2014, CitationCorton et al. 2014, CitationAndersen et al. 2014, CitationElcombe et al. 2014). The questions are sorted into three general areas, but in practice, there will likely be considerable overlap between the questions. Attempting to answer these questions will provide anyone engaged in MOA analysis with an understanding of the extent of knowledge.
Box 1. Organizing questions for mode of action analysis.
Box 2 provides three overall categories of schemes for concise organization of the MOA information resulting from tackling the questions in Box 1. Examples of these methods are given from the papers resulting from the nuclear receptor workshop (CitationBudinsky et al. 2014, CitationCorton et al. 2014, CitationAndersen et al. 2014, CitationElcombe et al. 2014). Necessarily, the graphical techniques, save for the flow chart, will be quantitative. Although not mentioned specifically in Box 2, exposure–response arrays used in the Toxicological Profiles from the Agency for Toxic Substances and Disease Registry (ATSDR) and the newer Toxicological Reviews from EPA's IRIS program could be organized around proposed KEs within one or more hypothesized MOAs.
Box 2. Overview of the Q-KEDRF toolbox.
WoE considerations for identifying key events and understanding their role in the MOA
Here, we build on the work of CitationJulien et al. (2009) and CitationAndersen et al. (2014) to develop the Q-KEDRF. The following definitions are used in the Q-KEDRF:
Key Event (KE): An empirically observable causal precursor step to the adverse outcome that is itself a necessary element of the MOA. KEs are necessary but usually not sufficient for the adverse outcome in the absence of other KEs.
Associative Events (AEs): Biological processes that by themselves are not KEs in the hypothesized MOA but may serve as reliable indicators or biomarkers for KEs. AEs can be used as surrogates or biomarkers for a KE in a MOA evaluation; depending upon the nature of the biomarker, AEs may reflect exposure to a xenobiotic, the resulting effect, or both.
Modulating Factors (ModFs): Biological and individual factors, including control mechanisms or host factors, that can modulate the dose–response relationship of one or more KEs, thus altering the probability or magnitude of the adverse outcome (, Box B4).
AEs can easily be thought of as biomarkers. In this regard, their relationship to KEs may need to be explored, especially if the AE is needed to measure the KE (CitationIOM 2010).
ModFs may alter the dose-response of the KE in a variety of ways. A selection (not inclusive) of ModFs in humans is provided in .
Table 1. Modulating Factors (ModFs) potentially affecting KEs for dose-response in humans. ModFs fall into three general categories shown in the left column. The middle column shows subcategories and the right hand column shows some aspects to consider.
Both the KEDRF and Q-KEDRF represent an evolution of the MOA/HRF. Thus, both frameworks assume that sufficient evidence exists to posit the MOA under consideration and to identify hypothesized KEs based on this evidence (CitationBoobis et al. 2006, Citation2008, Citation2009, CitationMeek 2008, CitationMeek et al. 2003, CitationSeed et al. 2005, CitationSonich-Mullin et al. 2001).
If a putative MOA cannot be established, then the Q-KEDRF will not be applicable. Nonetheless, a risk assessment, albeit bearing greater uncertainty, can still be attempted using other methods such as margin of exposure evaluation based on the most appropriate endpoint ( and , Box B1).
A sequence of KEs represents a progression over both dose and time. Knowing the relationship between the various KEs in both dose and time along with an understanding of the underlying biology will contribute to the understanding of the role of particular KE within the MOA. Often, counterfactual information is not available. It may be very difficult to demonstrate the necessity of a particular proposed KE. Understanding the biology can help, but conclusive support of necessity will be a data gap.
Identifying a KE is based on the confidence one has that this event is necessary for the apical event/adverse outcome and is based on an overall WoE evaluation of qualitative and quantitative aspects of the MOA as well as whether the hypothesized roles of the KEs are consistent with the biological basis of the adverse outcome.
The Hill considerations have been adapted for use in understanding MOA. CitationHill (1965) termed these “viewpoints” or “features to consider” rather than true criteria. Hill's considerations are emphatically not a checklist and necessitate rigorous scientific thinking. They have been quite correctly called “guideposts on the road to common sense” (CitationPhillips and Goodman 2006). Hence, the Key Event/Dose-Response Concordance analysis or Dose-time Concordance analysis requires a rigorous and reasoned WoE approach to reach an understanding of the overall MOA (CitationPhillips and Goodman 2004). Very recently, newly evolved rank-ordered Bradford Hill considerations for application in a MOA analysis were developed (CitationMeek et al. 2014a). In rank order, these include biological concordance, essentiality of key events, concordance of empirical observations, consistency and analogy.
For each proposed KE, if removal or blockade of its occurrence could be accomplished (i.e., the counterfactual experiment), then its necessity (or lack thereof) and consequent identity as a KE could be supported. This is the consideration of essentiality. A cause–effect relationship between a chemical and an adverse effect can never be unequivocally proven because causality itself cannot be proven—only inferred with varying degrees of certainty (CitationAdami et al. 2011). A proposed MOA represents a testable hypothesis (CitationPopper 1959) and the KEs as aspects of that testable hypothesis can be examined in a weight of evidence framework to infer causality (CitationGuzelian et al. 2005, CitationHill 1965, CitationPhillips and Goodman 2004, Citation2006, CitationSusser 1986).
Therefore, as indicated in earlier publications on MOA, an essential aspect of the process is identification and evaluation of attendant uncertainties. Each step in a MOA analysis should be accompanied by a list of critical and associated data gaps, with a clear indication of those, if filled, likely to have the most impact on the conclusions. The implications of the existing uncertainties should be explored during dose-response assessment.
Relationships between key events, AEs, and the adverse outcome
The development of a proposed or hypothesized MOA will necessitate identification of KEs and understanding of the dose-response and temporal relationships between the various KEs and the adverse outcome as well as between the KEs themselves. This is the purpose of the Dose-Time Concordance table (). Such a table also addresses the temporal aspects of Box B3 in (CitationMeek et al. 2014b) .
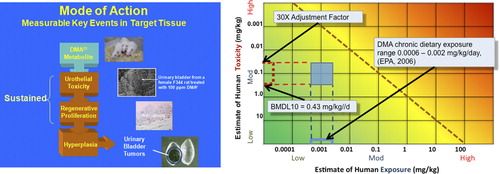
Table 2. Dose-time concordance table for dimethylarsinic acid.
In 2005, EPA's Office of Pesticide Programs proposed a MOA for the carcinogenesis of dimethylarsinic acid or DMAV, also known as cacodylic acid (CitationUSEPA 2005c). DMAV administered in the diet or drinking water produced bladder cancer in rats. There are four KEs in the MOA for bladder tumors in rats; these are: (1) generation of the reactive metabolite trivalent DMA (DMAIII) that is dependent on DMAV and can be observed as the urinary excretion of trivalent DMA greater than 0.1 μM in urine; (2) cytotoxicity occurring within the superficial epithelial layer of the urinary bladder; (3) consequent regenerative proliferation; and, (4) hyperplasia of the urothelium (CitationCohen et al. 2006, CitationUSEPA 2005c). The qualitative relationships between these KEs in both dose and time is shown in , which is an example of the dose–time concordance table (CitationMeek et al. 2014a, CitationMeek et al. 2014b).
In two-year bioassays, dietary administration of 9.4 mg/kg/d DMAV produced a statistically significant incidence of tumors; dietary administration of 4.0 mg/kg/d produced a statistically significant incidence of hyperplasia. There were no histopathological changes in the urothelium observable using light microscopy from dietary administration of 1 mg/kg/d or lower. In shorter term mechanistic studies using light and scanning electron microscopies to detect superficial cytotoxic changes, evidence of cytotoxicity was present at dietary doses of 1 mg/kg/d and higher. These same mechanistic studies used bromodeoxyuridine (BrdU) labeling index to assess cell proliferation and observed an increase in proliferation at a dietary dose of 1 mg/kg/d and above.
In rats administered DMAV in drinking water, genomic microarray analysis revealed a change in the pattern of altered gene expression between 0.4 and 4.7 mg/kg/d, the same level at which an apparent threshold was observed using transmission electron microscopy (CitationSen et al. 2005). Critical cytotoxic urinary levels of the reactive metabolite DMAIII were present in rats orally administered DMAV at doses of 1 mg/kg/d and above, but absent at 0.2 mg/kg/d. The level of detection for DMAIII in urine was 0.01 μM (CitationUSEPA, 2005c).
Evidence strongly suggests that DMAIII is not DNA reactive, and likely is not genotoxic except at relatively high concentrations (CitationCohen et al. 2006). summarizes the dose-response and temporal relationships for each of the KEs. For risk assessment purposes, it is reasonable to base the assessment on the most sensitive of the KE changes, that is, cytotoxicity. Based on such an analysis, the no-observed-adverse-effect level (NOAEL) is 0.2 mg/kg/d via diet. Similar findings have been identified in rats administered DMAV in the drinking water (CitationCohen et al. 2006). shows an example of the Dose-Response Species Concordance table that supports quantitative interspecies extrapolation of KEs.
Table 3. Dose-Response Species Concordance Table for Key Events (KEs) in the MOA of dimethylarsinic acid (DMAV) (Adapted from CitationUSEPA, 2005c).
Although the dose-response for humans in is lacking, toxicokinetic interspecies extrapolation could be based on differences in the metabolism and kinetics of DMAV in rats and humans. The evidence indicates that DMAV is a poor substrate for the methylating enzyme for arsenicals in humans (As3+ methyltransferase, As3mt) whereas in rats, this enzyme can readily methylate DMAV to trimethyl arsenic oxide (CitationThomas 2007). A physiologically based pharmacokinetic (PBPK) model for DMAV could support further refinement of the risk assessment, but such a model was not fully developed in 2005 (CitationEvans et al. 2008, CitationUSEPA, 2005c). In vitro cytotoxicity assays utilizing rat urothelial cells showed an effect at concentrations of approximately 0.2 μM or higher; in comparison, in vitro human urothelial cells showed less sensitivity, with cytotoxicity produced at concentrations of 0.5 μM and higher (CitationCohen et al. 2006). Hence, overall, humans would be less susceptible than rats based on both kinetics and dynamics. These quantitative differences could potentially be used to develop a data-derived species extrapolation factor or chemical-specific adjustment factor (CitationUSEPA 2011, CitationWHO-IPCS 2005, CitationMeek et al. 2014b). In such a case, this information could be added to the Dose-Response Species Concordance Table.
Low protein or vegetarian diets decrease the availability of S-adenosyl methionine (SAM), and arsenic methylation uses SAM as a methyl donor. Hence, diet may constitute a ModF to be considered (CitationGamble and Hall 2012).
The risk assessment conducted by EPA's Office of Pesticide Programs (OPP) used a benchmark dose lower confidence limit of 0.07 mg/kg/d DMAV based on cell proliferation as the 1% point of departure (CitationUSEPA 2005c) and a nonlinear low-dose extrapolation to develop a reference dose protective of cancer based on this MOA. Here, this example serves to demonstrate the use of the Dose-Time Concordance Table () and the Dose-Response Species Concordance Table (). The BMD information for KEs occurring at 10 weeks—cytotoxicity, proliferation, and hyperplasia—provided a way to order these KEs and supports their order in the dose–time concordance table ().
An example of how to use the RISK21 exposure-toxicity matrix is provided (). The heavy dotted line on the matrix represents a hazard quotient (HQ) of one. The blue square represents the intersection of exposure and toxicity. If any part of this area extends above the line representing an HQ of one, then exposures may be of concern. In the case of cacodylic acid, all exposure levels within the range of chronic dietary exposures are less than the RfD (CitationUSEPA 2006). The exposure-toxicity matrix is flexible; in addition to the range shown here, probability distributions of exposure and/or toxicity can be shown as a means of visualizing probabilistic characterizations of exposure, toxicity, and risk.
Figure 3. Use of MOA in the HESI RISK21 Matrix. Left: MOA for Tumor Induction by Dimethylarsinic Acid (DMAV; Cacodylic Acid) that includes cytotoxicity, regenerative proliferation, and hyperplasia. This MOA is used to illustrate the dose-time concordance table and dose-response species concordance table ( and ). Right: Matrix showing the exposure estimates and toxicity range (BMDL10 to RfD) for chronic dietary exposure, data from EPA, 2006.
Concordance of the MOA between humans and animals
The human relevance of a hypothesized MOA may depend on both qualitative and quantitative factors. As evident from the example with DMAV above, EPA's Office of Pesticide Programs clearly recognizes this fact and the need for assessing both qualitative and quantitative concordance of KEs between animals and humans (CitationDellarco and Fenner-Crisp 2012). For example, in the early 1990s, a technical panel from EPA concluded that male rat renal tubule tumors from chemicals that induced accumulation of α2u globulin were likely not relevant to humans based on qualitative considerations (CitationRodgers and Baetcke 1993). Naphthalene produces respiratory tract tumors in rats, but the MOA for these tumors in rats is based on metabolic enzyme activity that is not present in humans (CitationPiccirillo et al. 2012).
The Dose-Response Species Concordance Table () is a means of illustrating the similarities and differences in a proposed MOA between humans and the test-species. Likely other information, narrative and/or additional tables, will be needed to provide all the information needed for species extrapolation.
Qualitative concordance of key events between humans and animals
Human relevance of the apical endpoint is best determined using a hypothetico-deductive WoE approach (CitationBoobis et al. 2006, Citation2008, CitationMeek et al. 2003, CitationRhomberg et al. 2010, CitationSeed et al. 2005, CitationSonich-Mullin et al. 2001). To address human relevance of the MOA, qualitative concordance between humans and animals for each KE needs to be considered. In vitro data from human or animal cells or tissues and/or in silico data may also be available; these data play a useful role in the determination of concordance as well. Ideally, the data will be sufficient to determine which of the KEs is relevant to humans, and these data may thus be used to support statements about the relevance to humans of the hypothesized MOA in animals.
Quantitative concordance of the MOA between humans and animals
Quantitative examination of both the dose-response and timing of KEs is also necessary to determine human relevance. For example, a MOA may be operative in both animals and humans, but extremely unlikely in humans because of quantitative toxicokinetic or toxicodynamic differences. If the KE has the potential to occur in humans, then this quantitative examination can be used to inform animal-to-human extrapolation. Hence, the quantitative concordance should provide information about the EC50 and/or point-of-departure values for as many KEs as possible in both humans and the animal test species. Including NOAELs or other measures of the no-effect level/threshold such as that defined using the EC05 baseline projection method of CitationSilkworth et al. (2005) or the “hockeystick” fitting method of CitationLutz and Lutz (2009) may also be useful.
The role of quantitative dose-response information
For dose-response assessment, it can be extremely useful to examine quantitative dose-response information from as many relevant sources as possible (e.g., human, laboratory animal or in vitro data). These data will help inform the progression of events within the MOA. In vitro to in vivo extrapolation (IVIVE) may be necessary to express the dose-response for in vitro data on a similar dose scale as the in vivo data. Where possible, the actual dose-response plots should be shown. It is often helpful to show the dose-response of a KE and that of the apical event or adverse outcome on the same plot (e.g., in CitationSimon, et al 2009). Once the MOA for rat liver tumor promotion by TCDD was considered, the task of arranging the dose-response plots in a figure that displayed the MOA in a meaningful way became easy. Rodent liver tumor promotion is one of the longest and most intensively investigated MOAs in toxicology (CitationBudinsky et al. 2014). Developing similarly informative figures may not be as easy for less well-studied chemicals. is an attempt to create a similar figure for the uterotrophic response. For clarity, it is helpful to have the same dose range on the x-axis in all the plots. When not possible to provide plots of dose-response curves, sufficient narrative should be presented to explain animal/human similarities and differences. If sufficient data in both dose and time are available for a particular KE, a three-dimensional graph with an interpolated surface plot that shows the occurrence of the KE along both dose- and time-axes may be very informative (Box 2; CitationBudinsky et al. 2014).
Use of dose-time and dose-response concordance information in understanding the MOA
In general, events that occur at low doses and/or at early stages in the progression toward the apical event may represent:
the start of a temporal progression;
the initial stages of a developing change; or,
a factor that potentially causes other KEs that occur at higher doses or at a later time in the progression.
Generally, demonstrating that a particular event is necessary is experimentally difficult; yet, it may be possible in some cases (e.g., with transgenic or knockout animals), thus providing a powerful counterfactual demonstration supporting the identification of the event as a KE (CitationPhillips and Goodman 2006). In the example used in and , let us assume that blocking metabolism of DMAV or cacodylic acid to dimethyl arsinous acid (DMAIII) could reduce or alleviate the KE of urothelial cytotoxicity. The enzyme arsenic methyltranferase (As3mt) catalyzes all steps in the metabolic pathway from arsenite to mono, di, and trimethylated arsenic compounds (CitationUSEPA 2005c). If cytotoxicity and tumors did not occur when As3mt was inactivated, this would confirm the role of metabolism and resulting cytotoxicity as necessary and thus as KEs; conversely, if cytotoxicity and tumors occurred even when As3mt was inactivated, one could no longer support the identification of metabolism and cytotoxicity as KEs. Once the DMAIII is formed, it readily reacts with free sulfhydryl groups. Co-administration with high doses of a sulfhydryl-containing chemical, such as dimercaptopropanesulfonic acid (DMPS) can act as a trap for the DMAIII, reduce or prevent its reaction with proteins, and thus reduce or prevent its biological effects. Co-administration of DMAV with DMPS inhibits the induction of cytotoxicity and regenerative proliferation of the urinary bladder, providing evidence for DMA III as the reactive intermediate and AE/KE in the DMAV-induced bladder cancer in rats (CitationCohen et al. 2006).
The exact nature of a KE cannot be necessarily understood from either its dose-response or its timing of occurrence. For example, some early KEs may need to be sustained in order for later KEs or the apical event/adverse outcome to occur (e.g., CitationBudinsky et al. 2014).
Toxicokinetics may affect this timing. For example, lipid soluble chemicals may be stored in adipose tissue for months or years and produce effects on an ongoing basis; for similar reasons, the dose of a bioaccumulative chemical may be measured as body burden or tissue concentration. In such a case, the area under the curve (AUC) in units of concentration × time would likely represent the ongoing accumulation in both dose and time better than body burden or tissue concentration at a single time point. Sequestration of a chemical by protein binding may also be represented best by the AUC. A monotonic dose–response relationship between the AUC and a biomarker for a putative KE such as enzyme induction indicates that exploring the quantitative relationship between this biomarker and the apical event/adverse outcome may likely help elucidate details of the MOA.
In other cases, the occurrence of some early KEs may trigger a cascade of other events. These early KEs either resolve themselves or are no longer empirically observable. However, the cascade of triggered events continues and leads ultimately to the adverse outcome/apical event. An example of such an effect is illustrated by the difference between long-acting and short-acting estrogens; short-acting estrogens produce early but not late events in the uterotrophic response whereas long-acting estrogens produce both. Estradiol, a long-acting estrogen, can stimulate uterine growth for up to 72 hours whereas the effects of estriol, a short-acting estrogen, last only 24 hours. In fact, estriol and other short-acting estrogens may display partial antagonism when continuously administered in longer-term assays (CitationClark and Markaverich 1984). Again, these various estrogenic compounds show differences in their dose-response over time.
The Q-KEDRF toolbox
Quantitative methods are often a good way to understand modulating factors. When a sufficient number of experiments determine the procession/cascade of KEs on both dose- and time-scales, quantitative methods are less necessary to obtain an understanding of the MOA. In such cases, the Dose-Time Concordance Table will suffice, and such was the case for DMA.
The relationship of KEs to the critical effect/apical or adverse outcome can be understood by expressing the tumor BMD as a multiple of the BMD values of various KEs (e.g., CitationSimon et al. 2009). BMD10 values are shown on the figures in . Values for the BMD multiple for the three KEs, cytotoxicity, proliferation and hyperplasia, can be determined as:
Using Eq. (1), one can determine that the tumor POD is almost 100 fold greater than the BMD10 for cytotoxicity at 10 weeks, about 3 fold greater than the BMD10 for proliferation at 10 weeks, and about 1.5 fold greater than the BMD10 for hyperplasia at 10 weeks. These values provide a means of judging the relative position of the various KEs along the dose continuum.
Quantitative dose-response methods also may prove very useful for understanding and refining proposed MOAs. For example, CitationSimon et al. (2009) used both potency and steepness to determine the dose progression of likely KEs in the MOA for rodent liver tumorigenesis by dioxin. This approach was used again to examine nuclear receptor activation leading to tumor promotion (CitationBudinsky et al. 2014, CitationCorton et al. 2014).
While no single method is appropriate for all situations, the methods described in this section are all part of the Q-KEDRF toolbox. Contrast tests and regression analysis using well-established statistical methods may prove useful for ordering events within a hypothesized MOA (CitationBretz et al. 2005, CitationSawilowsky 2002, CitationTukey et al. 1985). CitationLutz and Lutz (2009) provide full details of their “hockey stick” model and an R script for ease of use. For developing dose levels corresponding to specified response levels (i.e., benchmark doses), CitationMurrell et al. (1998) suggest the use of the calculated slope of the dose-response and baseline projection. CitationSilkworth et al. (2005) implemented a form of this method but did not describe details of their calculation. The method was fully developed, including calculation of confidence intervals in CitationBudinsky et al. (2010). CitationSand et al. (2006) used the second and third derivatives of the dose-response function to obtain a “transition dose range.” Further, they identified a response level of 21% as the transition point for the Hill model.
Naïve practitioners may be tempted to use of the numerical results of a single method as a quantitative threshold. In this regard, any quantitative estimate of a threshold needs to be considered in the light of biological significance, and quantitative estimates of thresholds and transitional dose values (TDVs; see Section 4 below) from a variety of methods should be developed (CitationBudinsky et al. 2010). The discussion of thresholds in CitationSlob and Setzer (2014) is particularly enlighting. Notable is their argument that dose is better represented on a logarithmic scale than on a linear one. The use of logarithms with dose is consistent with thermodynamic principles (CitationWaddell 2005, CitationWaddell 2008). This caveat notwithstanding, the ability to obtain quantitative dose values within the low-dose region can greatly help determine the order in dose and time of events within a hypothesized MOA (See Supplementary Content for an example).
Modulating factors—accounting for variation within the human population
The application of the MOA/HRF and the QKEDRF can provide informative and quantitative descriptions of the MOA and dose-response for adverse outcomes (cancer and non-cancer) including those at low, environmentally relevant exposure levels. Such an approach is essentially designed to describe the form of the dose-response curve for a generalized population. What is also needed is an approach that allows for incorporation of the influence of ModFs on the dose-response of KEs that will ultimately enable the quantitative population-level assessment of risk at low exposure levels. ModFs should be understood in terms of their effects on biological processes and KEs within an MOA. The effect of a low protein vegetarian diet on the availability of S-adenosyl methionine as a possible ModF for the toxicity of DMAV has already been discussed.
One universal ModF is likely to be individual variation in reserve capacities, for example, differing amounts of reduced glutathione that affect the occurrence of particular KEs between individuals and over time within a single individual. Other examples would be the expression of the p53 gene product or the occurrence of oxidative DNA damage.
Variations in the intracellular level of a large number of transcription factors and cofactors can alter both the efficacy and potency for both steroid and glucocorticoid hormones (CitationBlackford et al. 2012, CitationSimons 2010, CitationSun et al. 2008, CitationZhang et al. 2012). In fact, limitations in the amount of coregulatory proteins available within the transcription complex may lead to non-monotonic dose response curves such as squelching (CitationCharlier 2009, CitationKraus et al. 1995, CitationZhang and Teng 2001). Graphical analysis of these changes yields valuable mechanistic information when the production of the apical response follows a first-order Hill dose-response curve (CitationDougherty et al. 2012, CitationOng et al. 2010, CitationSimons and Chow 2012). However, regardless of the order of the dose-response curve of the adverse outcome/apical response, the magnitude and/or position of the dose-response curve will likely be similarly modified by any chemical that binds to nuclear receptors and/or other transcription cofactors.
There may exist many potential ModFs for any particular exposure scenario (e.g., specific chemical, type of exposed individual or group). Therefore, organizing these factors based on common biological mechanisms would be helpful. By doing so, the likelihood of a ModF affecting a particular MOA could be determined. One approach described here is to identify a list of general ModFs that can be broadly separated as Host, Life Style and Environment (). Other classification schemes for ModFs, perhaps based on MOA, will likely emerge as risk assessment practitioners gain experience with the Q-KEDRF. The OECD is currently developing a program on AOPs, and the International QSAR foundation is developing an “Effectopedia” to provide information about AOPs/MOAs as part of a global scientific collaboration; the Q-KEDRF will likely interface quite well with these efforts (CitationAnkley et al. 2010, CitationPatlewicz et al. 2013). The use of the term “Initial Molecular Event” (IME) to refer to the first step Event, as suggested by CitationPatlewicz et al. (2013), is appropriate and conveys an accurate message—that the initial event may not obligatorily lead to the adverse outcome.
Examples of modulating factors
Two examples are presented below with the goal of improving the understanding of how ModFs can affect KEs and potentially impact the dose-response for the adverse outcome. These examples illustrate different aspects of KEs within biological pathways: xenobiotic processing (metabolism) and endocrine stimulation.
Example 1: Genetic variation in PON1 potentially modulates chlorpyrifos metabolism and toxicity
The MOA for OPs is well known—inhibition of cholinesterases with toxicity manifested as central and peripheral cholinergic effects () (CitationMileson et al. 1998). Cholinesterase inhibitors include carbamate insecticides, physostigmine used to treat glaucoma, and Δ9-tetrahydrocannabinol, the active moiety in marijuana. Paraoxonase 1 (PON1) is an arylesterase that metabolizes organophosphate compounds (OPs). Thionophosphorus OPs such as chlorpyrifos (CPF) are metabolized to the oxygen analog or oxon by CYP450 mixed function oxidases. These oxons are potent inhibitors of acetyl cholinesterase (AChE). CPF oxon is inactivated by PON1 in the liver and other tissues (CitationSmith et al. 2011, CitationTimchalk et al. 2002a; 2002b).
Figure 4. Mode of Action of Chlorpyrifos showing metabolic activation to CPF-oxon and inhibition of acetylcholinesterase as the critical effect. (Figure courtesy of Dr. Alan Boobis).

Host factors—genetic variability and lifestyle factors
In humans, PON1 activity is age-specific, increasing about 3.5 fold between birth and 7 years of age, remaining constant thereafter () (CitationSmith et al. 2011). Genetic polymorphisms exist in the coding regions of PON1 gene with consequent variation in catalytic activity. For example, PON1 polymorphism at amino acid 192 [glycine (Gln; Q allele) to arginine (Arg; R allele) substitution] changes PON1-mediated esterase activity depending on the substrate present (CitationAdkins et al. 1993). PON1 (R192) hydrolyzes CPF oxon more efficiently than PON1 (Q192) (CitationRichter et al. 2009). Along with the general increase in activity with age, differing phenotypes mature at different rates (CitationHuen et al. 2010). Polymorphisms exist in the promoter region of PON1 and may affect expression level and tissue activity. A single nucleotide polymorphism located 108 bases before the transcription start site (PON1-108) accounts for 22.4% in the variability in arylesterase activity (CitationBrophy et al. 2001, CitationDeakin and James 2004). Overall, an individual's PON1 activity is dependent on variations in the coding region as well as the promoter region. Both the polymorphisms and the age-dependent increase in activity would be categorized as host factors. The age-dependent increase in Vmax in plasma PON1 activity on a plasma volume basis for individuals of all three genotypes (QQ, QR and RR) is shown in .
Figure 5. PON1-mediated Vmax values vs. age (upper plot). PON1 functional phenotypes are represented by open circles, open triangles, and open squares for QQ, QR, and RR, respectively (see text for definitions). CPF- oxon hydrolysis Vmax values in plasma over paraoxon hydrolysis activity (lower plot) resolves QQ and QR, but not QR and RR. (From CitationSmith et al. 2011; permission to reproduce figures granted by Dr. Jordan Smith, 22 March 2013.).
In addition to these host factors, a number of lifestyle factors affect PON1 activity. Statins are cholesterol-lowering substances that occur naturally in red rice yeast and are also prescribed as drugs. In some human studies, very modest increases in serum PON1 have been observed in those taking statins. However, in other studies, no effect is seen (CitationCosta et al. 2011). Moderate alcohol consumption appears to increase serum PON1 (CitationSierksma et al. 2002). Pomegranate juice contains several polyphenols and its consumption increases plasma PON1 activity in normal humans and in diabetic patients (CitationAviram et al. 2000, CitationRock et al. 2008). The lifestyle factors increase PON1 activity and would tend to desensitize individuals to the effects of thionophosphorus OPs.
Consideration of modulating factors in a chlorpyrifos risk assessment
For risk assessment purposes, the question that must be asked is whether changes in PON1 actually translate into changes in sensitivity, and, if so, whether these host and/or lifestyle factors produce sufficient variation in PON1 activity such that individuals with a sensitive phenotype such as QQ or the very young might constitute an at-risk subpopulation.
When workers exposed to CPF during manufacture were compared to a referent group of chemical workers, no effect of PON1 phenotype was observed (CitationAlbers et al. 2010, CitationGarabrant et al. 2009). Urinary 3,5,6-trichloro-2-pyridinol (TCPy) is a metabolite of CPF and a specific biomarker of exposure (CitationAlexander et al. 2006); TCPy levels in all exposed workers were less than those paralleling previously determined no-observed-effect levels for red blood cell (RBC) AChE inhibition and changes in neurological function (CitationAlbers et al. 2004a; Citation2004b; Citation2004c; Citation2007, Citation2010, Citationvan Gemert et al. 2001).
Enzyme kinetics of PON1 were analyzed in liver microsomes and plasma in both children and adults to measure quantitative age-dependent differences (CitationSmith et al. 2011). These data were incorporated into a probabilistic physiologically based pharmacokinetic and pharmacodynamic (PBPK/PD) model for CPF (CitationPrice et al. 2011, CitationTimchalk et al. 2002a, CitationTimchalk et al. 2002b). With this model, the relationship between urinary TCPy and either plasma butyrylcholinesterase (BuChE) or RBC AChE was determined and related to the exposure to CPF. Model results are shown in . In three-year-old children, the greatest percent reduction in ChE levels for typical dietary intake was 0.001%. In addition, a sensitivity analysis of the PON1 parameter in blood and liver revealed only a modest influence of this factor. The presence of other detoxification enzymes established a lower limit for the effect of PON1 variation (CitationHinderliter et al. 2011, CitationPrice et al. 2011).
Figure 6. Modeled chlorpyrifos pharmacokinetics in adults and children and resulting AChE inhibition in erythrocytes. A. RBC AChE inhibition from the AUC (left) and maximum CPF concentrations (right) in blood (from CitationHinderliter et al. 2011). B. Modeled time courses of CPF and CPF oxon in blood from dietary exposures (upper panel) and corresponding RBC AChE inhibition (lower panel). (Reprinted from Regulatory Toxicology and Pharmacology (Hinderliter, P.M., Price P.S., Bartels M.J., Timchalk C., Poet T.S. 2011. Development of a source-to-outcome model for dietary exposures to insecticide residues: An example using chlorpyrifos, Regul. Toxicol. Pharmacol. 61, 82–92) with permission from Elsevier.).
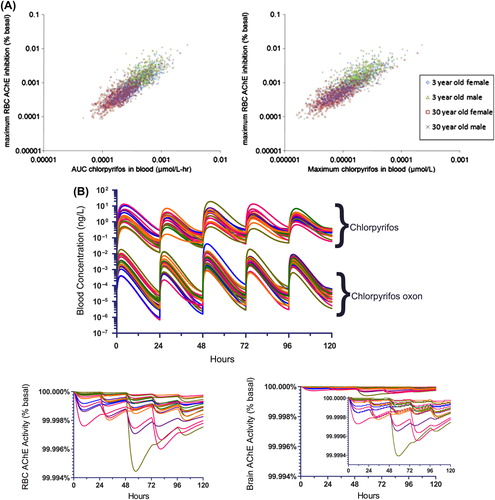
In contrast, at a dose of 300,000 ng/kg/d of CPF, typical of a high-dose animal study, the model indicated that both the age-dependence and the polymorphisms in the activity of hepatic PON1 would be reflected by substantial differences in RBC AChE levels; however, neither these age-dependent differences nor PON1 enzyme polymorphisms are likely to affect RBC AChE levels at real-world human exposure levels (CitationGarabrant et al. 2009, CitationHinderliter et al. 2011, CitationSmith et al. 2011, CitationTimchalk et al. 2002a; 2002b).
To incorporate ModFs into risk assessment, the effect of these factors needs to be considered at the point of departure or at current exposure levels and not in a purely abstract way. An effect of human variation in PON1 on RBC AChE inhibition was observed in the model output at a dose of 300,000 ng/kg/d of CPF but not at current dietary exposures of children and adults for which the respective doses are estimated to be less than 11 ng/kg/d and 3.4 ng/kg/d. Increased sensitivity was not observed at dietary exposures because the exposures were too low to produce a biologically meaningful change in the activity of various cholinesterases, even in sensitive individuals. In addition, individuals of the RR phenotypes appear to have higher activity of PON1 in plasma, thus providing similar capacity for clearance (; CitationSmith et al. 2011). Therefore, while the presence of polymorphisms and the age-dependence of PON1 provide illustrations of potential ModFs, the actual effects of these factors must be considered in the context of the entire dose-response curve and relevant exposure levels.
This examination of the MOA for CPF-inhibition of AChE includes tiers 1 through 4 of toxicity resources in the RISK21 roadmap (). In vitro and in vivo data from humans were included; a PBPK/PD model was used for IVIVE and the Q-KEDRF was used to evaluate the ModFs of age and genetic polymorphisms. This probabilistic model is an excellent example of the use of quantitative MOA information in a risk assessment.
provides an example of the Species Concordance table for ModFs and presents some of the information discussed above. The table format is sufficiently flexible to accommodate both qualitative and quantitative information. Although the information for CPF was obtained from humans, the columns for animals represent placeholders for those situations in which species extrapolation of the effect of ModFs needs consideration.
Table 4. Dose-response concordance table for Modulating Factors (MFs) in the MOA of chlorpyrifos.
Example 2: Factors that can modulate the uterotrophic response
Estrogens induce uterotrophy through activation of the estrogen receptor alpha (ERα), a ligand-activated nuclear receptor and transcription factor. Cellular and physiological factors can modulate the estrogen dose-response for ERα activation, subsequent KEs, and uterine weight gain, the latter considered to be the critical effect in this example. A positive uterotrophic response for a chemical indicates a potential for endocrine disruption (CitationOECD 2003).
Progesterone opposes estrogenic effects and reverses estrogen-induced uterotrophy. Progesterone stops cell growth and prevents the uterine lining from shedding. Like estrogen, progesterone is a ligand that activates a transcription factor. All transcription factors require cofactors for transcription to occur. One function of these cofactors is to increase the activity of RNA polymerase II, sometimes by facilitating chromatin remodeling and RNA polymerase II access to transcriptional start sites. For constitutively expressed genes, chromatin remodeling plays a smaller role than other gene regulatory factors (CitationJohn et al. 2011). In contrast, RNA polymerase II is already bound at the transcription start site of a large number of other genes and the binding of a transcription factor is the signal for the polymerase to “start” (CitationLevine 2011). Cofactors that interact with both the estrogen and progesterone receptors include steroid receptor coactivator-1 (SRC-1), receptor interacting protein 140 (RIP140), and the histone acetyl transferase chromatin-binding protein/p300 (CitationKobayashi et al. 2010, CitationSimons 2008, CitationSimons 2010).
Among the mechanisms by which progesterone is proposed to antagonize estrogen actions is by binding to progesterone receptors (PRs) to form complexes that compete with ERαs for cofactors that help mediate and thus increase ERα- mediated gene transactivation (CitationGiangrande et al. 2000, CitationKraus et al. 1995, CitationParisi et al. 2009, CitationWen et al. 1994). In general, the effects of progesterone oppose the effects of estrogen. Thus, the dose-response curve shifts to the right and the system or individual becomes less sensitive to the effects of estrogens. Given that estrogens induce synthesis of PRs, these combined effects may serve as a means of feedback inhibition of estrogen-activated responses.
Uterotrophy as a model system for understanding MOA
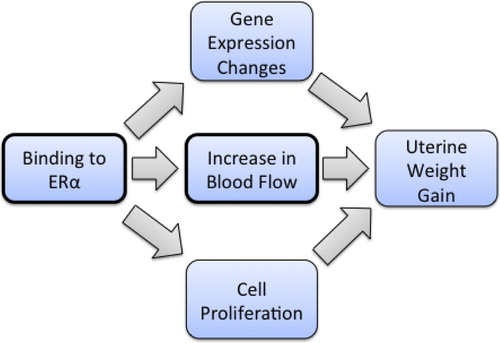
Estrogen-induced uterotrophy in rats is an extensively studied response that has been documented to proceed through estrogen binding to the intracellular ERα as the MIE and is a KE in the MOA for the uterotrophic response. The induction of several genes (i.e., ornithine decarboxylase, glucose-6-phosphate dehydrogenase, lactoferrin, c-fos, and uterine peroxidase) occurs in response to estrogen, and these gene expression changes have been proposed as KEs in the MOA of estrogen-induced uterine growth (; CitationOECD 2003). Microarray assays have identified various other genes that may also be part of the overall MOA (CitationHeneweer et al. 2007, CitationNaciff et al. 2003).
Figure 7. Putative MOA for the uterotrophic response.
The effects produced by ModFs shown in can modify gene function not only through direct effects on DNA and chromatin but also by altering the strength of the various binding reactions occurring during gene transcription, including interactions between DNA and protein, between RNA and protein, between DNA and RNA, and between various proteins. The effect of these associations on dose-response is not clear at this time. However, the Q-KEDRF approach allows one to test the prediction that chemicals and factors with similar molecular targets will evoke comparable changes in the adverse outcome/apical event.
Table 5. Cellular effects of modulating factors.
The rat uterotrophic response to estrogens was selected for a case study of the utility of using a MOA approach. The first step, of course, was to identify KEs or AEs that could serve as biomarkers for these KEs. Given the abundance of experimental data over the years for rat uterotrophy, this task was expected to be a relatively straightforward application of the new framework (). CitationOECD (2003) identifies binding to ERα as the MIE and provides a list of early and late events associated with uterotrophy. Unfortunately, dose-response and timing of these early and late events have not been obtained from the same species or preparation and thus, it is difficult to array these in a meaningful Dose-Time Concordance table. However, guidance from OECD as well as the scientific literature was used as the basis of a putative MOA and a set of proposed KEs for uterotrophy (). Given the extent of investment in testing for endocrine effects and the relative maturity of the uterotrophic assay, the lack of information from the same or at least comparable studies seems surprising. This situation emphasizes the need to design studies that address the particular question at hand as it relates to elucidation of the MOA, and illustrates how effective the MOA framework can be in rapidly and effectively identifying critical data gaps. Consideration of MOA as early as possible in the risk assessment process would foster the collection of appropriate data to inform the MOA based on the expected value of the information (CitationMeek et al. 2014a, CitationMeek et al. 2014b). Such an approach would be entirely consistent with the method of problem formulation described in NRC (Citation2009).
Following absorption of estrogen or an estrogenic chemical, binding to ERα would be the MIE. This binding has been measured in a number of species in vivo and in cell-free preparations (CitationLevin et al. 1993, CitationNotides et al. 1981). Following receptor binding, early events would include (1) altered expression of estrogen sensitive genes; (2) an increase in uterine blood flow; and (3) an increase in cell proliferation. Respectively, these events can be measured by: (1) microarrays or qRT-PCR; (2) flow transduction or weight gain; and (3) mitotic index or BrdU labeling. Because of the lack of sufficient data from a single high-quality study, as already stated, it is difficult to determine the exact role of these putative KEs in the MOA, but assessing the whole body of evidence using a WoE analysis, KEs can be substantiated. The apical event is, of course, uterine weight gain. At the present time, the order and timing of the changes shown in the third and second columns of and , respectively, are not known (CitationAshby et al. 1999, CitationGorski et al. 1977, CitationHeneweer et al. 2007, CitationKaye et al. 1971, CitationNaciff et al. 2003, CitationOECD 2003).
Figure 8. Dose-response plots for putative key events in the MOA for the uterotrophic response.
At this point, conclusive identification of putative KEs becomes difficult due to: (1) variations in experimental systems; (2) the absence of data representing multiple KEs from the same study or same laboratory; and (3) and insufficient data points to make quantitative conclusions about dose-response.
Identification of key events for uterotrophy using WoE
Absorption is considered part of absorption, distribution, metabolism, and excretion, and is thus not identified as a KE, although it is the initial event in the process. For some chemicals, metabolic transformation that occurs close in time to absorption may either bioactivate these chemicals to toxic/active metabolites (e.g., polycyclic aromatic hydrocarbons/tamoxifen and cortisone, respectively) or detoxify/inactivate them (e.g., CPF oxon/cortisol) (CitationChapman et al. 2013, CitationFurr and Jordan 1984). Estrogenic compounds contain one or more phenol groups and, following oral exposure, may be inactivated before reaching the systemic circulation by first-pass phase II metabolism in enterocytes or the liver (e.g., CitationHengstler et al. 2011). Hence, for estrogenic compounds and uterotrophy, metabolic transformation would not be a KE; however, metabolism may be a KE for other substances that are transformed to toxic metabolites (e.g., dimethylarsinic acid).
For uterotrophy, the MIE of binding to ERα will be a KE if it is empirically observable, and it is very probable that cell proliferation is also a KE. Two KEs can actually be conclusively identified on the basis of counterfactual reasoning and are shown with a thicker outline of the event boxes in . The basis for identifying binding to ERα as a KE is the fact that estrogen-receptor knockout mice do not show evidence of cell proliferation, that is, DNA synthesis, in response to estrogen (CitationCurtis et al. 1996, CitationKlotz et al. 2002). However, other responses associated with estrogen-induced uterotrophy such as water imbibition and lactoferrin induction are maintained in the absence of ERα (CitationDas et al. 1997, CitationWinuthayanon et al. 2010). The basis for identifying the increase in blood flow as a KE is the disruption of the uterotrophic response by L-NG-nitroarginine methyl ester (LNAME) that blocks nitric oxide synthase (CitationRao et al. 1995, CitationRosenfeld et al. 1996). Alternatively, the production of catechol estrogens due to an estrogen-mediated increase in peroxidase may also contribute to alpha-adrenergic activation, vasodilation of the uterine arteries, and a consequent increase in blood flow (CitationLyttle and DeSombre 1977, CitationFarley et al. 1992, CitationStice et al. 1987a; Citation1987b). In this example, the increase in uterine peroxidase is being identified as an AE to represent the increase in blood flow ().
Dose-response modeling can elucidate the MOA for uterotrophy
shows values for Hill model fits for the various responses of KEs and putative KEs. When data are available from a single study, both the EC50 and the slope of the dose-response curve are important in understanding the MOA and the relationship to the apical response (e.g., CitationSimon et al. 2009).
Table 6. Quantitative aspects of the dose-response of key events in the uterotrophic response.
Table 7. Inverse equations and slope equations of dose-response models from EPA’s benchmark dose software (USEPA 2012) to enable estimation of baseline projection values.
EPA's Cancer Guidelines (CitationUSEPA 2005a) suggest the possibility of using an earlier KE as a precursor to the apical event and developing a toxicity criterion using the dose-response of this KE. Caution is warranted when using a KE as the basis for development of a toxicity criterion when the dose-response of the KE has a higher value of the Hill coefficient than the apical response; steeper dose-response curves (higher Hill coefficients) will have greater nonlinearity than a first-order Hill response and thus, the rising phase of the dose-response may commence at a higher dose value. Therefore, using the dose-response of the KE as the basis of a toxicity factor may not be a health-protective choice in the case of an apical event or critical effect known to follow a first-order Hill function, as is the case for uterotrophy (CitationOECD 2003). By the same reasoning, the use of an early KE as the basis of a toxicity factor may be inappropriately over-conservative when the KE exhibits a shallower dose-response curve (lower Hill coefficient) than does the critical effect/adverse outcome.
The variation in the Hill coefficients observed in is likely a reflection of the fact that these data were obtained from disparate sources. The plots of estrogen binding in the left column of were obtained in vitro and thus, IVIVE would be needed to set these on a similar dose scale as whole animal effects.
At this time, most available dose-response curves for estrogen-induced genes and other responses associated with uterotrophy have so few data points that the determination of quantitative aspects of dose-response becomes problematic. Even after all the years of studying uterotrophy, the shape of the curve for the critical effect of uterine weight gain has not been firmly established (Note the variation between the three curves in the rightmost plot of ).
For these reasons, even the relatively superficial MOA for uterotrophy cannot yet be constructed without new, more detailed data. First, high-quality dose-response curves with more data points for intermediate responses are critical so that an accurate determination of the position (i.e., EC50) and shape (e.g., first- or second-order Hill plot) of the curve is possible. This level of information is needed for all events being considered as KEs. These data would be invaluable in eliminating proposed KEs for which the parameters of the dose-response curve are not compatible with those of the apical response. For example, a proximal event that displays a second-order Hill dose-response curve could not be a step in an apical response that exhibits a first-order Hill dose-response curve (CitationOng et al. 2010, CitationChow et al. 2011). In this way, quantitative dose- response modeling may provide some mechanistic insights into the role of various events (CitationSimons and Chow 2012). In addition, various analytical tools can be employed to gain mechanistic insight that is available only when the Hill coefficient is equal to one (CitationDougherty et al. 2012, CitationOng et al. 2010). A Hill coefficient of two or greater may indicate involvement of transcription factors that act as dimers or higher-order multimers. Alternatively, the observation of Hill coefficients greater than one may also result from ligand-induced conformational changes in binding proteins that function as dimers or multimers (CitationKoshland 1996, CitationKoshland and Hamadani 2002, CitationLevitzki and Koshland 1969). Furthermore, it would be instructive to know the details of ligand binding to ERα in cell-free extracts, in whole cells and in whole animals. One would also want data on the genomic responses in vitro and in whole animals. In addition, these data would need to be of sufficient quality to support quantitative dose-response modeling.
Second, additional data are needed to provide dose-response information at different times for those events hypothesized to be KEs. Ideally, these data would be collected under the same experimental conditions as that for the apical event. When performed, interim sacrifices in a cancer bioassay often provide this type of data (e.g., CitationNTP 2006) . Such data are necessary for constructing a time line of the KEs and providing data for the Dose-Time Concordance Table ().
Third, a decision should be made concerning the best experimental system for examining the effects of modulatory factors. For example, if ER-knockout mice are to be used, then high-quality dose-response data, as discussed above, should be collected from both normal and knock-out mice. Alternatively, if tissue culture and high throughput studies are selected, then appropriate tissue culture lines could be used and would need to be identified.
Potential utility of understanding the MOA for uterotrophy
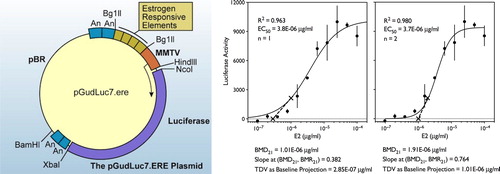
One potential result of the greater understanding deriving from more complete experimental data would be the potential for increased usage of in vitro assays measuring KEs and AEs as a screen to identify the chemicals to be assessed further in the uterotrophic assay, a scheme that is consistent with Tox21. The Q-KEDRF seems the best means of demonstrating this consistency. The Interagency Coordinating Committee on the Validation of Alternative Methods has validated a whole cell assay system (; BG1Luc ER TA) to assess the activity of different test compounds. CitationYamasaki et al. (2002, Citation2003, Citation2004) measured the response of a reporter gene system as well as the uterotrophic response in whole animals but did not attempt to conduct IVIVE to determine the quantitative relationship between the two—both the reporter gene assay and the in vivo assay were used only for identification of biological effects.
Figure 9. Details of one of the heterologous expression systems that could be used to substitute for the uterotrophic assay. Left: Stably transfected Luc reporter plasmid BG1Luc4E2 cell line from ICCVAM. Right: Concentration-response of the BG1Luc4E2 cells to estradiol showing fits to both first- and second-order Hill functions and the results of the transitional dose value calculation using the baseline projection method (Eq. 3,4 and 5). Please see Supplementary Content for another example.
One important aspect of uterotrophy as a model system is that it exemplifies the likely existence of thresholds in MOAs that include receptor binding as a KE. A TDV or range is located at the point where the rising portion of the dose-response begins (CitationMurrell et al. 1998, CitationSand et al. 2006). Because the binding assays were conducted in vitro and the units of dose and routes of exposure were not consistent among the in vivo studies, it is difficult to draw conclusions about the numerical values of these either possible threshold values or TDVs, but the ability to estimate these values can, in some cases, provide great insight about the MOA (e.g., CitationSimon et al. 2009).
The value of the Hill coefficient can be important in determining whether linear or nonlinear extrapolation should be used for modeling various KEs or the Adverse Outcome. For the example of uterotrophy here, the ability to obtain insights from quantitative data is mitigated by the relative paucity of the data. Inspection of suggests that for this in vitro response in BG1LucE42 cells, both first and second order Hill models provide equally good fits to these data. CitationNotides et al. (1981) did observe a shift in the Hill coefficient with increasing concentrations of ERα and attributed this increase to the formation of homodimers with greater availability of ERα. The uterotrophic response itself is generally considered to follow a first-order Hill function but the data from CitationNaciff et al. (2003) seem clearly second order, possibly for this reason. Additional data collection should provide greater certainty regarding the order of the Hill function.
Potential TDVs for the responses in were estimated using the baseline projection method of CitationMurrell et al. (1998) and as the BMD21 value as noted by CitationSand et al. (2006; ). CitationSilkworth et al. (2005) also suggest a method for baseline projection. Details of this method are provided in the next section and in the Supplementary Content.
Alternative Dose Levels from the Hill function for ordering KEs
The Hill model is a three or four parameter equation for a nonlinear relationship between dose and response. The model was first applied by A.V. Hill in 1910 to describe the relationship between oxygen tension and saturation of hemoglobin (CitationHill 1910). In pharmacology and toxicology, the Hill model has been used extensively to describe the relationship between the dose of a xenobiotic and a biological response (CitationGoutelle et al. 2008, CitationWagner 1968). In another very recent paper examining the shape and steepness of dose-response relationships for continuous endpoints, the Hill model and the exponential model were both found to provide adequate fits to a large number of data sets covering many continuous endpoints (CitationSlob and Setzer 2014).
For consideration of MOA, location and steepness of the dose-response may help order the events within the dose range. One would wish to know the approximate dose at which the rising portion of the dose-response begins, in other words, the TDV.
A form of the Hill model is shown below and it will be used later to examine responses to estrogenic chemicals. We also provide in the inverse equation for calculating the dose at a specified response, for example, the BMD, and the equation for the slope.
where g = background response;
Vmax = maximal response or efficacy;
n = Hill coefficient (unitless); and
Kd = affinity or dose at the half-maximal response, a measure of potency (For concentrations, this parameter is often shown as EC50, indicating a dose or concentration with a 50% of maximal efficacy.
In Eq. (2) and all equations following, common or base 10 logarithms are denoted by “log10” and natural logarithms are denoted by “loge” All the responses shown in were fit to Eq. (2). The third column in shows the fitted values for Kd and n, the Hill coefficient.
Another method to obtain the TDV is that of CitationMurrell et al. (1998). The baseline projection of the rising part of the curve is obtained by choosing two points by inspection, one above and one below the half-maximal response. The slope of the rising portion is calculated as the ratio of the differences of the dose and response values of these two points.
where Ri = fractional response levels above and below 0.5.
This slope will likely be very close to that at the half-maximal response. Hence, using 0.5 as the measure of the response at the Kd value on a zero-to-one scale, the dose at the onset of the rising portion of the dose-response is calculated as:
The results are shown in column 4 of .
For the form of the Hill model shown in Eq. (2), the dose at any fractional response level, for example, 0–1, can be obtained as follows:
Equation (5) was used to calculate the BMD21, identified as a TDV by CitationSand et al. (2006; ).
Once the Hill model parameters for the dose-response (Eq. 2) have been obtained from fitting software, the results of Eqs. (3–5) can be easily obtained with spreadsheet software or even a hand calculator. Only the Hill coefficient, n, and the common logarithm of the half-maximal concentration, log10 (Kd), are needed.
These doses are referred to as transitional because their location marks the approximate transition to the rising portion of the dose-response (CitationSand et al. 2006). The method of CitationMurrell et al. (1998) explicitly considers steepness with a calculation of the slope. The BMD21 is the point at which the generalized Hill model transitions to the rising phase, as indicated by higher derivatives of the model (CitationSand et al. 2006).
Measurements of binding to the estrogen receptor show very similar slope-based TDVs. One might expect gene expression changes to occur at a lower dose than uterine weight gain. The slope-based TDV for the increase in expression of vitamin D-dependent intestinal calcium-binding protein (Calb3) from CitationNaciff et al. (2003) is about half than that for uterine weight gain in the same study; however, the BMD21 values for these two effects are much more similar ().
In contrast, the data from CitationHeneweer et al. (2007) show about a two-fold increase in the BMD21 but similar slope-based TDVs. Both studies used immature female Sprague-Dawley rats so the difference in the relationship of TDVs between the two studies is likely due to the small number of data points and uncertainty in the fit. The fact that these two methods of calculating a transitional dose range/value give different results for two similar studies would be a reason to obtain further details of the biological role of Calb3 in the uterotrophic response. Highlighting the need for additional qualitative information about the biology underlying the MOA is a great benefit of the use of the Q-KEDRF.
Confidence limits could be likely determined for these TDVs, but the point of their use is to obtain evidence regarding the timing and role of events in a hypothesized MOA. The relationship between Calb3 and uterine weight is not yet known (CitationNaciff et al. 2003, CitationHeneweer et al. 2007). Hence, a review of the literature and possibly some laboratory studies would go further in addressing this particular data gap.
Last in the table are three measurements for increases in uterine cell proliferation, blood flow, and weight gain reported in CitationOECD (2003). All three studies were conducted in rats and the TDVs may suggest that the order of events along the dose continuum is:
| 1) | cell proliferation; | ||||
| 2) | increased blood flow measured by uterine peroxidase; and, | ||||
| 3) | uterine weight gain. | ||||
Both types of TDV for all three studies were expressed in units of μg/animal/d. Here, the slope-based TDV suggests that cell proliferation may be a low dose–response, whereas the slope-based TDVs for increases in blood flow and uterine weight gain occur fairly close to each other along the dose continuum. The TDVs as the BMD21 for these three responses are more challenging to interpret. The reason is likely that the slope-based TDVs used the actual data to develop a slope value and the BMD21 TDV uses the fitted Hill coefficient. In all three cases, the fitted Hill coefficients had low values and the fits were performed on data with six or fewer dose values.
Another example of this type of quantitative MOA analysis can be found in recent work on the MOA of dioxin liver carcinogenesis in rats (CitationBudinsky et al. 2014, CitationSimon et al. 2009). Both papers present figures showing dose-response plots of different events in the MOA ordered by increasing Kd values and increasing Hill coefficients.
In all likelihood, statisticians can think of much more sophisticated analyses using the slope of the dose-response. Such approaches could use expressions for the slope of the dose-response and attempt to discover in what dose ranges the most rapid change occurs. However, for the purposes of working out events within a hypothesized MOA, easily calculated values such as Kd or the TDV can be very useful.
There may be additional insight gained from using a baseline projection method similar to that obtained at the half-maximal response level using the procedure of CitationMurrell et al. (1998). provides equations for commonly used empirical dose-response models, the corresponding inverse equations that solve for dose as the independent variable based on a chosen response, and equations for the dose-response slope at any point. In some instances, these equations can be used to project to the baseline or zero response using the slope at the chosen level of response (; Supplementary Content). The inverse equations in simply express the dose corresponding to a chosen fractional response (assuming “1” is the maximal response). Using these equations should prove simpler than obtaining an implicit solution. The slope equations in provide a means of calculating the slope at the benchmark point (BMD, BMR).
Baseline projection from the 21% response level is shown graphically in . Although the values for the EC50 are very close, the BMD21 values differ by a factor of 2 and the baseline projections from the 21% response level differ by over three-fold. An examination of these differences may help discover the sequence of KEs in a proposed MOA.
As noted, the Supplementary Content provides another example calculation of this baseline projection method that incorporates both the location and steepness of the dose-response at a chosen point and how to use such information in thinking about a hypothesized MOA.
Comparing the values of the Hill coefficients of various events in a hypothesized MOA may provide additional insight and contribute to the decision of whether to assume the adverse outcome follows a linear or nonlinear MOA. Ligand binding and the constellation of early steps in gene transcription may have Hill coefficients close to unity and thus their dose-response might be considered linear (CitationMurrell et al. 1998, CitationBudinsky et al. 2014). KEs that have Hill coefficients with values of 2 or greater invariably indicate the MOA for the adverse outcome will be nonlinear (CitationChow et al. 2011).
Log-steepness, measured by the ratio of the BMD10 to the BMD05, was considered for use in ordering events with a hypothesized MOA (CitationSlob and Setzer 2014). The dose-response data provided in EPA (2005c) was used to obtain values of log-steepness for KEs in the MOA of cacodylic acid ( and ; ). The three KEs are cytotoxicity, proliferation, and hyperplasia occurring at 10 weeks (). Appendix D of this EPA publication contains the BMDS output for these three KEs. The values for log-steepness calculated as the BMD ratio for these three KEs (cytotoxicity, proliferation, and hyperplasia) were 2.1, 1.1, and 1.4, respectively. CitationSlob and Setzer (2014) note that log-steepness estimated as the BMD ratio is imprecise, and, while this is only a single example, this easily calculated value did not prove helpful in ordering KEs within a hypothesized MOA. Further work is needed to determine whether this measure of log-steepness can indeed help inform details of MOA.
Constructing a Dose-Time Concordance Table may also help to identify late occurring KEs. These late KEs in the modes of action of complex adverse outcomes such as cancer or developmental effects, may be highly nonlinear and will likely have high-valued Hill coefficients (CitationBrown et al. 2012, CitationHanahan and Weinberg 2000, Citation2011, CitationSimon et al. 2009). In some cases, sufficient information about the MOA will be available to select some KEs to use as appropriate precursors to the adverse outcome such as was done by EPA for dimethylarsinic acid. The ability to select appropriate precursor KEs will require quantitative knowledge of the relationship between that KE and the adverse outcome. When the knowledge is available, such precursor events can be used as the basis for risk assessment (CitationSimon et al. 2009, CitationUSEPA 2005a, CitationThompson et al. 2014).
Application of knowledge of the MOA for uterotrophy in risk assessment
A number of host, life stage, and environmental factors likely will modulate human responses to chemicals shown to be estrogenic in the uterotrophic assay and in surrogate in vitro assays. Because many potentially estrogenic chemicals contain one or more hydroxyl groups that interact with specific ligand-binding pockets in ERα, the metabolism of these chemicals in the enterocytes lining the gastrointestinal tract and the liver may result in their inactivation. Hence, for some chemicals, first pass serves as a detoxification process.
For example, bisphenol A (BPA) is almost completely inactivated by phase II metabolism in enterocytes and liver by both glucuronidation and sulfation. These processes occur in both humans and rats (CitationHengstler et al. 2011). Differences in glucuronidation and sulfation of BPA in rats and humans exist and may provide the basis for interspecies extrapolation of metabolism and consequent bioavailability of BPA (CitationMazur et al. 2010). Alternatively, these data may be used to improve PBPK models of BPA (CitationFisher et al. 2011, CitationTeeguarden et al. 2005).
Modulating factors for estrogenic responses in humans
After oral ingestion, it is not possible to detect free BPA in plasma in adult humans (CitationWillhite et al. 2008). PBPK modeling suggests that levels of free BPA in very young children may be higher than in adults due to lower glucuronidation capacity during the first 2 months of life (CitationEdginton and Ritter 2009, CitationMielke and Gundert-Remy 2009). Free BPA has been detected in the urine of premature infants in neonatal intensive care and its source may be medical devices and the need to deliver medical interventions directly via the blood (CitationCalafat et al. 2009). In contrast, free BPA has not been detected in the urine of full-term healthy infants up to 44 days in age (CitationNachman et al. 2013). This fact suggests that the glucuronidation capacity in healthy infants is sufficient to metabolize BPA from environmental exposures.
Polymorphisms in uridine 5’-diphospho-glucuronosyltransferase enzymes that conjugate glucuronide may be a potential ModF (CitationAllegaert et al. 2009, CitationCourt 2010, CitationGirard et al. 2007, CitationGuillemette et al. 2010, CitationKrekels et al. 2012, CitationMercke Odeberg et al. 2006, CitationMiyagi and Collier 2011, CitationStrassburg et al. 1997, Citationde Wildt et al. 1999). As noted, differences in glucuronidation occur with gender and age. Diet may also be a factor in the ability to inactivate estrogenic chemicals (CitationNavarro et al. 2009, Citation2011, CitationSaracino et al. 2009). In all cases of oral exposure, the actual exposure needs to be considered in a quantitative fashion—the inability to detect free BPA in the urine of normal infants suggests that exposures may be sufficiently low that glucuronidation is essentially complete (e.g., CitationYe et al. 2012). There may be exposures to estrogenic chemicals by routes other than oral, for example, dermal or inhalation, for which glucuronidation does not occur. However, these exposures appear to be miniscule (CitationGeens et al. 2012).
The occurrence of male reproductive tract pathologies in offspring of women administered diethylstilbestrol (DES) during pregnancy suggests that both a lowest-observed- adverse-effect level and a NOAEL exist for these developmental effects. Because no formal clinical trials had been conducted with DES, the total dose varied among clinics by an order of magnitude or more. Male reproductive tract abnormalities were observed in offspring of mothers receiving higher total doses of DES, that is, 12–18 g during pregnancy (CitationDietrich 2010, CitationGolden et al. 1998), whereas no clear increase was observed in reproductive tract effects in offspring of mothers administered 1.4 g of DES during pregnancy (CitationLeary et al. 1984).
Exposure to more than one estrogenic chemical, such as dietary phytoestrogens, may interact with, or complement, endogenous or other exogenous chemicals. As noted, at sufficient doses, estrogenic chemicals act as anti-androgens in males. However, dose addition of these chemicals is unlikely unless at least two of the doses occur in the rising portion of the dose–response curve (CitationBorgert et al. 2012). Quantitative aspects of dose-response such as affinity, efficacy, and potency need to be considered for chemicals that act via receptor binding—simply using dose addition and some measure of relative potency will be inadequate for risk assessment (CitationBorgert et al. 2012).
The examination of the MOA for uterotrophy requires in vivo measurement of the adverse outcome/apical endpoint and includes in vitro measurements of the MIE, genomic data, and physiological measures of KEs. Hence, this example demonstrates the use of data from tiers 1–4 of the toxicity resource pyramid of the RISK21 Roadmap (), and illustrates the strength of MOA analyses in terms of generating data useful for risk assessment purposes.
Discussion
The MOA/HRF along with the Q-KEDRF described here provides a strong foundation for using the information gathered as a means of reducing uncertainty in risk assessments. The KEDRF laid out the approach for harnessing the extensive available data for the KEs within a putative MOA. The Q-KEDRF provides additional tools with which to gain further insights about how the KEs relate to each other and to the adverse outcome/apical event in a quantitative way in both the dose- and time-dimensions.
In risk assessment, the greatest quantitative impact comes from the choice of a linear approach versus a nonlinear approach for modeling the dose-response for the critical effect or apical effect of concern. The dose-responses for the KEs can be used to inform the shape of the dose-response for the apical effect of concern. For receptor-mediated effects, as noted, quantitative dose-response modeling can provide much greater understanding. For example, if the dose-responses of some or all KEs exhibit biological thresholds, for example, cytotoxicity of the liver and kidney induced by chloroform (CitationAndersen et al. 2000), then the combination of events will also display a dose threshold. Alternatively, if the dose-responses for KEs do not exhibit dose thresholds, then the combination of events may result in a linear dose-response for the apical event. The ability to calculate possible threshold or transition dose values from quantitative dose-response modeling provides a means to determine whether linear or nonlinear extrapolation is appropriate ().
It is increasingly clear that account has to be taken of those ModFs that could influence the shape of the dose–response curve, the efficacy or magnitude of the apical response or selected critical effect, and the potency or location along the dose continuum. For example, how much variation can be expected for a particular ModF? Again, this depends on the underlying biology. Sufficient variation may “linearize” the dose-response of the apical event (CitationConolly et al. 2005, CitationLutz 2001). The question then is: will this amount of variation “linearize” the population dose-response to a sufficient extent to support the choice of linear low-dose extrapolation? As a generalization, ModFs that are likely to modify the dose-response characterization as part of the risk assessment process will be relatively frequent in the population (given that dose-response is a population feature). Some of these ModFs are “inevitable” and are characteristics of the general population (sex, age, and genotype); others are “manageable” and are characteristic of specific subpopulations (smoking, diet, and weight). Additional research on this topic and the overall role of ModFs is essential to inform the consideration of ModFs and their effect on MOA as part of problem formulation.
At this point in the history of risk assessment, the utility of the Q-KEDRF remains to be determined: experience in conducting real-world risk assessments will demonstrate any value added. Certainly, the Dose-Time Concordance table and Dose-Response Species Concordance table for KEs and ModFs (–4) should provide a significant amount of help. The National Research Council recently reviewed EPA's Formaldehyde risk assessment and as part of that review, suggested that the documentation for chemical-specific risk assessments in the IRIS program be organized around informative tables (CitationNRC 2011). The Dose-Time and Dose-Response Species Concordance tables could be very useful in that effort.
At present, the full utility of the Q-KEDRF has barely begun to be realized. The example of rat uterotrophy, while being arguably the best documented physiological response to the extensively studied steroid hormones, clearly demonstrates not only the shortcomings in the available data but also how much actual insight can be acquired through the development of a Q-KEDRF for a specific response. The Q-KEDRF will likely change as experience in using it is gained. Nonetheless, some of the basic issues discussed here will likely become hallmarks of any framework implemented to understand the MOA of a particular adverse outcome. These issues include: (1) separating KEs from putative KEs and (2) understanding the relationship between KEs based upon their dose-response and the timing of their occurrence. Use of this information can significantly improve risk assessments by reducing uncertainty and fostering the incorporation of this information into easy-to-use tables.
Acknowledgments
The authors gratefully acknowledge the government, academic, and industry scientists of the HESI RISK21 Dose-Response Subteam and the HESI RISK21 Steering Team for their contributions to this work. (For a full list of RISK21 participants, see http://www.risk21.org). In particular, the authors thank Dr. Bette Meek (University of Ottawa, Canada) for her critical review of the manuscript. We also thank Dr. Carson Chow (National Institute of Diabetes and Digestive and Kidney Diseases, National Institutes of Health) for his helpful and insightful comments.
Declaration of interest
This manuscript was prepared under the auspices of the International Life Sciences Institute Health and Environmental Sciences Institute (ILSI HESI), a non-profit organization aimed at engaging scientists from academia, government, industry, research institutes, and NGOs to identify and resolve global health and environmental issues. ILSI HESI collects funding from member companies to support projects. The authors’ affiliations are as shown on the cover page. The authors had sole responsibility for the writing and content of the paper. The views and opinions expressed in the paper are those of the authors, and do not necessarily reflect the views of the authors’ employers or the opinions or policies of the US EPA or NIH. Mention of trade names does not constitute endorsement. None of the authors has recently or is currently involved as an expert witness in litigation or formal government rule-making on the subject of this paper. The authors employed by ILSI HESI participated as part of their normal employment. No other authors received financial support or an honorarium in the preparation of this paper. The authors declare that there are no conflicts of interest.
http://informahealthcare.com/doi/abs/10.3109/10408444.2014.931925
Download PDF (69.9 KB)References
- Adami HO, Berry SC, Breckenridge CB, Smith LL, Swenberg JA, Trichopoulos D, et al. (2011). Toxicology and epidemiology: improving the science with a framework for combining toxicological and epidemiological evidence to establish causal inference. Toxicol Sci, 122, 223–34.
- Adeleye Y, Andersen M, Clewell R, Davies M, Dent M, Edwards S, et al. (2014). Implementing toxicity testing in the 21st century (TT21C): making safety decisions using toxicity pathways, and progress in a prototype risk assessment. Toxicology, pii: S0300-483X(14)00032-8. doi: 10.1016/j.tox.2014.02.007. [Epub ahead of print].
- Adkins S, Gan KN, Mody M, La Du BN. (1993). Molecular basis for the polymorphic forms of human serum paraoxonase/arylesterase: glutamine or arginine at position 191, for the respective A or B allozymes. Am J Hum Genet, 52, 598–608.
- Albers JW, Berent S, Garabrant DH, Giordani B, Schweitzer SJ, Garrison RP, Richardson RJ. (2004a). The effects of occupational exposure to chlorpyrifos on the neurologic examination of central nervous system function: a prospective cohort study. J Occup Environ Med, 46, 367–78.
- Albers JW, Garabrant DH, Berent S, Richardson RJ. (2010). Paraoxonase status and plasma butyrylcholinesterase activity in chlorpyrifos manufacturing workers. J Expo Sci Environ Epidemiol, 20, 79–89.
- Albers JW, Garabrant DH, Mattsson JL, Burns CJ, Cohen SS, Sima C, et al. (2007). Dose-effect analyses of occupational chlorpyrifos exposure and peripheral nerve electrophysiology. Toxicol Sci, 97, 196–204.
- Albers JW, Garabrant DH, Schweitzer S, Garrison RP, Richardson RJ, Berent S. (2004b). Absence of sensory neuropathy among workers with occupational exposure to chlorpyrifos. Muscle Nerve, 29, 677–86.
- Albers JW, Garabrant DH, Schweitzer SJ, Garrison RP, Richardson RJ, Berent S. (2004c). The effects of occupational exposure to chlorpyrifos on the peripheral nervous system: a prospective cohort study. Occup Environ Med, 61, 201–11.
- Alexander BH, Burns CJ, Bartels MJ, Acquavella JF, Mandel JS, Gustin C, Baker BA. (2006). Chlorpyrifos exposure in farm families: results from the farm family exposure study. J Expo Sci Environ Epidemiol, 16, 447–56.
- Allegaert K, Vanhaesebrouck S, Verbesselt R, van den Anker JN. (2009). In vivo glucuronidation activity of drugs in neonates: extensive interindividual variability despite their young age. Ther Drug Monit, 31, 411–15.
- Andersen ME, Meek E, Boorman GA, Brusick DJ, Cohen SM, Dragan YP, et al. (2000). Lessons learned in applying the U.S. EPA proposed cancer guidelines to specific compounds. Toxicol Sci, 53, 159–72.
- Andersen ME, Preston RJ, Maier A, Willis AM, Patterson J. (2014). Dose-response approaches for nuclear receptor-mediated modes of action for liver carcinogenicity: results of a workshop. Crit Rev Toxicol, 44, 50–63.
- Ankley GT, Bennett RS, Erickson RJ, Hoff DJ, Hornung MW, Johnson RD, et al. (2010). Adverse outcome pathways: a conceptual framework to support ecotoxicology research and risk assessment. Environ Toxicol Chem, 29, 730–41.
- Ashby J, Tinwell H, Soames A, Foster J. (1999). Induction of hyperplasia and increased DNA content in the uterus of immature rats exposed to coumestrol. Environ Health Perspect, 107, 819–22.
- Aviram M, Dornfeld L, Rosenblat M, Volkova N, Kaplan M, Coleman R, et al. (2000). Pomegranate juice consumption reduces oxidative stress, atherogenic modifications to LDL, and platelet aggregation: studies in humans and in atherosclerotic apolipoprotein E-deficient mice. Am J Clin Nutr, 71, 1062–76.
- Beyer LA, Beck BD, Lewandowski TA. (2011). Historical perspective on the use of animal bioassays to predict carcinogenicity: evolution in design and recognition of utility. Crit Rev Toxicol, 41, 321–38.
- Blackford JA Jr, Guo C, Zhu R, Dougherty EJ, Chow CC, Simons SS Jr. (2012). Identification of location and kinetically defined mechanism of cofactors and reporter genes in the cascade of steroid-regulated transactivation. J Biol Chem, 287, 40982–95.
- Boekelheide K, Andersen ME. (2010). A mechanistic redefinition of adverse effects - a key step in the toxicity testing paradigm shift. ALTEX, 27, 243–52.
- Boekelheide K, Campion SN. (2010). Toxicity testing in the 21st century: using the new toxicity testing paradigm to create a taxonomy of adverse effects. Toxicol Sci, 114, 20–4.
- Boobis AR, Cohen SM, Dellarco V, McGregor D, Meek ME, Vickers C, et al. (2006). IPCS framework for analyzing the relevance of a cancer mode of action for humans. Crit Rev Toxicol, 36, 781–92.
- Boobis AR, Daston GP, Preston RJ, Olin SS. (2009). Application of key events analysis to chemical carcinogens and noncarcinogens. Crit Rev Food Sci Nutr, 49, 690–707.
- Boobis AR, Doe JE, Heinrich-Hirsch B, Meek ME, Munn S, Ruchirawat M, et al. (2008). IPCS framework for analyzing the relevance of a noncancer mode of action for humans. Crit Rev Toxicol, 38, 87–96.
- Borgert CJ, Sargent EV, Casella G, Dietrich DR, McCarty LS, Golden RJ. (2012). The human relevant potency threshold: reducing uncertainty by human calibration of cumulative risk assessments. Regul Toxicol Pharmacol, 62, 313–28.
- Bretz F, Pinheiro JC, Branson M. (2005). Combining multiple comparisons and modeling techniques in dose-response studies. Biometrics, 61, 738–48.
- Briggs K, Cases M, Heard DJ, Pastor M, Pognan F, Sanz F, et al. (2012). Inroads to predict in vivo toxicology-an introduction to the eTOX project. Int J Mol Sci, 13, 3820–46.
- Brophy VH, Jampsa RL, Clendenning JB, McKinstry LA, Jarvik GP, Furlong CE. (2001). Effects of 5’ regulatory-region polymorphisms on paraoxonase-gene (PON1) expression. Am J Hum Genet, 68, 1428–36.
- Brown ES, Jacobs A, Fitzpatrick S. (2012). Reproductive and developmental toxicity testing: from in vivo to in vitro. ALTEX, 29, 333–9.
- Buchanan RL, Havelaar AH, Smith MA, Whiting RC, Julien E. (2009). The key events dose-response framework: its potential for application to foodborne pathogenic microorganisms. Crit Rev Food Sci Nutr, 49, 718–28.
- Budinsky RA, LeCluyse EL, Ferguson SS, Rowlands JC, Simon T. (2010). Human and rat primary hepatocyte CYP1A1 and 1A2 induction with 2,3,7,8-tetrachlorodibenzo-p-dioxin, 2,3,7,8-tetrachlorodibenzofuran, and 2,3,4,7,8-pentachlorodibenzofuran. Toxicol Sci, 118, 224–35.
- Budinsky RA, Schrenk D, Simon T, van den Berg M, Reichard JF, Silkworth JB, et al. (2014). Mode of action and dose-response framework analysis for receptor-mediated toxicity: the aryl hydrocarbon receptor as a case study. Crit Rev Toxicol, 44, 83–119.
- Calafat AM, Weuve J, Ye X, Hu H, Ringer S, Huttner K, Hauser R. (2009). Exposure to bisphenol A and other phenols in neonatal intensive care unit premature infants. Environ Health Perspect, 117, 639–44.
- Chapman K, Holmes M, Seckl J. (2013). 11β-hydroxysteroid dehydrogenases: intracellular gate-keepers of tissue glucocorticoid action. Physiol Rev, 93, 1139–206.
- Charlier TD. (2009). Importance of steroid receptor coactivators in the modulation of steroid action on brain and behavior. Psychoneuroendocrino, 34, S20–9.
- Chow CC, Ong KM, Dougherty EJ, Simons SS Jr. (2011). Inferring mechanisms from dose-response curves. Methods Enzymol, 487, 465–83.
- Clark JH, Markaverich BM. (1984). The agonistic and antagonistic actions of estriol. J Steroid Biochem, 20, 1005–13.
- Cohen SM. (1995). Role of urinary physiology and chemistry in bladder carcinogenesis. Food Chem Toxicol, 33, 715–30.
- Cohen SM, Arnold LL. (2011). Chemical carcinogenesis. Toxicol Sci, 120, S76–92.
- Cohen SM, Arnold LL, Lewis AS, Beck BD. (2006). Methylated arsenicals: the implications of metabolism and carcinogenicity studies in rodents to human risk assessment. Crit Rev Toxicol, 36, 99–133.
- Cohen SM, Ellwein LB. (1990). Cell proliferation in carcinogenesis. Science, 249, 1007–11.
- Cohen SM, Klaunig J, Meek ME, Hill RN, Pastoor T, Lehman-Mckeeman L, et al. (2004). Evaluating the human relevance of chemically induced animal tumors. Toxicol Sci, 78, 181–6.
- Cohen SM, Meek ME, Klaunig JE, Patton DE, Fenner-Crisp PA. (2003). The human relevance of information on carcinogenic modes of action: overview. Crit Rev Toxicol, 33, 581–9.
- Conolly RB, Gaylor DW, Lutz WK. (2005). Population variability in biological adaptive responses to DNA damage and the shapes of carcinogen dose-response curves. Toxicol Appl Pharmacol, 207, 570–5.
- Corton JC, Cunningham ML, Hummer BT, Lau C, Meek B, Peters JM, et al. (2014). Mode of action framework analysis for receptor-mediated toxicity: the peroxisome proliferator-activated receptor alpha (PPARα) as a case study. Crit Rev Toxicol, 44, 1–49.
- Costa LG, Giordano G, Furlong CE. (2011). Pharmacological and dietary modulators of paraoxonase 1 (PON1) activity and expression: the hunt goes on. Biochem Pharmacol, 81, 337–44.
- Court MH. (2010). Interindividual variability in hepatic drug glucuronidation: studies into the role of age, sex, enzyme inducers, and genetic polymorphism using the human liver bank as a model system. Drug Metab Rev, 42, 209–24.
- Curtis SW, Washburn T, Sewall C, DiAugustine R, Lindzey J, Couse JF, Korach KS. (1996). Physiological coupling of growth factor and steroid receptor signaling pathways: estrogen receptor knockout mice lack estrogen-like response to epidermal growth factor. Proc Natl Acad Sci USA, 93, 12626–30.
- Das SK, Taylor JA, Korach KS, Paria BC, Dey SK, Lubahn DB. (1997). Estrogenic responses in estrogen receptor-alpha deficient mice reveal a distinct estrogen signaling pathway. Proc Natl Acad Sci USA, 94, 12786–91.
- de Wildt SN, Kearns GL, Leeder JS, van den Anker JN. (1999). Glucuronidation in humans. Pharmacogenetic and developmental aspects. Clin Pharmacokinet, 36, 439–52.
- Deakin SP, James RW. (2004). Genetic and environmental factors modulating serum concentrations and activities of the antioxidant enzyme paraoxonase-1. Clin Sci (Lond), 107, 435–47.
- Dellarco V, Fenner-Crisp PA. (2012). Mode of action: moving toward a more relevant and efficient assessment paradigm. J. Nutr, 142, 2192S–8S.
- Dietrich DR. (2010). Courage for simplification and imperfection in the 21st century assessment of “Endocrine disruption”. ALTEX, 27, 264–78.
- Dougherty EJ, Guo C, Simons SS Jr, Chow, CC. (2012). Deducing the temporal order of cofactor function in ligand-regulated gene transcription: theory and experimental verification. PLoS One, 7, e30225.
- EC (European Commission Joint Research Centre). (2003). Technical Guidance Document on Risk Assessment, Part II.
- EC (European Commission) 2008. Regulation (European Commission) No, 1272/2008 of the European Parliament and of the Council of 16 December 2008 on classification, labelling and packaging of substances and mixtures amending and repealing Directives 67/548/EEC and 1999/45/EEC, and amending Regulation (EC) No. 1907/2006.
- Edginton AN, Ritter L. (2009). Predicting plasma concentrations of bisphenol A in children younger than 2 years of age after typical feeding schedules, using a physiologically base toxicokinetic model. Environ Health Perspect, 117, 645–52.
- EFSA (European Food Safety Authority). (2005). Opinion of a Scientific Committee on a request from EFSA related to A Harmonised Approach for Risk Assessment of Substances Which Are Both Genotoxic and Carcinogenic.
- Elcombe CR, Peffer RC, Wolf DC, Bailey J, Bars R, Bell D, et al. (2014). Mode of action and human relevance analysis for nuclear receptor-mediated liver toxicity: a case study with phenobarbital as a model constitutive androstane receptor (CAR) activator. Crit Rev Toxicol, 44, 64–82.
- Evans MV, Dowd SM, Kenyon EM, Hughes MF, El-Masri HA. (2008). A physiologically based pharmacokinetic model for intravenous and ingested dimethylarsinic acid in mice. Toxicol Sci, 104, 250–60.
- Farley DB, Ford SP, Rosazza, JP. (1992). Increase in uterine peroxidase activity in the rat uterus during oestrogen hyperaemia. J Reprod Fertil, 95, 551–8.
- Faustman EM, Ponce RA, Seeley MR, Whittaker SG. (1997). Experimental approaches to evaluate mechanisms of developmental toxicity. Handbook of developmental toxicology. New York: CRC Press, Inc;,
- Fisher JW, Twaddle NC, Vanlandingham M, Doerge DR. (2011). Pharmacokinetic modeling: prediction and evaluation of route dependent dosimetry of bisphenol A in monkeys with extrapolation to humans. Toxicol Appl Pharmacol, 257, 122–36.
- Furr BJ, Jordan VC. (1984). The pharmacology and clinical uses of tamoxifen. Pharmacol Ther, 25, 127–205.
- Gamble MV, Hall MN. (2012). Relationship of creatinine and nutrition with arsenic metabolism. Environ Health Perspect, 120, A145–6.
- Garabrant DH, Aylward LL, Berent S, Chen Q, Timchalk C, Burns CJ, et al. (2009). Cholinesterase inhibition in chlorpyrifos workers: characterization of biomarkers of exposure and response in relation to urinary TCPy. J Expo Sci Environ Epidemiol, 19, 634–42.
- Geens T, Aerts D, Berthot C, Bourguignon JP, Goeyens L, Lecomte P, et al. (2012). A review of dietary and non-dietary exposure to bisphenol-A. Food Chem Toxicol, 50, 3725–40.
- Giangrande PH, Kimbrel EA, Edwards DP, McDonnell DP. (2000). The opposing transcriptional activities of the two isoforms of the human progesterone receptor are due to differential cofactor binding. Mol Cell Biol, 20, 3102–15.
- Girard H, Lévesque E, Bellemare J, Journault K, Caillier B, Guillemette C. (2007). Genetic diversity at the UGT1 locus is amplified by a novel 3’ alternative splicing mechanism leading to nine additional UGT1A proteins that act as regulators of glucuronidation activity. Pharmacogenet Genomics, 17, 1077–89.
- Golden RJ, Noller KL, Titus-Ernstoff L, Kaufman RH, Mittendorf R, Stillman R, Reese EA. (1998). Environmental endocrine modulators and human health: an assessment of the biological evidence. Crit Rev Toxicol, 28, 109–227.
- Gori GB. (2013). Regulatory forum opinion piece: long-term animal bioassays: is the end near?Toxicol Pathol, 41, 805–7.
- Gorski J, Stormshak F, Harris J, Wertz N. (1977). Hormone regulation of growth: stimulatory and inhibitory influences of estrogens on DNA synthesis. J Toxicol Environ Health, 3, 271–9.
- Goutelle S, Maurin M, Rougier F, Barbaut X, Bourguignon L, Ducher M, Maire P. (2008). The Hill equation: a review of its capabilities in pharmacological modelling. Fundam Clin Pharmacol, 22, 633–48.
- Guillemette C, Lévesque E, Harvey M, Bellemare J, Menard V. (2010). UGT genomic diversity: beyond gene duplication. Drug Metab Rev, 42, 24–44.
- Guzelian PS, Victoroff MS, Halmes NC, James RC, Guzelian CP. (2005). Evidence-based toxicology: a comprehensive frame-work for causation. Hum Exp Toxicol, 24, 161–201.
- Hanahan D, Weinberg RA. (2000). The hallmarks of cancer. Cell, 100, 57–70.
- Hanahan D, Weinberg RA. (2011). Hallmarks of cancer: the next generation. Cell, 144, 646–74.
- Hartung T, McBride M. (2011). Food for thought … on mapping the human toxome. ALTEX, 28, 83–93.
- Health Canada. (1999). Voluntary pesticide resistance-management labelling based on target site/mode of action.
- Health Canada. (2009). Guidelines for Canadian drinking water quality: guideline technical document—Benzene.
- Health Canada. (2011). Guidelines for Canadian drinking water quality: guideline technical document— N-Nitrosodimethylamine (NDMA).
- Heneweer M, Houtman R, Poortman J, Groot M, Maliepaard C, Peijnenburg A. (2007). Estrogenic effects in the immature rat uterus after dietary exposure to ethinylestradiol and zearalenone using a systems biology approach. Toxicol Sci, 99, 303–14.
- Hengstler JG, Foth H, Gebel T, Kramer PJ, Lilienblum W, Schweinfurth et al. (2011). Critical evaluation of key evidence on the human health hazards of exposure to bisphenol A. Crit Rev Toxicol, 41, 263–91.
- Hill AB. (1965). The Environment and disease: association or Causation?. Proc R Soc Med, 58, 295–300.
- Hill AV. (1910). The possible effects of the aggregation of the molecules of haemoglobin on its dissociation curves. J. Physiol Proceedings: iv-vii.
- Hinderliter PM, Price PS, Bartels MJ, Timchalk C, Poet TS. (2011). Development of a source-to-outcome model for dietary exposures to insecticide residues: an example using chlorpyrifos. Regul Toxicol Pharmacol, 61, 82–92.
- Huen K, Harley K, Bradman A, Eskenazi B, Holland N. (2010). Longitudinal changes in PON1 enzymatic activities in Mexican-American mothers and children with different genotypes and haplotypes. Toxicol Appl Pharmacol, 244, 181–9.
- IOM (Institute of Medicine). (2010). Evaluation of Biomarkers and Surrogate Endpoints in Chronic Disease. The National Academies Press.
- John S, Sabo PJ, Thurman RE, Sung MH, Biddie SC, Johnson TA, et al. (2011). Chromatin accessibility pre-determines glucocorticoid receptor binding patterns. Nat Genet, 43, 264–8.
- Judson R, Houck K, Martin M, Knudsen T, Thomas RS, Sipes N, et al. (2014). In Vitro and Modelling Approaches to Risk Assessment from the U.S. Environmental Protection Agency ToxCast Programme. Basic Clin Pharmacol Toxicol, 115, 50–76.
- Julien E, Boobis AR, Olin SS, Ilsi Research Foundation Threshold Working Group. (2009). The Key Events Dose-Response Framework: a cross-disciplinary mode-of-action based approach to examining dose-response and thresholds. Crit Rev Food Sci Nutr, 49, 682–9.
- Kaye AM, Icekson I, Lindner HR. (1971). Stimulation by estrogens of ornithine and S-adenosylmethionine decarboxylases in the immature rat uterus. Biochim Biophys Acta, 252, 150–9.
- Kirman CR, Hays SM, Aylward LL, Suh M, Harris MA, Thompson CM, et al. (2012). Physiologically based pharmacokinetic model for rats and mice orally exposed to chromium. Chem Biol Interact, 200, 45–64.
- Klotz DM, Hewitt SC, Ciana P, Raviscioni M, Lindzey JK, Foley J, et al. (2002). Requirement of estrogen receptor-alpha in insulin-like growth factor-1 (IGF-1)-induced uterine responses and in vivo evidence for IGF-1/estrogen receptor cross-talk. J Biol Chem, 277, 8531–537.
- Kobayashi S, Stice JP, Kazmin D, Wittmann BM, Kimbrel EA, Edwards DP, et al. (2010). Mechanisms of progesterone receptor inhibition of inflammatory responses in cellular models of breast cancer. Mol Endocrinol, 24, 2292–302.
- Koshland DE. (1996). The structural basis of negative cooperativity: receptors and enzymes. Curr Opin Struct Biol, 6, 757–61.
- Koshland DE, Hamadani K. (2002). Proteomics and models for enzyme cooperativity. J Biol Chem, 277, 46841–4.
- Kraus WL, Weis KE, Katzenellenbogen BS. (1995). Inhibitory cross-talk between steroid hormone receptors: differential targeting of estrogen receptor in the repression of its transcriptional activity by agonist- and antagonist-occupied progestin receptors. Mol Cell Biol, 15, 1847–57.
- Krekels EH, Danhof M, Tibboel D, Knibbe CA. (2012). Ontogeny of hepatic glucuronidation; methods and results. Curr Drug Metab, 13, 728–43.
- Landesmann B, Mennecozzi M, Berggren E, Whelan M. (2013). Adverse outcome pathway-based screening strategies for an animal-free safety assessment of chemicals, Altern Lab Anim,41, 461–71.
- Leary FJ, Resseguie LJ, Kurland LT, O’brien PC, Emslander RF, Noller KL. (1984). Males exposed in utero to diethylstilbestrol. JAMA, 252, 2984–9.
- Lehman-McKeeman LD, Rodriguez PA, Takigiku R, Caudill D, Fey ML. (1989). d-Limonene-induced male rat-specific nephrotoxicity: Evaluation of the association between d-limonene and alpha 2u-globulin. Toxicol Appl Pharmacol, 99, 250–9.
- Levin E, Actis AM, Lopez S. (1993). Characterization of rat uterine estrogen receptors in vivo. J Steroid Biochem Mol Biol, 44, 277–85.
- Levine M. (2011). Paused RNA polymerase II as a developmental checkpoint. Cell, 145, 502–11.
- Levitzki A, Koshland DE. (1969). Negative cooperativity in regulatory enzymes. Proc Natl Acad Sci U. S. A, 62, 1121–8.
- Liteplo RG, Meek ME. (2003). Inhaled formaldehyde: Exposure estimation, hazard characterization and exposure-response analysis. J Toxicol Environ Health B Crit Rev, 6, 85–114.
- Lutz WK. (2001). Susceptibility differences in chemical carcinogenesis linearize the dose-response relationship: threshold doses can be defined only for individuals. Mutat Res, 482, 71–6.
- Lutz WK, Lutz RW. (2009). Statistical model to estimate a threshold dose and its confidence limits for the analysis of sublinear dose-response relationships, exemplified for mutagenicity data. Mutat Res, 678, 118–22.
- Lyttle CR, Desombre ER. (1977). Uterine peroxidase as a marker for estrogen action. Proc Natl Acad Sci U. S. A, 74, 3162–6.
- Maier A, Kohrman-Vincent M, Hertzberg R, Allen B, Haber LT, Dourson M. (2012). Critical review of dose-response options for F344 rat mammary tumors for acrylamide - additional insights based on mode of action. Food Chem Toxicol, 50, 1763–75.
- Mazur CS, Kenneke JF, Hess-Wilson JK, Lipscomb JC. (2010). Differences between human and rat intestinal and hepatic bisphenol A glucuronidation and the influence of alamethicin on in vitro kinetic measurements. Drug Metab Dispos, 38, 2232–8.
- Meek ME. (2008). Recent developments in frameworks to consider human relevance of hypothesized modes of action for tumours in animals. Environ Mol Mutagen, 49, 110–16.
- Meek ME, Boobis A, Cote I, Dellarco V, Fotakis G, Munn S, et al. (2014b). New developments in the evolution and application of the WHO/IPCS framework on mode of action/species concordance analysis. J Appl Toxicol, 34, 1–18.
- Meek ME, Bucher JR, Cohen SM, Dellarco V, Hill RN, Lehman-Mckeeman LD, et al. (2003). A framework for human relevance analysis of information on carcinogenic modes of action. Crit. Rev. Toxicol, 33, 591–653.
- Meek ME, Palermo CM, Bachman AN, North CM, Jeffrey Lewis R. (2014a). Mode of action human relevance (species concordance) framework: Evolution of the Bradford Hill considerations and comparative analysis of weight of evidence. J Appl Toxicol, 34, 595–606.
- Mercke Odeberg J, Andradem J, Holmberg K, Hoglund P, Malmqvist U, Odeberg J. (2006). UGT1A polymorphisms in a Swedish cohort and a human diversity panel, and the relation to bilirubin plasma levels in males and females. Eur J Clin Pharmacol, 62, 829–37.
- Mielke H, Gundert-Remy U. (2009). Bisphenol A levels in blood depend on age and exposure. Toxicol Lett, 190, 32–40.
- Mileson BE, Chambers JE, Chen WL, Dettbarn W, Ehrich M, Eldefrawi AT, et al. (1998). Common mechanism of toxicity: a case study of organophosphorus pesticides. Toxicol Sci, 41, 8–20.
- Miyagi SJ, Collier AC. (2011). The development of UDP-glucuronosyltransferases 1A1 and 1A6 in the pediatric liver. Drug Metab Dispos, 39, 912–19.
- Murrell JA, Portier CJ, Morris RW. (1998). Characterizing dose-response: I: Critical assessment of the benchmark dose concept. Risk Anal, 18, 13–26.
- Nachman RA, Fox SD, Golden C, Sibinga E, Veenstra TD, Groopman JD, Lees PSJ. (2013). Urinary Free Bisphenol A and Bisphenol A-Glururonide Concentrations in Newborns. J Pediatr, 162, 870–2.
- Naciff JM, Overmann GJ, Torontali SM, Carr GJ, Tiesman JP, Richardson BD, Daston GP. (2003). Gene expression profile induced by 17 alpha-ethynyl estradiol in the prepubertal female reproductive system of the rat. Toxicol Sci, 72, 314–30.
- Navarro SL, Chen Y, Li L, Li SS, Chang JL, Schwarz Y, et al. (2011). UGT1A6 and UGT2B15 polymorphisms and acetaminophen conjugation in response to a randomized, controlled diet of select fruits and vegetables. Drug Metab Dispos, 39, 1650–7.
- Navarro SL, Peterson S, Chen C, Makar KW, Schwarz Y, King IB, Li SS, Li L, Kestin M, Lampe JW. (2009). Cruciferous vegetable feeding alters UGT1A1 activity: diet- and genotype-dependent changes in serum bilirubin in a controlled feeding trial. Cancer Prev Res (Phila. Pa), 2, 345–52.
- Notides AC, Lerner N, Hamilton DE. (1981). Positive cooperativity of the estrogen receptor. Proc Natl Acad Sci U. S. A, 78, 4926–30.
- NRC (National Research Council). (1983). Risk Assessment in the Federal Government: Managing the Process.
- NRC (National Research Council). (2007). Toxicity Testing in the Twenty-First Century.
- NRC (National Research Council) 2009. Science and Decisions: Advancing Risk Assessment. Washington, DC: The National Academies Press.
- NRC (National Research Council). (2011). Review of the Environmental Protection Agency’s Draft IRIS Assessment of Formaldehyde.
- NTP (National Toxicology Program). (2006). NTP technical report on the toxicology and carcinogenesis studies of 2,3,7,8-tetrachlorodibenzo-p-dioxin (TCDD) (CAS No 1746-01-6) in female Harlan Sprague-Dawley rats (Gavage Studies). Nat. Toxicol. Program. Tech. Rep. Ser TR,-521.
- OECD (Organisation for Economic Co-Operation and Development). (2003). Detailed Background Review of the Uterotrophic Bioassay. ENV/JM/MONO 2003.
- OECD (Organisation for Economic Co-Operation and Development). (2013). Guidance Document on Developing and Assessing Adverse Outcome Pathways.
- Ong KM, Blackford JA, Kagan BL, Simons SS Jr., Chow CC. (2010). A theoretical framework for gene induction and experimental comparisons. Proc Natl Acad Sci U. S. A, 107, 7107–12.
- Parisi F, Sonderegger B, Wirapati P, Delorenzi M, Naef F. (2009). Relationship between estrogen receptor alpha location and gene induction reveals the importance of downstream sites and cofactors.BMC Genomics, 10, 381.
- Patlewicz G, Simon T, Goyak K, Phillips RD, Rowlands JC, Seidel S, Becker RA. (2013). Use and validation of HT/HC assays to support 21st century toxicity evaluations.Regul Toxicol Pharmacol, 65, 259–68,
- Phillips CV, Goodman KJ. (2004). The missed lessons of Sir Austin Bradford Hill.Epidemiol Perspect Innov, 1, 1–5.
- Phillips CV, Goodman KJ. (2006). Causal criteria and counterfactuals; nothing more (or less) than scientific common sense.Emerg Themes Epidemiol, 3, 1–7.
- Piccirillo VJ, Bird MG, Lewis RJ, Bover WJ. (2012). Preliminary evaluation of the human relevance of respiratory tumors observed in rodents exposed to naphthalene. Regul Toxicol Pharmacol, 62, 433–40.
- Popper K. (1959). In The Logic of Scientific Discovery. New York, NY: Republished by Ruteledge,
- Price PS, Schnelle KD, Cleveland CB, Bartels MJ, Hinderliter PM, Timchalk C, Poet TS. (2011). Application of a source-to-outcome model for the assessment of health impacts from dietary exposures to insecticide residues. Regul Toxicol Pharmacol, 61, 23–31.
- Rao VS, Chaves MC, Ribeiro RA. (1995). Nitric oxide synthase inhibition and the uterotrophic response to oestrogen in immature rats. J Reprod Fertil, 105, 303–6.
- Reiss R, Neal B, Lamb JC, Juberg DR. (2012). Acetylcholinesterase inhibition dose-response modeling for chlorpyrifos and chlorpyrifos-oxon. Regul Toxicol Pharmacol, 63, 124–31.
- Rhomberg LR, Bailey LA, Goodman JE. (2010). Hypothesis-based weight of evidence: a tool for evaluating and communicating uncertainties and inconsistencies in the large body of evidence in proposing a carcinogenic mode of action–naphthalene as an example. Crit Rev Toxicol, 40, 671–96.
- Richter RJ, Jarvik GP, Furlong CE. (2009). Paraoxonase 1 (PON1) status and substrate hydrolysis. Toxicol Appl Pharmacol, 235, 1–9.
- Rock W, Rosenblat M, Miller-Lotan R, Levy AP, Elias M, Aviram M. (2008). Consumption of wonderful variety pomegranate juice and extract by diabetic patients increases paraoxonase 1 association with high-density lipoprotein and stimulates its catalytic activities. J Agric Food Chem, 56, 8704–13.
- Rodgers IS, Baetcke KP. (1993). Interpretation of male rat renal tubule tumors. Environ Health Perspect, 101, 45–52.
- Rosenfeld CR, Cox BE, Roy T, Magness RR. (1996). Nitric oxide contributes to estrogen-induced vasodilation of the ovine uterine circulation. J Clin Invest, 98, 2158–66.
- Ross AC, Russell RM, Miller SA, Munro IC, Rodricks JV, Yetley EA, Julien E. (2009). Application of a key events dose-response analysis to nutrients: a case study with vitamin A (retinol). Crit Rev Food Sci Nutr, 49, 708–17.
- Rowlands JC, Sander M, Bus JS, Futuretox Organizing Committee. (2014). FutureTox: building the road for 21st century toxicology and risk assessment practices. Toxicol Sci, 137, 269–77.
- Sand S, Von Rosen D, Victorin K, Filipsson AF. (2006). Identification of a critical dose level for risk assessment: developments in benchmark dose analysis of continuous endpoints. Toxicol Sci, 90, 241–51.
- Saracino MR, Bigler J, Schwarz Y, Chang JL, Li S, Li L, et al. (2009). Citrus fruit intake is associated with lower serum bilirubin concentration among women with the UGT1A1*28 polymorphism. J Nutr, 139, 555–60.
- Sawilowsky S. (2002). Fermat, Schubert, Einstein and Behrens-Fisher: The Probable Difference Between Two Means When ς12 ≠ ς22. J Modern Appl Stat Meth, 1, 461–72.
- Seed J, Carney EW, Corley RA, Crofton KM, Desesso JM, Foster PM, et al. (2005). Overview: Using mode of action and life stage information to evaluate the human relevance of animal toxicity data. Crit Rev Toxicol, 35, 664–72.
- Sen B, Wang A, Hester SD, Robertson JL, Wolf DC. (2005). Gene expression profiling of responses to dimethylarsinic in female F344 rat urothelium. Toxicology, 215, 214–26.
- Seok J, Warren HS, Cuenca AG, Mindrinos MN, Baker HV, Xu W, et al. (2013). Genomic responses in mouse models poorly mimic human inflammatory diseases. Proc Natl Acad Sci U.S.A, 110, 3507–12.
- Sierksma A, Van Der Gaag MS, Van Tol A, James RW, Hendriks HF. (2002). Kinetics of HDL cholesterol and paraoxonase activity in moderate alcohol consumers. Alcohol Clin Exp Res, 26, 1430–5.
- Silkworth JB, Koganti A, Illouz K, Possolo A, Zhao M, Hamilton SB. (2005). Comparison of TCDD and PCB CYP1A induction sensitivities in fresh hepatocytes from human donors, sprague-dawley rats, and rhesus monkeys and HepG2 cells. Toxicol Sci, 87, 508–19.
- Simon T, Aylward LL, Kirman CR, Rowlands JC, Budinsky RA. (2009). Estimates of cancer potency of 2,3,7,8-tetrachlorodibenzo(p)dioxin using linear and nonlinear dose-response modeling and toxicokinetics. Toxicol Sci, 112, 490–506.
- Simons SS Jr. (2008). What goes on behind closed doors: physiological versus pharmacological steroid hormone actions. Bioessays, 30, 744–56.
- Simons SS Jr. (2010). Glucocorticoid receptor cofactors as therapeutic targets. Curr Opin Pharmacol, 10, 613–19.
- Simons SS Jr, Chow CC. (2012). The road less traveled: new views of steroid receptor action from the path of dose-response curves. Mol Cell Endocrinol, 348, 373–82.
- Slob W, Setzer RW. (2014). Shape and steepness of toxicological dose-response relationships of continuous endpoints. Crit Rev Toxicol, 44, 270–97.
- Smith JN, Timchalk C, Bartels MJ, Poet TS. (2011). In vitro age-dependent enzymatic metabolism of chlorpyrifos and chlorpyrifos-oxon in human hepatic microsomes and chlorpyrifos-oxon in plasma. Drug. Metab. Dispos, 39, 1353–62.
- Sonich-Mullin C, Fielder R, Wiltse J, Baetcke K, Dempsey J, Fenner-Crisp P, et al. (2001). IPCS conceptual framework for evaluating a mode of action for chemical carcinogenesis. Regul Toxicol Pharmacol, 34, 146–52.
- Stice SL, Ford SP, Rosazza JP, Van Orden DE. (1987a). Interaction of 4-hydroxylated estradiol and potential-sensitive Ca2 + channels in altering uterine blood flow during the estrous cycle and early pregnancy in gilts. Biol Reprod, 36, 369–75.
- Stice SL, Ford SP, Rosazza JP, Van Orden DE. (1987b). Role of 4-hydroxylated estradiol in reducing Ca2 + uptake of uterine arterial smooth muscle cells through potential-sensitive channels. Biol Reprod, 36, 361–8.
- Strassburg CP, Oldhafer K, Manns MP, Tukey RH. (1997). Differential expression of the UGT1A locus in human liver, biliary, and gastric tissue: identification of UGT1A7 and UGT1A10 transcripts in extrahepatic tissue. Mol Pharmacol, 52, 212–20.
- Sun Y, Tao YG, Kagan BL, He Y, Simons Jr, SS. (2008). Modulation of transcription parameters in glucocorticoid receptor-mediated repression. Mol Cell Endocrinol, 295, 59–69.
- Susser M. (1986). The logic of Sir Karl Popper and the practice of epidemiology. Am. J. Epidemiol, 124, 711–18.
- Taylor SL, Gendel SM, Houben GF, Julien E. (2009). The Key Events Dose-Response Framework: a foundation for examining variability in elicitation thresholds for food allergens. Crit Rev Food Sci Nutr, 49, 729–39.
- Teeguarden JG, Waechter JM, Clewell HJ, Covington TR, Barton HA. (2005). Evaluation of oral and intravenous route pharmacokinetics, plasma protein binding, and uterine tissue dose metrics of bisphenol A: a physiologically based pharmacokinetic approach. Toxicol Sci, 85, 823–38.
- Thomas DJ. (2007). Molecular processes in cellular arsenic metabolism. Toxicol Appl Pharmacol, 222, 365–73.
- Thomas RS, Black M, Li L, Healy E, Chu TM, Bao W, et al. (2012). A Comprehensive Statistical Analysis of Predicting In Vivo Hazard Using High-Throughput In Vitro Screening. Toxicol Sci, 128, 398–417.
- Thomas RS, Philbert MA, Auerbach SS, Wetmore BA, Devito MJ, Cote I, et al. (2013). Incorporating new technologies into toxicity testing and risk assessment: moving from 21st century vision to a data-driven framework. Toxicol Sci, 136, 4–18.
- Thompson CM, Kirman CR, Proctor DM, Haws LC, Suh M, Hays SM, et al. (2014). A chronic oral reference dose for hexavalent chromium-induced intestinal cancer. J Appl Toxicol, 34, 525–36.
- Timchalk C, Kousba A, Poet TS. (2002a). Monte Carlo analysis of the human chlorpyrifos-oxonase (PON1) polymorphism using a physiologically based pharmacokinetic and pharmacodynamic (PBPK/PD) model. Toxicol Lett, 135, 51–9.
- Timchalk C, Nolan RJ, Mendrala AL, Dittenber DA, Brzak KA, Mattsson JL. (2002b). A Physiologically based pharmacokinetic and pharmacodynamic (PBPK/PD) model for the organophosphate insecticide chlorpyrifos in rats and humans. Toxicol Sci, 66, 34–53.
- Tukey JW, Ciminera JL, Heyse JF. (1985). Testing the Statistical Certainty of a Response to Increasing Doses of a Drug. Biometrics, 41, 295–301.
- USEPA (United States Environmental Protection Agency). (2005a). Guidelines for Carcinogen Risk Assessment.
- USEPA (United States Environmental Protection Agency). (2005b). Supplemental Guidance for Assessing Susceptibility from Early-Life Exposure to Carcinogens.
- USEPA (United States Environmental Protection Agency). (2005c). Science Issue Paper: Mode of Carcinogenic Action for Cacodylic Acid V (Dimethylarsinic Acid, DMA) and Recommendations for Dose Response Extrapolation.
- USEPA (United States Environmental Protection Agency). (2006). Revised Reregistration Eligibility Decision for MSMA, DSMA, CAMA, and Cacodylic Acid.
- USEPA (United States Environmental Protection Agency). (2007). Framework for Determining a Mutagenic Mode of Action for Carcinogenicity: Using EPA’s 2005 Cancer Guidelines and Supplemental Guidance for Assessing Susceptibility to Early-Life Exposure to Carcinogens.
- USEPA (United States Environmental Protection Agency). (2011). DRAFT Guidance for Applying Quantitative Data to Develop Data-Derived Extrapolation Factors for Interspecies and Intraspecies Extrapolation.
- van Gemert M, Dourson M, Moretto A, Watson M. (2001). Use of human data for the derivation of a reference dose for chlorpyrifos. Regul. Toxicol. Pharmacol, 33, 110–16.
- Vink R, Mikkers J, Bouwman T, Marquart H, Kroese D. (2010). Use of read-across and tiered exposure assessment in risk assessment under REACH – A case study on a phase-in substance. Regul Toxicol Pharmacol, 58, 64–71.
- Vinken M. (2013). The adverse outcome pathway concept: a pragmatic tool in toxicology. Toxicology, 312, 158–65.
- Waddell WJ. (2005). Comparisons of thresholds for carcinogenicity on linear and logarithmic dosage scales. Hum Exp Toxicol, 24, 325–32.
- Waddell WJ. (2008). Thermodynamic basis for expressing dose logarithmically. Toxicol Appl Pharmacol, 2, 156–7.
- Wagner JG. (1968). Kinetics of pharmacologic response. I. Proposed relationships between response and drug concentration in the intact animal and man. J Theor Biol, 20, 173–201.
- Wen DX, Xu YF, Mais DE, Goldman ME, Mcdonnell DP. (1994). The A and B isoforms of the human progesterone receptor operate through distinct signaling pathways within target cells. Mol. Cell. Biol, 14, 8356–64.
- Willhite CC, Ball GL, Mclellan CJ. (2008). Derivation of a bisphenol A oral reference dose (RfD) and drinking-water equivalent concentration. J Toxicol Environ Health B Crit Rev, 11, 69–146.
- Winuthayanon W, Hewitt SC, Orvis GD, Behringer RR, Korach KS. (2010). Uterine epithelial estrogen receptor α is dispensable for proliferation but essential for complete biological and biochemical responses. Proc Natl Acad Sci USA, 107, 19272–7.
- World Health Organization – International Programme on Chemical Safety (WHO-IPCS). (2005). Chemical-Specific Adjustment Factors for Interspecies Differences and Human Variability: Guidance Document for Use of Data in Dose/Concentration Response Assessment.
- Yamasaki K, Noda S, Imatanaka N, Yakabe Y. (2004). Comparative study of the uterotrophic potency of 14 chemicals in a uterotrophic assay and their receptor-binding affinity. Toxicol Lett, 146, 111–20.
- Yamasaki K, Takeyoshi M, Yakabe Y, Sawaki M, Imatanaka N, Takatsuki M. (2002). Comparison of reporter gene assay and immature rat uterotrophic assay of twenty-three chemicals. Toxicology, 170, 21–30.
- Yamasaki K, Takeyoshi M, Yakabe Y, Sawaki M, Takatsuki M. (2003). Comparison of the reporter gene assay for ER-alpha antagonists with the immature rat uterotrophic assay of 10 chemicals. Toxicol Lett, 142, 119–31.
- Ye X, Zhou X, Wong LY, Calafat AM. (2012). Concentrations of bisphenol a and seven other phenols in pooled sera from 3–11 year old children: 2001–2002 national health and nutrition examination survey. Environ Sci Technol, 46, 12664–71.
- Zhang Z, Sun Y, Cho YW, Chow CC, Simons SS. (2012). PA1: a New Competitive Decelerator Acting at More Than One Step To Impede Glucocorticoid Receptor-Mediated Transactivation. J. Biol. Chem, 288, 42–58.
- Zhang Z, Teng CT. (2001). Estrogen receptor alpha and estrogen receptor-related receptor alpha1 compete for binding and coactivator. Mol Cell Endocrinol, 172, 223–33.