Abstract
2D and 3D quantitative structure–activity relationship studies have been carried out for establishing a correlation between the structural properties of benzyl urea derivatives and their anti-tumour activities. From this correlation, the new chemical entities were designed, and their activity and absorption, distribution, metabolism, excretion, and toxicity properties were also predicted. Finally, the most promising compounds from these screening were synthesized and biologically evaluated for their anti-cancer properties. Compound 1-(2, 4-dimethylphenyl)-3, 3-dimethyl-1-(2-nitrobenzyl) urea (7d) showed significant anti-proliferative activity (at 100 µg/mL) in human cancer cell lines-T-cell leukemia (Jurkat J6), myelogenous leukemia (K562), and breast cancer (MCF-7) compared to reference standard 5-flurouracil.
Introduction
Cancer drug discovery has undergone a remarkable series of changes over the last decade. The first generation of anti-cancer drugs such as deoxyribonucleic acid (DNA)–alkylating and cross-linking agents, anti-metabolites, topoisomerase inhibitors and anti-tubulin agents have been traditionally focused on targeting DNA processing and cell division and were almost all cytotoxic agentsCitation1,Citation2. In an attempt to avoid unpleasant side effects (bone marrow suppression and gastrointestinal, cardiac, hepatic, and renal toxicities) associated with these conventional anti-cancer drugs, a new class of anti-cancer drugs known as molecularly targeted agents was being developed that work by targeting a biochemical pathway or protein that is unique to or upregulated in cancer cellsCitation3. Such agents are typically less toxic than drugs in the older classes and can be given for long-term oral therapy with the objective of treating cancer as a chronic disease. Among all these non-traditional (non-DNA-directed) cancer targets for which pharmacological intervention is feasible, there are none that have generated as much widespread interest, as have the protein tyrosine kinases (PTKs)Citation4.
PTKs protein over expression or gene amplification, mutation, or rearrangement have been demonstrated in multiple malignancies including cancers of the head and neck, ovary, cervix, bladder, prostate, esophagus, stomach, brain, breast, endometrium, colon, and lungCitation5,Citation6. Therefore design of inhibitors toward PTKs is an attractive approach for development of new therapeutic agentsCitation7,Citation8. Most of the tumours initially respond to PTKs but majority of them become resistant to the drug treatmentCitation9,Citation10. The mechanism underlying acquired drug resistances are not well understoodCitation11.
Our interest have been focused on a special group of compounds containing a urea moiety in their structures, as urea derivatives were synthesized largely in recent years and have become of particular interest to chemists and biologists because of their wide range of biological activities such as anti-convulsant activityCitation12, colchicine-binding antagonistCitation13 and chemokine receptor CXCR3 antagonistCitation14. Some of urea derivatives exhibit cell growth inhibition on numerous cancer cell lines and are reported to be potent inhibitors of the PTKs activity of a number of transmembrane growth factor receptors such as 1, 3-disubstituted urea derivativesCitation15,Citation16, primaquine urea derivativesCitation17, alkyl[3-(2-chloroethyl)ureido]benzeneCitation18, 4,5-disubstituted thiazolyl urea derivativesCitation19. Therefore, search for lead compound is still a continuous quest for the researchers working in this area.
Computational models are one of the powerful tools to design highly active moleculesCitation20,Citation21 that are able to predict structures and the biological activities of anti-cancer compounds. Many QSAR studiesCitation22–26 were developed and published as screening methods for design of new chemical entities (NCE′s). As shown in , to further explore the structural requirements of selected series of benzyl urea derivatives for their anti-proliferative activity, two methods of QSAR, 2D-QSAR and 3D-QSAR were carried out and NCEs were designed using results of QSAR model. 2D-QSAR and 3D-QSAR studies were performed using multiple linear regression (MLR) analysisCitation27 and k-nearest neighbour–molecular field analysis (kNN–MFA), respectively. The kNN–MFA methodology relies upon a simple distance learning approach. In this method an unknown member is classified according to the majority of its kNNs in the training set. The nearness is measured by an appropriate distance metrics (e.g. a molecular similarity measure calculated using field interactions of molecular structures). The standard kNN–MFA methodCitation28 was implemented simply as follows: (i) the distances between an unknown object (u) and all other objects in the training set were calculated; (ii) the k objects were selected from the training set most similar to object u, according to the calculated distances; and (iii) the object u was classified with the group to which the majority of the k objects belong. An optimal k value is selected by optimization through the classification of a test set of samples or by leave-one-out (LOO) cross-validation. The variables and optimal k values were chosen using different variable selection methods. Here we have used simulated annealing (SA)Citation29 as variable selection method.
Figure 1. Flowchart of screening methods for new lead compounds.

Designed compounds were screened by two types of screening methods for finding of new compounds with anti-cancer activity: (i) Lipinski′s rule and prediction of activity using regression equation generated by 2D-QSAR studies and (ii) prediction of absorption, distribution, metabolism, excretion, and toxicity (ADMET) properties. Seven compounds were selected from results of molecular modeling studies and were synthesized. The compounds were screened for examining their anti-cancer effect on human T-cell leukemia cell lines—Molt-4 and Jurkat J6, myelogenous leukemia cell line—K562 and breast cancer cell line—MCF 7.
Experimental part
QSAR studies
All QSAR studies were performed using V-Life Molecular Design Suite Software, version 3.5Citation30. Biological activity expressed in terms of IC50 was converted in to pIC50 (pIC50 = log1/IC50). Both 2D- and 3D-QSAR models were generated using a training set of 20 molecules with varied chemical and biological activities. Test set of four molecules with distributed biological activity was used to assess the predictive power of generated QSAR models. The sphere exclusion methodCitation31 was used for the selection of molecules in training and test sets.
Uni-Column statistics for training set and test set were generated to check correctness of selection criteria for trainings and test set molecules (). Selection of molecules in the training set and test is a key and important feature of any QSAR model, therefore due care was taken in such a way that biological activities of all compounds in test set lie within the maximum and minimum value range of biological activities of training set of compounds ().
Table 1. Uni-Column statistics for training and test set of compounds.
The maximum and minimum value in training and test set were compared in a way that
the maximum value of pIC50 of test set should be less than or equal to maximum value of pIC50 of training set.
the minimum value of pIC50 of test set should be higher than or equal to minimum value of pIC50 of training set.
This observation showed that test set was interpolative and derived within the minimum—maximum range of training set.
The mean and standard deviation pIC50 values of sets of training and test provide insights to relative difference of mean and point density distribution of two sets.
Mean in test set were found to be higher in test set than mean in training set indicating that presence of relatively more active molecules as compared to inactive ones.
Higher standard deviation in training set indicated that training set has widely distributed activity of molecules as compared to test set molecules.
The most widely used MLR analysis was used to correlate biological activities with physicochemical properties of the selected series of compounds. Molecules were optimized by Merck Molecular Force Field (MMFF) energy minimization method. A total of 287 2D descriptors were computed using V-Life Molecular Design Suite Software, which include various physicochemical descriptors; Baumann alignment-independent topological descriptorsCitation32 and MMFF atom type count descriptor. After computation of all descriptors, invariable descriptors that have no variation in their values were removed. 2D-QSAR equations were generated by MLR analysis using SA variable selection method.
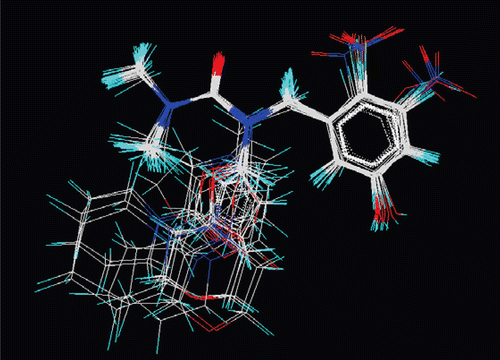
The 3D-QSAR studies were performed by kNN–MFA using SA variable selection method. kNN–MFA method requires suitable alignment of given set of molecules after optimization, alignment was carried out by template based alignment method (). Molecular alignment was used to visualize the structural diversity in the given set of molecules. This was followed by generation of common rectangular grid around the molecules. The steric and electrostatic interaction energies were computed at the lattice points of the grid using a methyl probe of charge +1. The resulting set of aligned molecules was then used to build 3D-QSAR models and information′s generated were used to predict activity of those designed molecules that have the similar template or set of atoms.
Figure 2. Alignment of substituted benzyl urea derivatives using template based alignment method.
All generated QSAR models were evaluated and best model was selected using following statistical measures: n, number of molecules (>20 molecules); k, number of descriptors in a model (statistically n/5 descriptors in a model); df, degree of freedom (n − k − 1) (higher is better); r2, square of regression (>0.7); q2, cross-validated r2 (>0.5); pred_r2 − r2 for external test set (>0.5); SEE, standard error of estimate (smaller is better); F-test, F-test for statistical significance of the model (higher is better, for same set of descriptors and compounds); F_prob. Alpha—Error probability (smaller is better); Z score, —Z score calculated by the randomization test (higher is better); best_ran_q2 highest q2 value in the randomization test (as low as compared to q2); best_ran_r2 highest r2 value in the randomization test (as low as compared to r2); α-statistical significance parameter by randomization test (<0.01).
Validation of QSAR studies
Models generated by 2D and 3D-QSAR studies were cross-validated using standard LOO procedureCitation28. The cross-validated r2 (q2) value was calculated using equation 1, where yi and ŷi are the actual and predicted activities of the ith molecule, respectively, and ymean is the average activity of all molecules in the training set. Both summations are over all molecules in the training set. Because the calculation of the pair-wise molecular similarities, and hence the predictions were based upon the current trial solution, the q2 obtained is indicative of the predictive power of the current kNN–MFA model.
All cross-validation studies were performed by considering the fact that a value of q2 is above 0.5 indicating high predictive power of generated QSAR models.
External validationCitation29 of generated models was carried out by predicting the activity of test set of compounds. The predicted r2 (pred_r2) value was calculated using equation 2, where yi and ŷi are the actual and predicted activities of the ith molecule in test set, respectively, and ymean is the average activity of all molecules in the training set. Both summations are over all molecules in the test set. The pred_r2 value is indicative of the predictive power of the current kNN–MFA model for external test set.
The statistical significance of the QSAR model for an actual data set was further evaluated by randomization test. The robustness of the QSAR models for experimental training sets was examined by comparing generated model with those derived for random data sets. Random sets were generated by rearranging biological activities of the training set molecules. The significance of the models hence obtained was derived based on calculated Z-scoreCitation28,Citation29.
ADMET prediction
ADMET properties were calculated using Discovery Studio (DS) 2.1, Accelrys softwareCitation33. DS provides methods for assessing the disposition and potential toxicity of a ligand within an organism. The ADMET protocols in DS contain published models that are used to compute and analyze ADMET properties. In addition, DS apply specific rules to remove ligands that are not likely drug like, unsuitable leads, etc. based on the presence or absence and frequency of certain chemical groups.
Synthetic studies
All the reactions were carried out with dry, freshly distilled solvents under anhydrous conditions, unless otherwise noted. Fourier transform infrared (FTIR) spectra of the compounds were recorded using KBr on a Varian 640 FTIR spectrophotometer and are reported in cm−1. 1H NMR spectra were recorded on a Varian Mercury YH300 (300 MHz FT NMR) spectrophotometer using tetramethylsilane as an internal reference (chemical shift represented in δ ppm). Mass spectra were recorded on GC-MS QP5050A System (benchtop quadrupole mass spectrophotometer). Purity of the compounds was checked on thin layer chromatography plates using silica gel G as stationary phase and was visualized in UV light at 254 nm.
Synthesis of secondary aminesCitation15,Citation16 (4a-4g)
Aldehydes (1a-1g) (0.1 mol) were dissolved in 25 mL of ethanol and amines (2a-2g) (0.1 mol) were added to the solution. The reaction mixture was refluxed for 1–2 h. NaBH4 (0.05 mmol) was added to the reaction mixture solution slowly and stirred under 50°C for 2–3 h. The mixture was evaporated under vacuum and dissolved in ethylacetoacetate (30 mL). The solution was washed with 20 mL water twice, dried over anhydrous sodium sulfate and evaporated.
Synthesis of benzyl urea derivativesCitation15,Citation16 (7a–7g)
The mixture of CH2Cl2 (15 mL), dry DMF (5) (3 mL, 40 mmol) and SOCl2 (6) (7 mL, 0.10 mol) was stirred at 70°C for 4 h and cooled for 24 h. The solvents and excess SOCl2 were then removed under reduced pressure. The residue dissolved in CH2Cl2 (15 mL). Dry pyridine (4 mL) and various amines (4a-4g) (40 mmol) were added to the reaction mixture and stirred at 50–60°C for 5–6 h. The reaction mixture was then added to 20 mL ice water, organic layer was separated, and the aqueous layer was extracted with ethyl acetate (2 × 10 mL). The organic layer was combined and washed with saturated NaHCO3, dried with anhydrous Na2SO4 for 0.5 h and concentrated under vacuum.
1-benzyl-1-(2-chlorobenzyl)-3,3-dimethylurea (7a)
Yield: 59.10% (Liquid), bp 113–115°C. FTIR (KBr) cm−1: 3095 (Ar C–H), 2976 (Aliphatic C–H), 1712 (C=O), 1314 (ter. C-N); 1081 (C-Cl). 1H NMR (300 MHz, DMSO, δ ppm): 2.82 (s, 6H, CH3), 4.58 (s, 4H, CH2), 7.26–7.72 (m, 9H, Aromatic). Mass: m/z 302 (M+), 303 (M+1) +. 13C NMR (100 MHz, DMSO, δ ppm): 37.2 (-N(CH3)2), 50.7 (-CH2-N-CH2), 127.2 (Ph C-4), 128.8 (Ph C-3,5), 129.8 (Ph C-2,6), 130.2 (Cl-Ph C-3,4,5), 131.3 (Cl-Ph C-6), 132.8 (Cl-Ph C-2), 134.4 (Ph C-1), 137.3 (Cl-ph C-1), 168.1 (C=O). Elemental Analysis calculated for C17H19ClN2O: C, 67.54; H, 6.29; N, 9.27. Found: C, 67.46; H, 6.38; N, 9.35.
1-benzyl-3,3-dimethyl-1-(2-nitrobenzyl)urea (7b)
Yield: 90.13% (Liquid), bp 107–109°C. FTIR (KBr) cm−1: 3041 (Ar C–H), 2815 (Aliphatic C–H), 1716 (C=O), 1533 (N-O), 1345 (ter C-N), 863 (Ar C-N). 1H NMR (300 MHz, DMSO, δ ppm): 2.91 (s, 6H, CH3), 4.63 (s, 4H, CH2), 7.21–782 (m, 9H, Aromatic). Mass: m/z 313 (M+), 314 (M+1) +. 13C NMR (100 MHz, DMSO, δ ppm): 37.3 (-N(CH3)2), 50.9 (-CH2-N-CH2), 126.7 (NO2-Ph C-3,4), 127.3 (Ph C-4), 128.8 (Ph C-3,5), 129.9 (Ph C-2,6), 130.3 (NO2-Ph C-6), 132.5 (NO2-Ph C-5), 134.6 (Ph C-1), 137.4 (NO2-Ph C-1), 144.1 (NO2-ph C-2), 168.7 (C=O). Elemental Analysis calculated for C17H19N3O3: C, 65.15; H, 6.07; N, 13.41. Found: C, 65.09; H, 5.98; N, 13.53.
1-(2-chlorobenzyl)-3,3-dimethyl-1-(naphthalen-1-yl)urea (7c)
Yield: 41.53% (Liquid), bp 118–120°C. FTIR (KBr) cm−1: 3029 (Ar C–H), 2923 (Aliphatic C–H), 1722 (C=O), 1319 (ter. C-N); 1085 (C-Cl). 1H NMR (300 MHz, DMSO, δ ppm): 2.81 (s, 6H, CH3), 4.63 (s, 4H, CH2), 7.16–7.29 (m, 4H, Aromatic), 7.51–7.65 (m, 7H, Naphthyl). Mass: m/z 338 (M+), 339 (M+1) +. 13C NMR (100 MHz, DMSO, δ ppm): 37.6 (-N(CH3)2), 49.9 (-N-CH2), 108.1 (Naphthyl C-2), 120.3 (Naphthyl C-4,9), 125.5 (Naphthyl C-3,6,7,8), 128.1 (Ph C-3,4,5,6), 131.7 (Ph C-2), 133.5 (Naphthyl C-5,10), 136.1 (Naphthyl C-1), 138.1 (Ph C-1), 168.5 (C=O). Elemental Analysis calculated for C20H19ClN2O: C, 71.00; H, 5.62; N, 8.28. Found: C, 72.02; H, 5.53; N, 8.37.
1-(2,3-dimethylphenyl)-3,3-dimethyl-1-(2-nitrobenzyl)urea (7d)
Yield: 41.89% (Liquid), bp 114–115°C. FTIR (KBr) cm−1: 3012 (Ar C–H), 2881 (Aliphatic C–H), 1721 (C=O), 1523 (N-O); 1329 (ter C-N), 859 (Ar C-N). 1H NMR (300 MHz, DMSO, δ ppm): 2.20 (s, 3H, CH3), 2.33 (s, 3H, CH3), 2.80 (s, 6H, CH3), 4.82 (s, 2H, CH2), 7.41–7.52 (m, 3H, Aromatic), 7.57–7.73 (m, 3H, Aromatic). Mass: m/z 327 (M+), 328 (M+1) +. 13C NMR (100 MHz, DMSO, δ ppm): 18.5 (2,4 dimethyl), 37.1 (-N(CH3)2), 50.7(-N-CH2), 127.5 (dimethyl Ph C-3,5,6), 128.7 (Ph C-3,4,5,6), 130.5 (dimethyl Ph C-2,4), 132.1 (Ph C-1), 136.6 (dimethyl Ph C-1), 144.3 (Ph C-2), 169.5 (C=O). Elemental Analysis calculated for C18H21N3O3: C, 66.04; H, 6.47; N, 12.84. Found: C, 66.10; H, 6.34; N, 12.76.
1-(2-ethylbenzyl)-3,3-dimethyl-1-(naphthalen-1-yl)urea (7e)
Yield: 83.13% (Liquid), bp 122–124°C. FTIR (KBr) cm−1: 3025 (Ar C–H), 2934 (Aliphatic C–H), 1717 (C=O), 1359 (ter C-N). 1H NMR (300 MHz, DMSO, δ ppm): 1.19–1.35 (t, 3H, CH3, J = 8.1 Hz), 2.58–2.74 (q, 2H, CH2, J = 8.1 Hz), 2.93 (s, 6H, CH3), 4.92 (s, 2H, CH2), 7.21–7.36 (m, 4H, Aromatic), 7.47–7.76 (m, 7H, Naphthyl). Mass: m/z 332 (M+), 333 (M+1) +. 13C NMR (100 MHz, DMSO, δ ppm): 14.3 (-CH2CH3), 26.3 (-CH2CH3), 37.4 (-N(CH3)2), 49.8 (-N-CH2), 108.3 (Naphthyl C-2), 120.5 (Naphthyl C-4,9), 124.3 (Ph C-3,4,5,6), 125.8 (Naphthyl C-3,6,7,8), 128.2 (Ph C-2), 132.9 137.1 (Naphthyl C-1), (Naphthyl C-5,10), 138.3 (Ph C-1), 168.4 (C=O). Elemental Analysis calculated for C22H24N2O: C, 79.51; H, 7.22; N, 8.43. Found: C, 79.44; H, 7.10; N, 8.55.
1-(3-ethoxy-4-hydroxybenzyl)-3,3-dimethyl-1-(naphthalen-1-yl)urea (7f)
Yield: 62.50% (Liquid), bp 103–105°C. FTIR (KBr) cm−1: 3589 (Ar OH), 3098 (Ar C–H), 2859 (Aliphatic C–H), 1716 (C=O), 1391 (ter C-N); 1329 (ter C-N), 1256 (C-O-C). 1H NMR (300 MHz, DMSO, δ ppm): 1.24–1.34 (t, 3H, CH3, J = 8.1 Hz), 2.76 (s, 6H, CH3), 4.03–4.17 (q, 2H, CH2, J = 8.2 Hz), 4.77 (s, 2H, CH2), 5.59 (s, 1H, OH), 7.16–7.23 (m, 3H, Aromatic), 7.37–7.52 (m, 7H, Naphthyl). Mass: m/z 364 (M+), 365 (M+1) +. 13C NMR (100 MHz, DMSO, δ ppm): 15.1 (-CH2CH3), 37.2 (-N(CH3)2), 50.4 (-N-CH2), 66.2 (-CH2CH3), 108.4 (Naphthyl C-2), 117.1(Ph C-2,5), 120.1 (Naphthyl C-4,9), 127.3 (Ph C-3,6,7,8), 128.1 (Ph C-1), 132.4 (Naphthyl C-5,10), 133.5 (Ph C-1), 136.8 (Naphthyl C-1), 147.5 (Ph C-3,4), 169.2 (C=O). Elemental Analysis calculated for C22H24N2O3: C, 72.52; H, 6.59; N, 7.69. Found: C, 72.63; H, 6.49; N, 7.62.
1-(2,3-dimethylphenyl)-1-(2-ethylbenzyl)-3,3-dimethylurea (7g)
Yield: 73.73% (Liquid), bp 124–125°C. FTIR (KBr) cm−1: 2998 (Ar C–H), 2917 (Aliphatic C–H), 1693 (C=O), 1320 (ter C-N). 1H NMR (300 MHz, DMSO, δ ppm): 1.14–1.26 (t, 3H, CH3), 2.02 (s, 3H, CH3, J = 7.9 Hz), 2.21 (s, 3H, CH3), 2.62-2.78 (q, 3H, CH3, J = 7.9 Hz), 2.29 (s, 6H, CH3), 4.84 (S, 2H, CH2), 7.11–7.43 (m, 6H, Aromatic). Mass: m/z 310 (M+), 311 (M+1) +. 13C NMR (100 MHz, DMSO, δ ppm): 13.9 (-CH2CH3), 17.6 (2,4 dimethyl), 26.3 (-CH2CH3), 38.2 (-N(CH3)2), 49.8 (-N-CH2), 126.2 (Ph C-2,4,5,6), 128.1 (dimethyl Ph C-3,4,5), 133.2 (dimethyl Ph C-2,4), 136.1 (Ph C-1,3), 137.2 (dimethyl Ph C-1), 167.4 (C=O). Elemental Analysis calculated for C20H26N2O: C, 77.38; H, 8.44; N, 9.02. Found: C, 77.23; H, 8.35; N, 9.09.
Anti-proliferative activity by MTT assay
The human T-cell leukemia cell lines (Molt-4 and Jurkat J6), myelogenous leukemia cell line (K562) and breast cancer cell line (MCF-7) were procured from ATCC (American type culture collection). Molt-4, Jurkat J6, and K562 were maintained in RPMI 1640 medium and MCF-7 cell line in Eagle′s minimum essential medium supplemented with 10% fetal calf serum and 100 U of penicillin and streptomycin. The cell lines were cultured and maintained in a humidified atmosphere of 5% CO2 at 37°C.
The anti-proliferative activity of the compounds was determined by MTT (3-(4,5-Dimethylthiazol-2-yl)-2,5-diphenyltetrazolium bromide) assay, using 5-flurouracil as reference drug. Cell lines were seeded at a density of 25,000 cells/well/100 µL in a 96 well tissue culture plate for suspension cultures and 5000 cells /well in a 96 well tissue culture plate for adherent cultures. Suspension cells were treated with compounds 7a–7g within 1 h of seeding whereas adherent cells were allowed to adhere for 12 h and medium was replaced. The compounds at concentration of 25, 50, 100, and 200 µg/mL were used in the volume of 10 µL/well. After the incubation of 48 h, the cell survival was determined by addition of MTT solution (10 µL/well of 5 mg/mL MTT in phosphate-buffered saline) and incubated for 4 h at 37°C in 5% CO2. For suspension cells, the formazon crystals were solubilized by adding 10% sodium dodecyl sulfate in 0.1N HCL, incubated overnight and optical absorbance was measured at 570–650 nm. For adherent cells, the medium containing MTT was aspirated; DMSO (100 µL/well) was added and optical absorbance was measured after 10 min at 570 nm.
Results and discussion
QSAR studies
A series of total 24 compounds for which absolute IC50 values reportedCitation15 was used for correlating chemical composition (structure) with their anti-proliferative activity. Several 2D-QSAR and 3D-QSAR models were generated for training set of 20 compounds using MLR and SA kNN–MFA (SA kNN–MFA) method, respectively. The best QSAR model was selected on the basis of value of Statistical parameters like r2 (square of correlation coefficient for training set of compounds), q2 (cross-validated r2), and pred_r2 (predictive r2 for the test set of compounds). All QSAR models were validated and tested for its predictability using an external test set of four compounds. Statistical results generated by both 2D and 3D-QSAR analysis showed that both QSAR model have good internal as well as external predictability ().
Table 2. Statistical results of 2D-QSAR equation generated by MLR method and 3D-QSAR model generated by SA kNN–MFA for benzyl urea derivatives.
The generated QSAR models were evolved by repeating the MLR and kNN–MFA methods to check the accuracy and precision of both the methods. The frequency of use of a particular descriptor in the population of equations indicated the relevant contributions of the descriptors. The best 2D-QSAR model had five contributing descriptors including constant (equation 3)
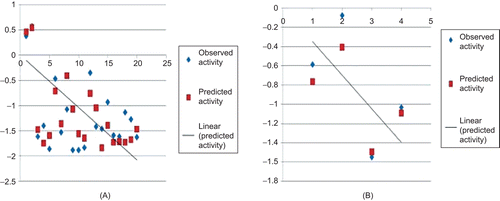
Results of 3D-QSAR indicated the requirement of two electropositive groups and one steric group around benzyl urea pharmacophore for anti-cancer activity (). The kNN–MFA QSAR method explores formally the active analogue approach, which implies that compounds display similar profiles of pharmacological activities. In this method, the activity of each compound is predicted as average activity of k most chemically similar compounds from that data set. The generated 3D-QSAR model showed a good correlation between the experimental obtained and computationally predicted activity (). Residual values obtained by subtraction of predicted activities from experimental biological activities were found to near to zero indicating the good predictability of selected QSAR Model (). The plots of observed vs. predicted activity for the optimal cross-validated kNN–QSAR model are depicted in .
Table 3. Structure of training and test sets of compounds along with observed and predicted activity.
Figure 3. Comparison of observed activity vs predicted activity for training set (A) and test set (B) of compounds.
Interpretation of QSAR studies
It is simple to interpret 2D-QSAR MLR equation where each descriptor′s contribution can be seen by the magnitude and sign of its regression coefficient. A descriptor′s coefficient magnitude shows its relative contribution with respect to other descriptors and sign indicates whether it is directly (+) or inversely (−) proportional to the activity. The developed MLR equation 2 indicated that the descriptor T_N_O_2 played most significantly important role (contribution ∼41% for biological activity) for anti-proliferative activity of benzyl urea derivatives (). T_N_O_2 is an alignment-independent descriptor that specifies the count of number of nitrogen atoms (single, double, or triple bonded) separated from any oxygen atom (single or double bonded) by 2 bond distances in a molecule. This descriptor suggested the requirement of urea molecule in benzyl urea pharmacophore for biological activity. The next influential descriptor was MMFF_6 (contribution ∼30% for biological activity) that was inversely proportional to the activity. This is an atom type count descriptor based on MMFF atom types and their count in each molecule and ‘6′ indicated number of times that atom type has been found in a given molecule.
Figure 4. Results of QSAR studies. (A) Contributions of 2D descriptors for biological activity developed using MLR equation (2D-QSAR). (B) Contributions of electrostatic and steric 3D data points towards biological activity developed using kNN–MFA method (3D-QSAR). (C) Pharmacophore requirement around benzyl urea.
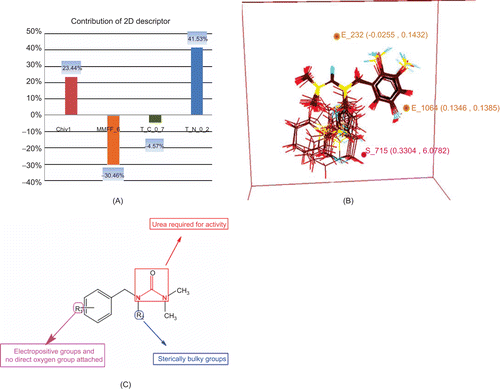
The descriptor chiv1 (contribution ∼24% for biological activity) was found to be directly proportional to the activity and showed the role of atomic valence connectivity index (order 1) that is calculated as the sum of 1/√vivj over all bonds between heavy atoms i and j where i < j. Finally, the descriptor governing variation in the activity was T_C_O_7 (contribution approximately 5% for biological activity) and was found to be inversely proportional to the activity, which indicated that the presence of substituents with direct attachment of oxygen on aromatic ring (e.g. OH) may be unfavorable or detrimental for the anti-cancer activity.
3D-QSAR was used to optimize the electrostatic and steric requirements around benzyl urea pharmacophore. 3D data points were generated that contribute to SA kNN–MFA 3D-QSAR model, are shown in . The range of property values for the generated data points helped for the design of potent NCEs. The range was based on the variation of the field values at the chosen points using the most active molecule and its nearest neighbour set. The points generated in SA kNN–MFA 3D-QSAR model are E_232 (-0.0255, 0.1432), S_715 (0.3304, 6.0782), and E_1064 (0.1346, 0.1345) i.e. electrostatic and steric interaction field at lattice points 232, 715, and 1064, respectively. These points were suggested the significance and requirement of electrostatic and steric properties as mentioned in the ranges in parenthesis for structure-activity relationship and maximum biological activity of benzyl urea derivatives.
Negative and positive values in electrostatic field descriptors indicated the requirement of negative and positive electrostatic potential respectively for enhancing the biological activity of benzyl urea derivatives. Therefore electronegative and electropositive substituents were preferred at the position of generated data points E_232 (-0.0255, 0.1432) and E_1064 (0.1346, 0.1345) respectively around benzyl urea pharmacophore.
Similarly the positive values of steric descriptors suggested the requirement of sterically bulky groups at the position of generated data point S_715 (0.3304, 6.0782) around benzyl urea pharmacophore for maximum activity. Thus the KNN–MFA models leads to identification of various local interacting molecular features responsible for activity variation and hence provide direction for design of new molecules in a convenient way.
Design and screening of NCEs
The information obtained from 2D and 3D-QSAR studies were used to optimize the electrostatic and steric requirements around the benzyl urea nucleus for enhancing the anti-cancer activity ().
Descriptors generated in 2D-QSAR equation signified the importance of urea group for anti-cancer activity of compounds. Similarly electrostatic and steric points generated around common template or pharmacophore in 3D-QSAR suggested substitution of sterically bulky group at N-R2 position around urea and electropositive group at R1 position around phenyl ring.
The NCEs were designed by CombiLib tool of V-Life Molecular Design Suite Software using pharmacophore shown in . CombiLib tool passed the designed compounds through Lipinski′s screen to ensure drug-like pharmacokinetic profile of the designed compounds. The Lipinski′s screen parameters used as filters are:
number of Hydrogen Bond Acceptor (A) (<10)
number of Hydrogen Bond donor (B) (<5)
number of Rotatable Bond (R) (<10)
XlogP (X) (<5)
molecular weight (W) (<500 g/mol)
polar surface area (S) is (<140 A0)
More than 100 molecules were generated using CombiLib tool that follows the Lipinski′s rule, but we have selected only 30 most active molecules on the basis of their activity, predicted using MLR equation ().
Table 4. Structure of designed NCEs along with predicted activity obtained by MLR equation generated by 2D-QSAR.
In , Compounds qualifying all required parameters set for Lipinski′s screen/filter are indicated by ADRXWS strings. The columns containing the Lipinski′s screen score and strings of alphabets, ADRXWS indicated that all six Lipinski′s screen parameters are satisfied by corresponding compound and depending on number of requirement satisfied, screen score varied in between 1 and 6. It was concluded from predicted activity of designed compound that presence of electropostive group at R1 position mainly at ortho and para position of phenyl ring and presence of sterically bulky group like benzyl, naphthyl at R2 position significantly enhanced the activity of compounds.
In next screening step, ADMET properties of all designed compounds were predicted and compared with predicted ADMET properties of standard compounds using DS, Accelrys software (). Prediction of ADMET properties was used as last screen to sort out those compounds that already followed Lipinski′s rule and showed good predicted activity. DS defined the prediction level for all ADMET properties. For ADMET Absorption, there are four prediction level: 0 – Good, 1 – Moderate, 2 – Poor, 3 – Very Poor, for ADMET plasma protein binding (PPB) level: 0 – binding is <90%, 1 – binding is >90%, 2 – binding is >95%, for ADMET Cytochrome P450 2D6 (CYP2D6) Probability level: <0.5 – Unlikely to inhibit CYP2D6 enzyme (Non-inhibitors of CYP2D6), >0.5 – Likely to inhibit CYP2D6 enzyme (Inhibitors of CYP2D6) and for ADMET probability level: < 0.5 – Unlikely to cause dose-dependent liver injuries (Non-toxic), >0.5 – Likely to cause dose-dependent liver injuries (Toxic).
Table 5. Prediction of ADMET properties by using discovery studio, accelrys.
All designed compounds showed good absorption, PPB level and found non-inhibitors of CYP2D6 enzyme. As shown in , Gefitinib and 5-flurouracil showed probability of heptotoxicity, whereas all designed compounds were found to be non-toxic to liver.
Chemistry
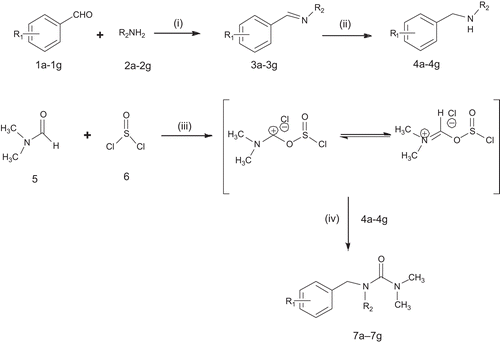
The seven compounds () that followed the all screening criteria were selected and synthesized. The synthetic route is outlined in Scheme 1. In the first step, condensation reaction of aldehydes (1a-1g) with various amines (2a-2g) gave the Schiff bases (3a-3g). Reduction of the latter with sodium borohydride afforded the corresponding secondary amines (4a-4g). In second step, Vilsmeier–Haack reaction was carried out, in which dry dimethyl formamide (5) in thionyl chloride (6) and dichloromethane was refluxed for 4 h and excessive SOCl2 was evaporated. The residue was then dissolved in dichloromethane, and stirred with various secondary amines (4a-4g) obtained in the first step dissolved in dry pyridine and CH2Cl2. As a result, benzyl urea derivatives (7a–7g) were synthesized. The structures of various synthesized compounds were assigned on the basis of different chromatographic, spectral and qualitative and quantitative organic analytical studies. The physical data, FTIR, 1HNMR and mass spectral data for all synthesized compounds are reported in experimental protocols.
Scheme 1. Synthetic route for benzyl urea derivatives. Reagents & condition: (i) ethanol, reflux, 1–2 h (ii) NaBH4, 50°C, 2–3 h (iii) dry CH2Cl2, 70°C, 4 h (iv) dry CH2Cl2, dry pyridine, 60°C, 5–6 h.
Anti-proliferative activity
All synthesized compounds were evaluated for their effect on proliferation in Molt-4, Jurkat J6, MCF-7, and K562 cell lines by MTT colorimetric assay. Compounds were tested at 25, 50, 100, and 200 g/mL concentrations and their % decrease in cell proliferation were calculated by considering untreated controls as 100%. 5-Flurouracil was used as reference compound. The results are depicted in and .
Table 6. Anti-proliferative activity of compounds 7a–7g in cancer cell lines.
Figure 5. Effect of compounds 7a–7g on (A) Molt-4, (B) Jurkat J6, (C) MCF-7, and (D) K562 cell lines on cell proliferation determined by MTT assay.
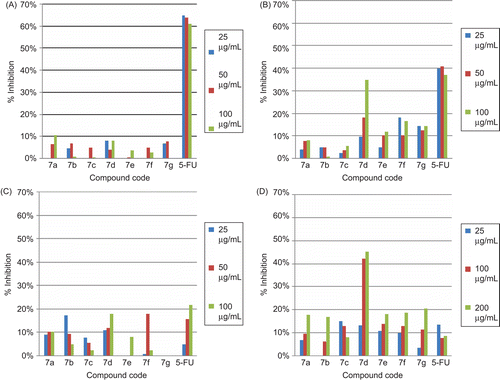
Molt-4 cell line did not respond to any of the seven compounds tested but in K562 cell line, all compounds showed anti-proliferative activity. In case of Jurkat J6, and MCF-7, only compound 7d exhibited significant anti-proliferative effect. Compound 7d showed 35% and 17.7% decrease in cell proliferation in Molt-4 and Jurkat cell lines respectively at concentration of 100 µg/mL, and was comparable with positive control-5-flurouracil that showed 37%, and 21.59% decrease in cell proliferation, respectively. Compound 7d exhibited good anti-proliferative activity (42.05%) as compared to that of 5-flurouracil (7.76%) at concentration of 100 µg/mL in K562 cell line. These results suggested that presence of NO2 group at ortho position of phenyl ring R1 position and 2,4-dimethylphenyl at R2 position improved the cytotoxicity in MCF -7, Jurkat J6, and K562 cell line. This also indicated that presence of –Cl, and C2H5 at ortho position of phenyl ring at R1 position and benzyl and naphthyl group at R2 position showed poor cytotoxic activity. From QSAR results, it was found that substituents at R1 position with direct oxygen substituents may decrease the cytotoxic activity but these compounds showed good binding affinity at EGFR receptor found by docking results, hence compound 7f containing OC2H5 at meta position and OH at para position of phenyl ring at R1 position was taken further for experimental validation, it show comparable cytotoxic activity with 5-flurouracil in MCF-7 but poor in vitro anti-tumour activity against Jurkat J6. Therefore, it was revealed that presence of oxygen group at phenyl ring at R1 position may decrease the activity. Also substituents at ortho position of phenyl ring at R1 position rather than meta and para position may help in increasing the in vitro anti-proliferative activity.
Conclusion
In this study, we tested the possibility of developing NCE′s using QSAR and ADMET predicting studies. The proposed 3D and 2D-QSAR models, due to the high internal and external predictive ability, can therefore act as a useful aid to the costly and time consuming experiments for determining electrostatic and steric requirement around benzyl urea pharmacophore that is required to achieve better anti-proliferative activity and thus aided in generation of diverse combinatorial library. Prediction of ADMET properties of designed compound helped in selecting the compounds having drug-like properties. A screening approach has thus facilitated the identification of suitable compounds from designed library for anti-cancer activity. Results of molecular modeling studies were cross verified by testing the cytotoxic activity of designed compounds in four cell line; Molt-4, Jurkat J6, MCF-7, and K562. Compound 7d was found to be the potent among the compounds tested. Therefore this was concluded that presence of electropositive group like NO2 at phenyl ring at R1 position and sterically bulky group at R2 like 2, 4-dimethylphenyl position can help the benzyl urea pharmacophore for inhibiting the tumour cells.
Declaration of interest
The authors report no conflicts of interest.
References
- Chabner BA, Roberts TG Jr. Timeline: Chemotherapy and the war on cancer. Nat Rev Cancer 2005; 5:65–72.
- Workman P. Genomics and the second golden era of cancer drug development. Mol Biosyst 2005; 1:17–26.
- Druker BJ. Perspectives on the development of a molecularly targeted agent. Cancer Cell 2002; 1:31–36.
- Morin MJ. From oncogene to drug: development of small molecule tyrosine kinase inhibitors as anti-tumor and anti-angiogenic agents. Oncogene 2000; 19:6574–6583.
- Krause DS, Van Etten RA. Tyrosine kinases as targets for cancer therapy. N Engl J Med 2005; 353:172–187.
- Hirsch FR, Varella-Garcia M, Bunn PA Jr, Di Maria MV, Veve R, Bremmes RM, Barón AE, Zeng C, Franklin WA. Epidermal growth factor receptor in non-small-cell lung carcinomas: correlation between gene copy number and protein expression and impact on prognosis. J Clin Oncol 2003; 21:3798–3807.
- Grünwald V, Hidalgo M. Developing inhibitors of the epidermal growth factor receptor for cancer treatment. J Natl Cancer Inst 2003; 95:851–867.
- Bridges AJ. Chemical inhibitors of protein kinases. Chem Rev 2001; 101:2541–2572.
- Kobayashi S, Boggon TJ, Dayaram T, Jänne PA, Kocher O, Meyerson M, Johnson BE, Eck MJ, Tenen DG, Halmos B. EGFR mutation and resistance of non-small-cell lung cancer to gefitinib. N Engl J Med 2005; 352:786–792.
- Yamamotoa H, Toyookaa S, Mitsudomib T. Impact of EGFR mutation analysis in non-small cell lung cancer. Lung Cancer 2009; 63:315–321.
- Kwak EL, Sordella R, Bell DW, Godin-Heymann N, Okimoto RA, Brannigan BW, Harris PL, Driscoll DR, Fidias P, Lynch TJ, Rabindran SK, McGinnis JP, Wissner A, Sharma SV, Isselbacher KJ, Settleman J, Haber DA. Irreversible inhibitors of the EGF receptor may circumvent acquired resistance to gefitinib. Proc Natl Acad Sci USA 2005; 102:7665–7670.
- Shimshoni JA, Bialer M, Wlodarczyk B, Finnell RH, Yagen B. Potent anticonvulsant urea derivatives of constitutional isomers of valproic acid. J Med Chem 2007; 50:6419–6427.
- Fortin JS, Lacroix J, Desjardins M, Patenaude A, Petitclerc E, C-Gaudreault R. Alkylation potency and protein specificity of aromatic urea derivatives and bioisosteres as potential irreversible antagonists of the colchicine-binding site. Bioorg Med Chem 2007; 15:4456–4469.
- Watson RJ, Allen DR, Birch HL, Chapman GA, Galvin FC, Jopling LA, Knight RL, Meier D, Oliver K, Meissner JW, Owen DA, Thomas EJ, Tremayne N, Williams SC. Development of CXCR3 antagonists. Part 3: Tropenyl and homotropenyl-piperidine urea derivatives. Bioorg Med Chem Lett 2008; 18:147–151.
- Li HQ, Zhu TT, Yan T, Luo Y, Zhu HL. Design, synthesis and structure-activity relationships of antiproliferative 1,3-disubstituted urea derivatives. Eur J Med Chem 2009; 44:453–459.
- Cao P, Huang XF, Ding H, Ge HM, Li HQ, Ruan BF, Zhu HL. Synthesis and cytotoxic evaluation of substituted urea derivatives as inhibitors of human-leukemia K562 cells. Chem Biodivers 2007; 4:881–886.
- Dzimbeg G, Zorc B, Kralj M, Ester K, Pavelic K, Andrei G, Snoeck R, Balzarini J, De Clercq E, Mintas M. The novel primaquine derivatives of N-alkyl, cycloalkyl or aryl urea: synthesis, cytostatic and antiviral activity evaluations. Eur J Med Chem 2008; 43:1180–1187.
- Bechard P, Lacroix J, Poyet P, C-Gaudreault R. Synthesis and cytotoxic activity of new alkyl[3-(2-chloroethyl)ureido]benzene derivative. Eur J Med Chem 1994; 29:963–966.
- Ling S, Xin Z, Zhong J, Jian-xin F. Synthesis, Structure, and Biological Activity of Novel 4,5-Disubstituted Thiazolyl Urea Derivatives. Hetero Chem 2008; 19:2–6.
- Gonzalez-Díaz H, Saiz-Urra L, Molina R, Santana L, Uriarte E. A model for the recognition of protein kinases based on the entropy of 3D van der Waals interactions. J Proteome Res 2007; 6:904–908.
- González-Díaz H, Saíz-Urra L, Molina R, González-Díaz Y, Sánchez-González A. Computational chemistry approach to protein kinase recognition using 3D stochastic van der Waals spectral moments. J Comput Chem 2007; 28:1042–1048.
- Szántai-Kis C, Kövesdi I, Eros D, Bánhegyi P, Ullrich A, Kéri G, Orfi L. Prediction oriented QSAR modelling of EGFR inhibition. Curr Med Chem 2006; 13:277–287.
- Shi WM, Shen Q, Kong W, Ye BX. QSAR analysis of tyrosine kinase inhibitor using modified ant colony optimization and multiple linear regression. Eur J Med Chem 2007; 42:81–86.
- Peng T, Pei J, Zhou J. 3D-QSAR and receptor modeling of tyrosine kinase inhibitors with flexible atom receptor model (FLARM). J Chem Inf Comput Sci 2003; 43:298–303.
- Kamath S, Buolamwini JK. Receptor-guided alignment-based comparative 3D-QSAR studies of benzylidene malonitrile tyrphostins as EGFR and HER-2 kinase inhibitors. J Med Chem 2003; 46:4657–4668.
- Assefa H, Kamath S, Buolamwini JK. 3D-QSAR and docking studies on 4-anilinoquinazoline and 4-anilinoquinoline epidermal growth factor receptor (EGFR) tyrosine kinase inhibitors. J Comput Aided Mol Des 2003; 17:475–493.
- Hansch C, Leo A. Exploring QSAR. In: Heller SR. Fundamentals and Applications in Chemistry and Biology, American Chemical Society, Wasshington, 1995
- Zheng W, Tropsha A. Novel variable selection quantitative structure–property relationship approach based on the k-nearest-neighbor principle. J Chem Inf Comput Sci 2000; 40:185–194.
- Ajmani S, Jadhav K, Kulkarni SA. Three-dimensional QSAR using the k-nearest neighbor method and its interpretation. J Chem Inf Model 2006; 46:24–31.
- VLifeMDS; Molecular Design Suite version 3.5, V-life Sciences Technologies Pvt. Ltd., Pune, India, 2004. (www.vlifesciences.com).
- Hudson BD, Rahr RM, Wood J, Osman J. Parameter Based Methods for Compound Selection from Chemical Databases. Quant Struct-Act Relat 1996; 15:285–289.
- Baumann K. An alignment-independent versatile structure descriptor for QSAR and QSPR based on the distribution of molecular features. J Chem Inf Comput Sci 2002; 42:26–35.
- Discovery Studio, version 2.1; Accelrys Inc.: San Diego, CA, USA.