Abstract
Chemotypes comprising the d-annulated 1,3-dihydro-2H-1-benzazepin-2-one scaffold derived from the paullone structure were found to be potent vascular endothelial growth factor receptor 2 (VEGF-R2) kinase inhibitors. Three-dimensional quantitative structure-activity relationship (3D-QSAR) and docking studies were performed on a series of d-annulated benzazepinones with VEGF-R2 kinase inhibition activities. The comparative molecular field analysis and comparative molecular similarity indices analysis models using 32 molecules in the training set gave r2cv values of 0.811 and 0.769, r2 values of 0.962 and 0.953, respectively. 3D contour maps generated from the two models revealed that the electron-withdrawing groups at R1 and the bulky, electron-withdrawing as well as hydrogen bond donor groups at R2 position are favourable; the bulky, hydrogen bond acceptor substituent at R3 and the minor groups at R4 position may benefit the potency. We have designed a series of novel VEGF-R2 inhibitors by utilizing the SAR results revealed in the present study, which were predicted with excellent potencies in the developed models. The results may aid in designing of potential VEGF-R2 inhibitors with better activities.
Introduction
Protein kinases (PKs), as the most important and promising target classes for drug discovery nowadays, are in particular of pharmaceutical interestCitation1. Many PKs inhibitors are currently under preclinical research or in clinical trials, especially those cancer-relevant kinases inhibitorsCitation2. The vascular endothelial growth factor receptors (VEGF-Rs), a kind of tyrosine kinases, have been shown to play direct role in tumour angiogenesis by promoting endothelial cell proliferation and vascular permeability, key processes in angiogenesisCitation3,Citation4. Angiogenesis, the generation and growth of new blood vessels from the endothelium, is an essential event in a variety of physiological and pathological processesCitation5. In the angiogenesis process, new capillaries are generated from the established vasculatureCitation6, this is necessary for a solid tumour to grow beyond a certain volume for its growing depends on the supply of the cancer cells with oxygen, nutrients, and growth factors and removal of the waste products of metabolismCitation6,Citation7.
The VEGF-Rs family, which is consist of VEGF-R1 (Flt-1), VEGF-R2 (kinase insert domain receptor), and VEGF-R3 (Flt-4), have different binding specificities for corresponding VEGF members (VEGF-A to VEGF-E)Citation5,Citation7. Within the VEGF-Rs family, VEGF-R1 is mainly involved in physiological and developmental angiogenesis; VEGF-R3 is restricted mainly to lymphatic endothelial cells; while VEGF-R2 is responsible for almost all tumour angiogenesisCitation7. Antiangiogenesis therapies directed against VEGF-R kinases have been under active evaluation in clinical trialsCitation4,Citation8. Several inhibitors of VEGF-R kinases with excellent potency are currently undergoing clinical evaluation, including PTK787 (phase III), ZD6474 (phase II), CP-547,632 (phase I/II), and SU-11248 (phase I/II)Citation3.
VEGF-R2 is one of the crucial target structures of the mentioned cancer-relevant kinases. Since VEGF-R2 and other PKs of the kinome use adenosine triphosphate (ATP) as cofactor for the phosphorylation of proteins, they share a conserved ATP-binding pocket which is used to be binding site of most inhibitorsCitation9. Recently, many investigations on small molecule inhibitors with diverse pharmacophores as antiangiogenic agents targeting at VEGF-R2 have been carried out. A series of chemotypes comprising the d-annulated 1,3-dihydro-2H-1-benzazepin-2-one scaffold present in the paullone kinase inhibitor structure with high potency were reported by the literatureCitation7. The paullones () represent a group of inhibitors of cyclin-dependent kinases and glycogen synthase kinase-3Citation7. It was reported that the d-annulated benzazepinones (), as analogues of paullones showed excellent inhibitory activities towards VEGF-R2 and plol-like kinase 1. In this paper, the 39 compounds from literatureCitation7 were used as database for performing docking studies and three-dimensional quantitative structure-activity relationship (3D-QSAR).
Figure 1. Basic structure of paullones and d-annulated benzazepinones.
The use of 3D-QSAR methods including comparative molecular field analysis (CoMFA) and comparative molecular similarity indices analysis (CoMSIA) together provide excellent ability of visualization and interpretation of the correlations between the inhibitory activity and the 3D structures of these compounds. Docking was applied to investigate the binding mode and protein-ligand interactions between these inhibitors with the VEGF-R2. CoMFA and CoMSIA contour maps were generated to explain different structural requirements for the inhibitory activity. The constructed models not only can be used in rapidly and accurately predicting the activities of newly designed inhibitors, but also may provide some beneficial information in structural modification of these derivatives for better activities.
Methodology
Data sets
All the compounds and associated biological activities were obtained from literatureCitation7, 10 compounds exhibited extreme IC50 values and one derivative was an outlier, therefore, they were not included in our database. CoMFA and CoMSIA techniques were used in order to derive 3D-QSAR models for 32 d-annulated benzazepinones VEGF-R2 inhibitorsCitation7 as a training set. The in vitro inhibitory concentrations (IC50) values on VEGF-R2 in a radiometric PK assay of the molecules were converted into corresponding pIC50 by taking Log (1/IC50). The pIC50 values were used as the dependent variables in all the models subsequently developed. The derived QSAR models were further validated by performing a test set prediction using seven new molecules from the same literatureCitation7. The selection of training set and test set molecules were completed randomly. (Structures and associated inhibitory activities were shown in and .)
Table 1. The structures of the training and test set molecules.
Table 2. The actual pIC50s, predicted pIC50s (Pred.) and their residuals (Res.) of the training and test set molecules.
Molecular modelling and alignment
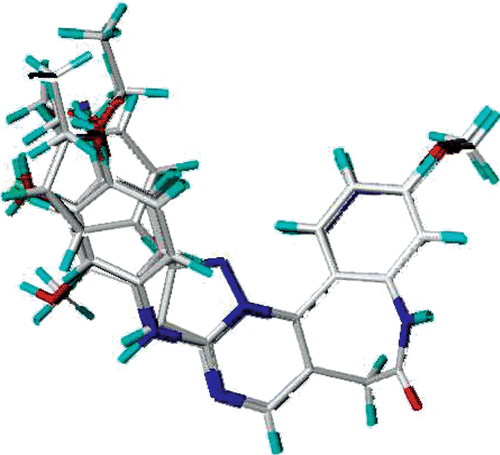
Structures of entire sets of d-annulated benzazepinones were built using SYBYL 8.1 program package of Tripos, Inc.Citation10 3D structures of all compounds were constructed using the Sketch Molecule module. Structural energy minimization was performed using the standard Tripos molecular mechanics force field and Gasteiger-Hückel chargeCitation11. The selected atoms of the template and common in all studied compounds for the superimposition during the alignment were C5, N-7, C-8, C-9 of the benzazepinone scaffold. The most active compound 29 was selected as a template. The aligned molecules were shown in .
Figure 2. Alignment of the compounds used in the training set.
CoMFA and CoMSIA setup
The CoMFA and CoMSIA descriptor fields were obtained by a 3D cubic lattice with grid spacing of 1 Å and extending to 4 Å units beyond the aligned molecules in all directionsCitation11. The van der Waals potentials and Coulombic terms were calculated by using Tripos force field. In CoMFA method a spCitation3 hybridized carbon atom with a charge of 1e served as the probe atom to calculate steric and electrostatic fields, in which their energy values were truncated at 30 kcal/molCitation12,Citation13. The CoMSIA method with the same lattice box that was used in CoMFA, incorporating steric, electrostatic, hydrophobic, hydrogen bond donor acceptor fields, were carried out using a probe atom with radius 1.0 Å, + 1.0 charge, and hydrophobic and hydrogen bond properties of + 1. The attenuation factor was set to the default value of 0.3Citation13–15.
Regression analysis and models validation
The initial partial least squares (PLS) analysis was performed using the leave one out cross-validation method for all 3D-QSAR analysesCitation16–18. PLS was conjunct with the cross-validation option to determine the optimum number of components (ONC) which were then used in deriving the final CoMFA and CoMSIA model without cross-validation. The ONC was the number of components resulted in highest cross-validated correlated correlation coefficient (r2cv), which was defined as fellows:
The Ypre, Yobs and Ymean are predicted, observed, and mean values of the target property (pIC50)Citation18–20. Column filtering was used at the default value of 2.0 kcal/mol. The final models were developed with ONC by using non-cross-validated analysis equal yielded the highest correlation coefficient (r2).
Predictive correlation coefficient (r2pred)
The predictive abilities were determined from a test set of seven compounds that were not included in the training set. These molecules were aligned to the template and their pIC50 values were predicted. The predictive correlation coefficient (r2pred), based on the molecules of test set, was defined as follows: r2pred = (SD-PRESS)/SD
SD is the sum of the squared deviations between the inhibitory activities of the test set and mean activities of the training molecules; PRESS is the sum of squared deviations between predicted and actual activity values for each molecule in the test setCitation17,Citation21–23.
External validation
It was revealed in the previous researches that a high cross-validated correlation coefficient (r2cv) is the necessary condition for a 3D-QSAR model to have a high predictive power. Nevertheless, it is not a sufficient condition. The only way to estimate the true predictive power of a model is to test it on an external validation. To evaluate the true predictive abilities of the established models, both the CoMFA and CoMSIA models were subjected to rigorous external validation process. Several statistics were employed according to literatureCitation24, such as r2m, r20, R, and k. The r2m was defined as follows:
Where, the r2 was the non-cross-validated correlation coefficient obtained from the PLS process, and the r20 was calculated as follows:
Where, the ![]() were the predicted pIC50s and the
were the predicted pIC50s and the ![]() was the average value of the predicted pIC50s, the
was the average value of the predicted pIC50s, the ![]() was obtained by this formula:
was obtained by this formula:
Where, the slope of regression lines through the origin (k) was defined as follows:
Where, the yi were the observed pIC50s.
The correlation coefficient (R) was calculated as follows:
Where, the ![]() was the average value of the observed pIC50s.
was the average value of the observed pIC50s.
For the ideal model, the correlation coefficient (R) is equal to 1. A real 3D-QSAR model may have a high predictive ability, if it is close to the ideal one. 3D-QSAR models were considered acceptable if they satisfy all of the following conditions: r2cv > 0.5, r2 > 0.6, [(r2 − r02)/r2] < 0.1, 0.85 ≤ k ≤ 1.15 and r2m > 0.5Citation24–27.
Molecular docking
To investigate the protein-ligand interactions, some compounds were docked into the ATP-binding site of VEGF-R2. The Surflex-Dock uses an empirical scoring function and a patented search engine to dock ligands into a protein’s binding site was applied to study molecular dockingCitation16. Crystal structure of VEGF-R2 was retrieved from Research Collaboratory for Structural Bioinformatics Protein Data Bank (PDB; PDB entry code: 1Y6A). The VEGF-R2 structure was utilized in subsequent docking experiments without energy minimization. The ligands were docked into corresponding protein’s binding site by an empirical scoring function and a patented search engine in Surflex-DockCitation10. All ligands and water molecules have been removed and the polar hydrogen atoms were added. Protomol, an idealized representation of a ligand that makes every potential interaction with the binding site was used to guide molecular docking. Establishment of protomol supplies three manners: (a) automatic: Surflex-Dock finds the largest cavity in the receptor protein; (b) ligand: A ligand in the same coordinate space as the receptor; (c) residues: specified residues in the receptorCitation10. In this paper, the automatic docking was applied. To visualize the binding mode between the protein and ligand, the Molecular Computer Aided Design (MOLCAD) program was employed. MOLCAD calculates and displays the surfaces of channels and cavities, as well as the separating surface between protein subunitsCitation10. MOLCAD program provides several types to create a molecular surface. In this paper, the Robbin surfaces which illustrated the secondary structure elements of the binding structure was applied, meanwhile the MOLCAD Robbin and Multi-Channel surfaces program displayed with cavity depth potential were established. Other parameters were established by default in software.
Results and discussion
Docking analysis
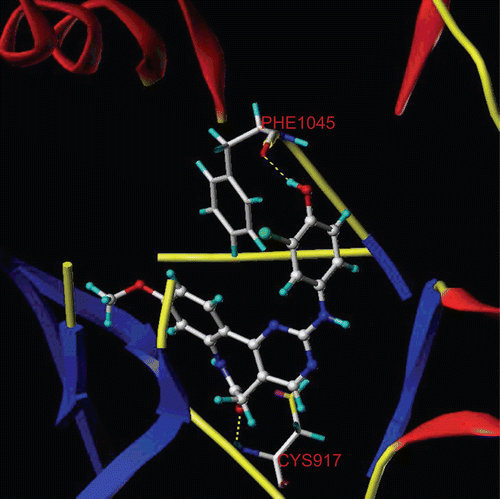
The most active compound 29 was selected as the template molecule and studied. The MOLCAD Robbin surfaces structure of the ATP pocket of the VEGF-R2 within the compound 29 was shown in , the key residues and hydrogen bonds were labelled. The α-helices were shown as helices or cylinders, while β-sheets were shown as arrows and the loop regions as tubes. As shown in , the carbonyl group at the benzazepinone scaffold acted as a hydrogen bond acceptor and formed H-bond with -NH group of the CYS917 residue, while the -OH group at the R2 position acted as a hydrogen bond donor by forming H-bond with the carbonyl group of the PHE1045 residue.
Figure 3. Molecular Computer Aided Design (MOLCAD) Robbin surface of the adenosine triphosphate-binding site of VEGF-R2 (PDB code: 1Y6A) within compound 29. Key residues and hydrogen bonds were labelled. The α-helices were shown as helices or cylinders, while β-sheets were shown as arrows and the loop regions as tubes.
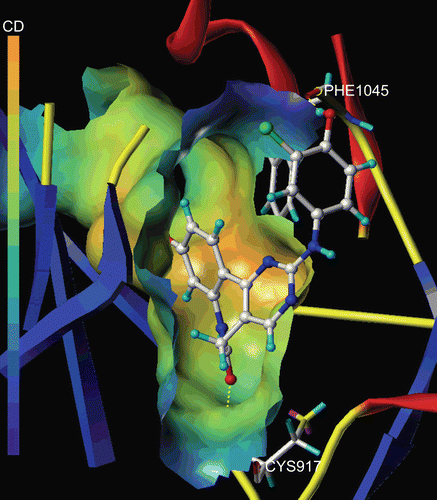
The MOLCAD Robbin and Multi-Channel surfaces structure of ATP-binding site of the VEGF-R2 were also developed and displayed with cavity depth potential to explore the ligand-receptor interactions. depicted the MOLCAD cavity depth potential surface of the ATP pocket within compound 29, the cavity depth colour ramp ranges from blue (low depth values = outside of the pocket) to light red (high depth values = cavities deep inside the pocket). As shown in , the phenyl group of R2 position was in the relative lower depth, while the rest parts of the compound 9 were anchored to the deep inside the ATP pocket. The performed docking studies highlighted the binding conformations between protein and ligand, which could used to help the analysis of 3D-QSAR model subsequently established.
Figure 4. The Molecular Computer Aided Design (MOLCAD) Robbin and multi-channel surfaces structure displayed with cavity depth (CD) potential of the adenosine triphosphate pocket of VEGF-R2 (PDB code: 1Y6A) within compound 29. The cavity depth colour ramp ranges from blue (low depth values = outside of the pocket) to light red (high depth values = cavities deep inside the pocket).
CoMFA model analysis
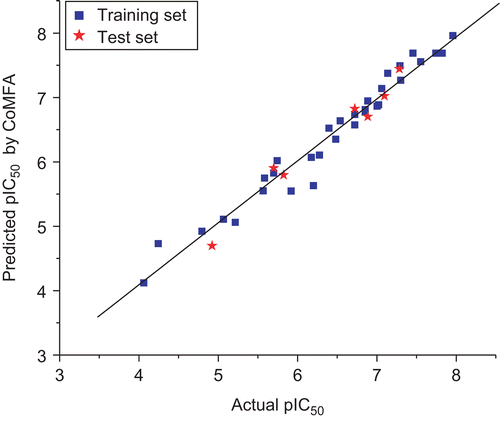
The results obtained from the PLS analysis were summarized in . The CoMFA model of a series of d-annulated benzazepinones gave a good cross-validated correlation coefficient (r2cv) of 0.811 (> 0.6) with an optimized component of 6, which suggested that the model should be a useful tool for predicting the IC50 values. A high non-cross-validated correlation coefficient (r2) of 0.962 with a standard error estimate (SEE) of 0.219, F-value of 105.080 and predictive correlation coefficient (r2pred) of 0.968 was obtained. Contributions of steric and electrostatic fields were 0.616 and 0.384, respectively. The actual and predicted pIC50 values of the training set and test set by the model were given in , and the graph of actual activity versus predicted pIC50 of the training set and test set was illustrated in .
Table 3. Results of CoMFA and CoMSIA models.
Figure 5. Graph of actual versus predicted pIC50 of the training set and the test set using CoMFA.
CoMSIA model analysis
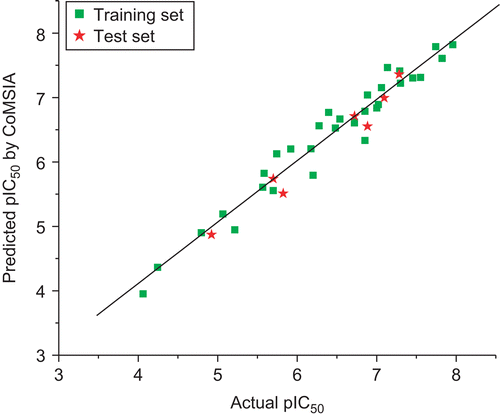
The CoMSIA model using steric, electrostatic, hydrophobic, hydrogen bond donor, and acceptor fields gave a good cross-validated correlation coefficient (r2cv) of 0.769 (> 0.6) with an optimized component of 6. A high non-cross-validated correlation coefficient (r2) of 0.953 with a SEE of 0.244, F-value of 83.926 and predictive correlation coefficient (r2pred) of 0.954 was obtained. Contributions of steric, electrostatic hydrophobic, hydrogen bond donor, and acceptor fields were 0.119, 0.236, 0.328, 0.144, and 0.173, respectively. The actual and predicted pIC50 values and residual values for training set and test set compounds were given in . The relationship between actual and predicted pIC50 of the training set and test set compounds was illustrated in .
Figure 6. Graph of actual versus predicted pIC50 of the training set and the test set using CoMSIA.
External validation of the CoMFA and CoMSIA models
The results of the external validation were shown in . The CoMFA and CoMSIA models using seven derivatives in the test set, gave excellent r2m values of 0.826 and 0.792 (> 0.5) respectively. The high slope of regression lines through the origin (k) values of 0.982 and 0.983 (0.85 ≤ k ≤ 1.15), and correlation coefficient (R) values of 0.962 and 0.954 (close to 1), the calculated [(r2 − r02)/r2] values of −0.021 and −0.030 (< 0.1) were also obtained. The results of the external validation demonstrated that the CoMFA and CoMSIA models established by present study possessed a high accommodating capacity, and indicated that they will be reliable for being used to predict the activities of new derivatives.
CoMFA contour maps
depicted the steric and electrostatic contour plots for compound 29 possessing the highest activity. The steric field defined by the green coloured contours represent regions of high steric tolerance (80% contribution), while yellow coloured contours represent regions of unfavourable steric effect (20% contribution). In electrostatic contour, the blue coloured contours indicate the regions where electron-donating groups enhance the activity (80% contribution) and red coloured contours where the electron-withdrawing groups benefit the potency (20% contribution).
Figure 7. Standard coefficient contour maps of CoMFA analysis with 2 Å grid spacing in combination with compound 29. (A) Steric fields: green contours (80% contribution) indicate regions where bulky groups increase activity, while yellow contours (20% contribution) indicate regions where bulky groups decrease activity, and (B) electrostatic fields: blue contours (80% contribution) indicate regions where electron-donating groups increase activity, while red contours (20% contribution) indicate regions where electron-withdrawing groups increase activity.
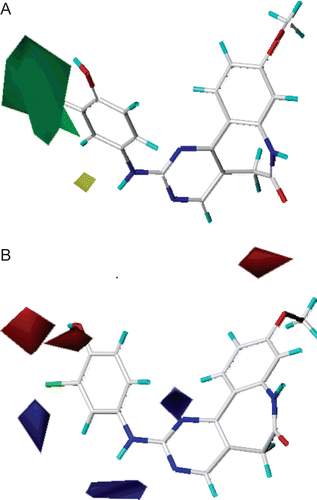
As shown in , the R2 and R3 position was surrounded by a big green contour, which suggested bulky groups at this region would increase the inhibitory activity. Compared compound 1 with 2, 3 with 4, as well as 6 with 7, it can be easily find that their activity discrepancies may be explained by this green contour. This also may explain why compounds 10, 14, 21, 22, 24–26, 28–29, 32 which possessed a relative bulkier group (e.g. -OH, -OCH3, -OC2H5) at R2 showed significant enhanced activities than those that with a hydrogen atom at R2. Besides, compounds 8, 17 and 29 had an order for the potency of 29 > 17> 8, with the corresponding R3 substituent -Cl, -OH and –H, respectively. Additionally, compounds 17, 21–22, 27–29 with -Cl or -OH groups at the R3 position were the most active compounds. The presence of the small yellow contour around the R4 position suggested a bulky group at this region would be unfavourable. By checking all the R4 modified compounds, we can discover that derivatives 8, 18 and 19 have the activity order of 8 (R4 = H) > 18 (R4 = -Cl) > 19 (R4 = -Br), compound 19 was the most inactive compounds in the data set. This is satisfactory according to the contour map.
As shown in , a red contour around the R1 position revealed the electron-withdrawing substituent was favourable for the inhibitory activity. Take the compounds 24–29 (R1 = -OCH3) for example, compared to other compounds which possessed a H atom at the R1 position, the electron-withdrawing -OCH3 group at the benzene ring resulted in significant enhanced activity. The red contour near R2 position suggested the electron-withdrawing groups on this position benefited potency, this may be the reason that compounds 10, 14, 21–22, 24–26, 28–29, 32, 34 which possessed electron-withdrawing groups (-OH, -OCH3, -OC2H5) at R2 had higher potencies than the rest compounds which with a H atom. For instance, compounds 15 and 19 both possessed a -Br substituent, one in R2 position (15) and the other in R4 position (19), however, compound 15 was nearly 200-fold more potential than 19, and their activity discrepancies can be explained by this red contour. The red and blue contours near the R3 position pointed out that the electrostatic effect at this region was not very important for the inhibitory activity.
CoMSIA contour maps
depicted the steric, electrostatic, hydrophobic, hydrogen bond donor, and acceptor contours plots for compound 29. The steric and electrostatic contours were similar to that of CoMFA method. In hydrophobic field, white (20% contribution) and yellow (80% contribution) contours highlighted areas where hydrophilic and hydrophobic properties were favoured. In hydrogen bond donor field, the cyan (80% contribution) and purple (20% contribution) contours indicated favourable and unfavourable hydrogen bond donor groups. In hydrogen bond acceptor field, the magenta (80% contribution) and red (20% contribution) contours identified favourable and unfavourable positions for hydrogen bond acceptors.
Figure 8. Standard coefficient contour maps of CoMSIA analysis with 2 Å grid spacing in combination with compound 29. (A) Steric contour map. Green and yellow contours refer to sterically favoured and unfavoured regions. (B) Electrostatic contour map. Blue and red contours refer to regions where electron-donating and electron-withdrawing groups are favoured. (C) Hydrophobic contour map. White and yellow contours refer to regions where hydrophilic and hydrophobic substituents are favoured. (D) Hydrogen bond donor and acceptor contour map. The cyan and purple contours indicate favourable and unfavourable hydrogen bond donor groups. The magenta and red contours demonstrated favourable and unfavourable hydrogen bond acceptor groups.
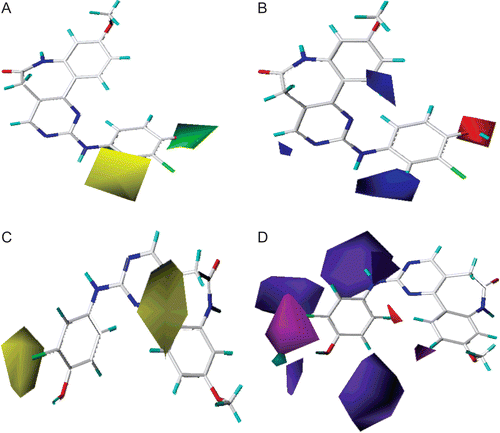
As shown in , the big yellow contour around the benzazepinone scaffold indicated the extreme importance of the hydrophobic benzazepinone group. Replaced the aromatic atom with hydrophilic atom may decrease activity. Compounds 5–7 as well as 35–39, which replaced the carbon atom of benzazepinone with an electron-rich nitrogen atom, were the most inactive compounds. Another yellow contour near the phenyl group also revealed that a hydrophobic group at this position was essential for the inhibitory activity. This yellow contour along with the green contour of CoMFA steric field may explain compounds 2, 4, and 5 which possessed a phenyl group at this position showed significant enhanced potency than compounds 1, 3, and 6 which only had an H atom.
In , the cyan contour near R2 position suggested that a hydrogen bond donor group would benefit the activity. In fact, the hydroxyl group at this position acted as hydrogen bond donor and formed H-bond with the carbonyl group of the PHE1045 residue. Compounds 17, 22, 24, 29, and 35 with a hydroxyl group at R2 were the most active compounds of the dataset. The magenta contour near the R3 position indicated that a hydrogen bond acceptor group would be favourable. Compounds 22, 29, and 34 which had a -Cl substituent at R3 showed excellent inhibitory potencies.
Summary of structure-activity relationship
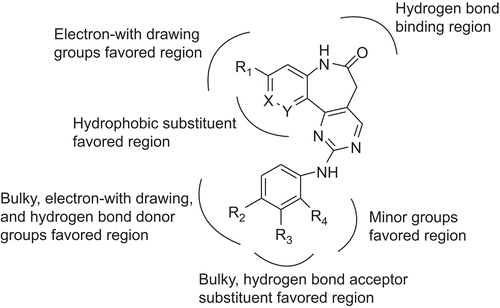
The structure-activity relationship revealed by 3D-QSAR and molecular docking studies were illustrated in . In detail, the electron-withdrawing groups at R1 would be favourable; the bulky, electron-withdrawing and hydrogen bond donor groups at R2 position are favourable; bulky, hydrogen bond acceptor substituent at R3 position would increase the activity; the minor groups at R4 position may benefit the potency. The phenyl group of benzazepinone was essential for the inhibitory activity. The carbonyl group at the benzazepinone scaffold and the -OH group at the R2 position were responsible for binding to the residues of the ATP pocket.
Figure 9. Structure-activity relationship revealed by 3D-QSAR and docking studies.
Design for newly inhibitors
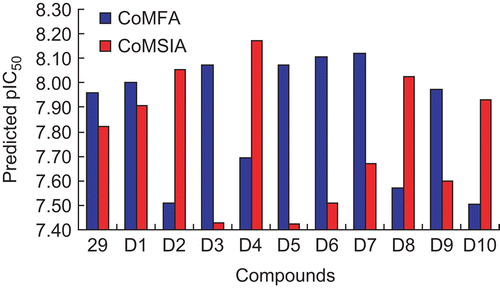
Based on the structure-activity relationship revealed by this study and the synthetic availability of these derivatives, we have designed a series of novel compounds, these molecules were aligned to the database and their activities were predicted by the CoMFA and CoMSIA models previously established. The chemical structures and predicted pIC50 values of these compounds were shown in . The predicted pIC50 values of these compounds versus that of the most active compound 29 were illustrated in . Most of the designed molecules showed better pIC50 values than compound 29, which validated the structure-activity relationship obtained by this study.
Table 4. Chemical structures of newly designed inhibitors and their predicted pIC50 values.
Figure 10. Graph of the predicted pIC50 of designed inhibitors versus compound 29 using CoMFA and CoMSIA.
Conclusion
In the present study, molecular docking and 3D-QSAR have been successfully applied to a set of recently synthesized VEGF-R2 inhibitors. To summarize, molecular docking study was firstly performed to obtain a satisfactory position of the ligand in the ATP-binding site of VEGF-R2. Then, the 3D-QSAR models were computed with the CoMFA and CoMSIA methods. Both the molecular docking and 3D-QSAR models have been generated and give reliable correlative and predictive abilities. Furthermore, the CoMFA and CoMSIA contour maps along with the docking results offered enough information to understand the structure-activity relationship and identified structural features influencing the inhibitory activity. Both the 3D-QSAR and docking models provided useful information in understanding the structural features of the target and chemical features of the ligands. The structure-activity relationships revealed by 3D-QSAR and docking were validated by newly designed derivatives. The information can also be used to design novel molecules with desired activity.
Acknowledgement
This work was dedicated to Professor Henry N.C. Wong on the occasion of his 60th birthday.
Declaration of interest
This research work is supported by ‘the Fundamental Research Funds for the Central Universities’ (No. 21610405), China.
References
- Peifer C, Bühler S, Hauser D, Kinkel K, Totzke F, Schächtele C, Laufer S. Design, synthesis and characterization of N9/N7-substituted 6-aminopurines as VEGF-R and EGF-R inhibitors. Eur J Med Chem 2009; 44:1788–1793.
- Sun L, Liang C, Shirazian S, Zhou Y, Miller T, Cui J, Fukuda JY, Chu JY, Nematalla A, Wang X, Chen H, Sistla A, Luu TC, Tang F, Wei J, Tang C. Discovery of 5-[5-fluoro-2-oxo-1,2- dihydroindol-(3Z)-ylidenemethyl]-2,4- dimethyl-1H-pyrrole-3-carboxylic acid (2-diethylaminoethyl)amide, a novel tyrosine kinase inhibitor targeting vascular endothelial and platelet-derived growth factor receptor tyrosine kinase. J Med Chem 2003; 46:1116–1119.
- Gingrich DE, Reddy DR, Iqbal MA, Singh J, Aimone LD, Angeles TS, Albom M, Yang S, Ator MA, Meyer SL, Robinson C, Ruggeri BA, Dionne CA, Vaught JL, Mallamo JP, Hudkins RL. A new class of potent vascular endothelial growth factor receptor tyrosine kinase inhibitors: structure-activity relationships for a series of 9-alkoxymethyl-12-(3-hydroxypropyl)indeno[2,1-a]pyrrolo[3,4-c]carbazole-5-ones and the identification of CEP-5214 and its dimethylglycine ester prodrug clinical candidate CEP-7055. J Med Chem 2003; 46:5375–5388.
- Sun L, Tran N, Liang C, Hubbard S, Tang F, Lipson K, Schreck R, Zhou Y, McMahon G, Tang C. Identification of substituted 3-[(4,5,6, 7-tetrahydro-1H-indol-2-yl)methylene]-1,3-dihydroindol-2-ones as growth factor receptor inhibitors for VEGF-R2 (Flk-1/KDR), FGF-R1, and PDGF-Rbeta tyrosine kinases. J Med Chem 2000; 43:2655–2663.
- Peifer C, Selig R, Kinkel K, Ott D, Totzke F, Schächtele C, Heidenreich R, Röcken M, Schollmeyer D, Laufer S. Design, synthesis, and biological evaluation of novel 3-aryl-4-(1H-indole-3yl)-1,5-dihydro-2H-pyrrole-2-ones as vascular endothelial growth factor receptor (VEGF-R) inhibitors. J Med Chem 2008; 51:3814–3824.
- Baindur N, Chadha N, Brandt BM, Asgari D, Patch RJ, Schalk-Hihi C, Carver TE, Petrounia IP, Baumann CA, Ott H, Manthey C, Springer BA, Player MR. 2-Hydroxy-4,6-diamino-[1,3,5]triazines: a novel class of VEGF-R2 (KDR) tyrosine kinase inhibitors. J Med Chem 2005; 48:1717–1720.
- Egert-Schmidt AM, Dreher J, Dunkel U, Kohfeld S, Preu L, Weber H, Ehlert JE, Mutschler B, Totzke F, Schächtele C, Kubbutat MH, Baumann K, Kunick C. Identification of 2-anilino-9-methoxy-5,7-dihydro-6H-pyrimido[5,4-d][1]benzazepin-6-ones as dual PLK1/VEGF-R2 kinase inhibitor chemotypes by structure-based lead generation. J Med Chem 2010; 53:2433–2442.
- Sun L, Tran N, Liang C, Tang F, Rice A, Schreck R, Waltz K, Shawver LK, McMahon G, Tang C. Design, synthesis, and evaluations of substituted 3-[(3- or 4-carboxyethylpyrrol-2-yl)methylidenyl]indolin-2-ones as inhibitors of VEGF, FGF, and PDGF receptor tyrosine kinases. J Med Chem 1999; 42:5120–5130.
- Peifer C, Stoiber T, Unger E, Totzke F, Schächtele C, Marmé D, Brenk R, Klebe G, Schollmeyer D, Dannhardt G. Profile and molecular modeling of 3-(indole-3-yl)-4-(3,4,5-trimethoxyphenyl)-1H-pyrrole-2,5-dione(1) as a highly selective VEGF-R2/3 inhibitor. J Med Chem 2006;49:7549–7553.
- Sybyl 8.1. St. Louis, US: Tripos Inc.
- Song Q-L, Sun P-H, Chen W-M. Exploring 3D-QSAR for ketolide derivatives as antibacterial agents using CoMFA and CoMSIA. Lett Drug Des Discov 2010;7:149–159.
- Politi A, Durdagi S, Moutevelis-Minakakis P, Kokotos G, Papadopoulos MG, Mavromoustakos T. Application of 3D-QSAR CoMFA/CoMSIA and in silico docking studies on novel renin inhibitors against cardiovascular diseases. Eur J Med Chem 2009; 44:3703–3711.
- Cichero E, Cesarini S, Fossa P, Spallarossa A, Mosti L. Thiocarbamates as non-nucleoside HIV-1 reverse transcriptase inhibitors: docking-based CoMFA and CoMSIA analyses. Eur J Med Chem 2009; 44:2059–2070.
- Pan X, Tan N, Zeng G, Huang H, Yan H. 3D-QSAR studies on ketoamides of human cathepsin K inhibitors based on two different alignment methods. Eur J Med Chem 2010; 45:667–681.
- Sun J, Cai S, Yan N, Mei H. Docking and 3D-QSAR studies of influenza neuraminidase inhibitors using three-dimensional holographic vector of atomic interaction field analysis. Eur J Med Chem 2010; 45:1008–1014.
- Ravindra GK, Achaiah G, Sastry GN. Molecular modeling studies of phenoxypyrimidinyl imidazoles as p38 kinase inhibitors using QSAR and docking. Eur J Med Chem 2008; 43:830–838.
- Teixeira C, Serradji N, Maurel F, Barbault F. Docking and 3D-QSAR studies of BMS-806 analogs as HIV-1 gp120 entry inhibitors. Eur J Med Chem 2009; 44:3524–3532.
- Lee JH, Kang NS, Yoo SE. Docking-based 3D-QSAR study for 11beta-HSD1 inhibitors. Bioorg Med Chem Lett 2008; 18:2479–2490.
- Geldenhuys WJ, Nakamura H. 3D-QSAR and docking studies on transforming growth factor (TGF)-beta receptor 1 antagonists. Bioorg Med Chem Lett 2010; 20:1918–1923.
- Du J, Lei B, Qin J, Liu H, Yao X. Molecular modeling studies of vasclar endothelial growth factor receptor tyrosine kinase inhibitors using QSAR and docking. J Mol Grap Model 2009;27:642–654.
- Fratev F, Benfenati E. A combination of 3D-QSAR, docking, local-binding energy (LBE) and GRID study of the species differences in the carcinogenicity of benzene derivatives chemicals. J Mol Graph Model 2008; 27:147–160.
- Hu R, Barbault F, Delamar M, Zhang R. Receptor- and ligand-based 3D-QSAR study for a series of non-nucleoside HIV-1 reverse transcriptase inhibitors. Bioorg Med Chem 2009; 17:2400–2409.
- Gueto C, Torres J, Vivas-Reyes R. CoMFA, LeapFrog and blind docking studies on sulfonanilide derivatives acting as selective aromatase expression regulators. Eur J Med Chem 2009; 44:3445–3451.
- Golbraikh A, Tropsha A. Beware of q2! J Mol Graph Model 2002; 20:269–276.
- Basu A, Jasu K, Jayaprakash V, Mishra N, Ojha P, Bhattacharya S. Development of CoMFA and CoMSIA models of cytotoxicity data of anti-HIV-1-phenylamino-1H-imidazole derivatives. Eur J Med Chem 2009; 44:2400–2407.
- Lu P, Wei X, Zhang R. CoMFA and CoMSIA 3D-QSAR studies on quionolone caroxylic acid derivatives inhibitors of HIV-1 integrase. Eur J Med Chem 2010; 45:3413–3419.
- Roy PP, Roy K. On some aspects of variable selection for partial least squares regression models. QSAR Comb Sci 2008;27:302–313.