Abstract
A new malbrancheamide analogue, isomalbrancheamide B (3), along with three known compounds, malbrancheamide (1), isomalbrancheamide (2), and premalbrancheamide (4), were isolated in higher yields from the alkaloid fraction of the fungus Malbranchea aurantiaca. The interaction of the alkaloids 1–4 with calmodulin (CaM) was analyzed using different enzymatic, fluorescence, spectroscopic, nuclear magnetic resonance (NMR), and molecular modelling techniques. On the basis of the enzymatic and fluorescence experiments, malbrancheamides 1–3 are classical CaM inhibitors. Compound 4, however, did not quench the extrinsic fluorescence of the CaM biosensor indicating that it could be a functional inhibitor. Circular dichroism, NMR, and molecular modelling studies revealed that 1 binds to CaM in the same hydrophobic pocket than the chlorpromazine and trifluoperazine, two classical CaM inhibitors. Thus, malbrancheamide and related monochlorinated analogues are compounds with a high potential for the development of new therapeutic agents, involving CaM as their molecular target.
Introduction
Calmodulin (CaM), the primary transducer of Ca2+-mediated signals in eukaryotes, is a small multifunctional protein of 148 amino acids, highly conserved through evolution. The crystal structure of this protein revealed a dumbbell-shaped molecule with two globular domains connected by a flexible linkerCitation1–3. Each domain consists of two-loop-helix Ca2+-binding regions referred to as EF-hand structures, which expose hydrophobic surfaces. These hydrophobic regions interact with a large number of regulatory proteins including phosphatases, kinases, and ion channels. As a consequence, CaM plays an important role in muscle contraction, intracellular movement, DNA repair, cell proliferation, apoptosis, and short- and long-term memory, among other important physiological eventsCitation4–6.
The regulatory properties of CaM can be inhibited by a wide range of drugs and peptides, which modify its function by blocking its interaction with other proteins. Such is the case of the antipsychotics phenotiazines trifluoperazine (TFP) and chlorpromazine (CPZ), which bind to CaM through hydrophobic interactions with high affinity and known stoichiometryCitation7–9. Other compounds, however, bind to CaM with lower specificity and uncertain stoichiometryCitation10,Citation11. In any case, CaM inhibitors might have important pharmacological repercussions thus representing important leads for the development of new drugs; on the other hand, the analysis of such events are important for the study of protein interactions and could help to understand better the physiological role of CaM.
As part of our efforts to search for new potent and specific CaM inhibitors, we previously reported the isolation and structure elucidation of two novel indole alkaloids, namely malbrancheamide (1) and malbrancheamide B (2), from both the mycelium and culture broth of the fungus Malbranchea aurantiaca Sigler & Carmichael (Myxotrichaceae)Citation12,Citation13. Compounds 1 and 2 inhibited the activation of the CaM-deficient-CaM-dependent cyclic adenosine monophosphate (cAMP) phosphodiesterase (PDE1), such as CPZ. According to a kinetic analysis, alkaloid 1 competitively inhibits the regulation of PDE1 by CaM in a concentration dependent manner. Furthermore, several structural analogues of the malbrancheamides, prepared while attempting the synthesis of 1 and 2, were functionally tested for their ability to inhibit PDE114. The relative stereochemistry at C-12a, the bicyclo[2.2.2]diazaoctane core oxidation state, and the indole chlorination of these analogues were found to have an important impact on the enzymatic activity of the complex CaM-PDE1Citation14. However, none of the tested compounds was more active than 1.
Since 1 is a potent inhibitor of the complex CaM-PDE1, the main goal of the present investigation was to determine the nature of its inhibition (classical vs. functional), in solution, using fluorescence, circular dichroism (CD), and nuclear magnetic resonance (NMR) titration experiments, as well as molecular modelling studies.
Materials and methods
General experimental procedures
Infrared (IR) spectra were taken on a Perkin-Elmer 599B spectrophotometer in KBr disks. CD was recorded on a JASCO J-715 spectrometer equipped with a thermostated cell-holder under N2 atmosphere at 37°C. 1D and 2D NMR spectra were recorded with a Varian Innova 500 or on a Varian Unity plus 400 spectrometers at 500 MHz (1H) or 125 MHz (13C), and 400 MHz (1H) or 100 MHz (13C), respectively. High resolution mass spectra by fast atom bombardment (HRMS-FAB+) were measured on a JEOL JMSAX505HA mass spectrometer. Melting points were obtained with a Fisher–Johns melting point apparatus and are reported uncorrected. Semi-preparative high-performance liquid chromatography (HPLC) was performed using a Symmetry C18 (7 μm, 7.8 × 300 mm; Waters, Milford, MA, USA), a Nucleosil C18 (5 μm, 10 × 250 mm; Phenomenex, Torrance, CA, USA), or a Purospher STAR RP-18e (5 μm, 10 × 250 mm; Merck, Darmstadt, Germany) columns. Control of the equipment, data acquisition, processing, and management were performed by the Empower 2 software (Waters). Open column chromatography (CC) was carried out on Si-gel 60 (0.063–0.200 mm), 70-230 Mesh (Merck, Darmstadt, Germany).
Fungal material
M. aurantiaca Sigler & Carmichael (Myxotrichaceae) was collected from bat detritus in the Juxtlahuaca Caves, Guerrero, Mexico, in December 2002. A voucher specimen (# 24428) of M. aurantiaca was deposited in the mycological collection of the Laboratorio de Micopatología, Instituto de Biología, UNAM.
Extraction and isolation
Forty litres of potato dextrose broth (PDB; Difco, Detroit, MI, USA) were inoculated with 10 cm2 agar plugs, taken from a stock culture of M. aurantiaca maintained at 4°C on potato dextrose agar (Difco). Culture broth was incubated at room temperature for 30 days. After incubation, the fermented whole broth (40 L) was filtered through cheesecloth to separate into supernatant and mycelia. The former was extracted exhaustively with CH2Cl2 (3 × 40 L). The combined organic phase was dried over anhydrous Na2SO4 and concentrated in vacuo to give a dark brown solid (9 g). The mycelium was macerated with CH2Cl2 (3 × 10 L). After evaporating the solvent in vacuo, 12.0 g of combined mycelia and culture extract were obtained. Six grams of the extract were subjected to Si-gel CC with a hexane-CH2Cl2-MeOH gradient to yield 19 primary fractions (F1-F19). Fraction F14 (312 mg) was further resolved by preparative HPLC (Symmetry C18, MeCN, flow rate 2.0 mL/min) to yield compounds 1 (93.4 mg; RT 6.1 min), 4 (8.0 mg; RT 5.0 min), and a mixture of 2 and 3 (47.6 mg). The latter was separated on a Nucleosil C18 column eluting with MeOH (flow rate 3.5 mL/min) to afford pure compounds 2 (30.0 mg; RT 4.9 min) and 3 (5.0 mg; RT 5.3 min). The remaining part of the crude extract (6 g) was submitted to an acid-base treatment as follows: the extract was dissolved in CH2Cl2 (2 L) and extensively partitioned with HCl 1N (4 × 2 L); then, the acid extracts were basified with NH4OH 1N until pH 9, and extracted with CH2Cl2 (4 × 2 L). The resulting organic fractions were dried over Na2SO4 and concentrated in vacuo to yield 591 mg of crude alkaloidal fraction (FA). FA was resolved on a reverse phase Purospher STAR column eluting with MeCN (flow rate 2.0 mL/min) to yield compounds 1 (199.2 mg; RT 7.4 min), 4 (12.4 mg; RT 5.7 min), and a mixture of 2 and 3 (71.1 mg). The latter was resolved using a Nucleosil C18 column eluting with MeOH (flow rate 2.0 mL/min) to give 2 (19.2 mg; RT 7.05 min) and 3 (40.6 mg; RT 7.6 min).
Isomalbrancheamide B (3). White solid; m.p. 319–321°C; ultraviolet (UV)/vis (MeOH): λmax (log ϵ) = 233 (3.90), 284 (4.70) nm; IR (KBr): vmax = 3296, 2954, 2920, 1737, 1657, 1460, 1313, and 1240 cm−1; 1H-NMR (400 MHz, MeOH-d4) δH: 7.32 (d, J = 2 Hz; H-7), 7.22 (d, J = 8.6 Hz; H-10), 7.00 (dd, J = 2.6, 8.6 Hz; H-9), 3.42 (d, J = 10.0 Hz; H-5B), 3.05 (m; H-3A), 2.86 (m; H-6A), 2.85 (m; H-6B), 2.51 (m; H-1A), 2.26 (dd, J = 2.0, 10.0 Hz; H-5A), 2.15 (q, J = 2.0, 5.0 Hz; H-3B), 2.14 (m; H-12A), 1.99 (m; H-13A), 1.94 (m; H-13B), 1.86 (m; H-2), 1.46 (m; H-1B), 1.42 (s; H-17), 1.32 (s; H-16); 13C-NMR (100 MHz; MeOH-d4) δC: 23.6, 24.2, 27.8, 28.2, 30.3, 30.8, 32.6, 49.8, 52.9, 55.3, 59.5, 66.1, 104.9, 111.6, 117.9, 120.0, 123.0, 125.3, 135.6, 146.7, 176.7; HRMS-FAB+: m/z 369.1589, calculated for C21H24N3OCl: 369.1608.
Protein purification
Unlabelled and fluorescent-engineered human calmodulin (hCaM) were modified, over-expressed, and purified from Escherichia coli strain BL21-A1, as previously described by González-Andrade et al.Citation15. Uniformly Citation15N and 13C labelled hCaM were prepared in a salts minimal M9 medium containing 15NH4Cl (0.5 g/L) and 13C6-glucose (1.5 g/L), following the same procedure as for the unlabelled protein.
PDE1 activity assay
PDE1 activity was measured according to the method described by Rivero et al. with some modificationsCitation16. Briefly, CaM (0.08 μg) was incubated with 0.015 units of PDE1 from bovine brain (Sigma, St. Louis, MO, USA), during 30 min in 40 μL of assay solution containing: 0.063 units of 5′-nucleotidase (Crotalus atrox venom; Sigma), 45 mM Tris-HCl, 5.6 mM magnesium acetate, 45 mM imidazole, 2.5 mM calcium chloride, and 10 mM bovine serum albumin, pH 7.0. Tested compounds were then added to the assay medium at 0.5, 1, 2, 3, 4, 7, 13, 20, 32, 50, and 65 mM in MeCN-water (1:1), and the samples incubated during 30 min; thereafter 10 μL of 10.8 mM cAMP were added to start the assay. After 15 min, the assay was stopped by the addition of 190 μL of malachite green solution. The amount of inorganic phosphate released was measured at 700 nm, and correlated with the activity of the PDE1. CPZ was used as positive control. All the results are expressed as the mean of at least six experiments ± SEM. The IC50 (concentration inhibiting by 50% the activity of the enzyme) values were determined by non-linear regression analysis by fitting to hyperbolic inhibition.
Steady-state fluorescence
All experiments were performed on an ISS-PC1 spectrofluorophotometer (ISS, Champaign, IL). Protein-specific intrinsic fluorescence of CaM (5 μM) in phosphate buffer (100 mM, pH 5.1) with CaCl2 (10 mM) was scanned between 400 and 550 nm at 381 nm of excitation. Each sample was stirred and titrated with compounds 1–4 to a different final protein/inhibitor ratio. The samples were contained in a 2 mL thermostat container with excitation and emission path lengths of 1 nm, at 37°C. Fluorescence emission spectra were acquired with excitation and emission slit widths of 4 and 8 nm, respectively. The apparent dissociation constant (Kd) and fractional degree of saturated CaM with ligand (v0) values were determined by fitting to the following second order equation:
where P0 and L0 are the total concentrations of the protein and inhibitor, respectively, and Kd is the apparent dissociation constant for the ligand. CPZ was used as positive control. All data were analyzed using the Origin version 8.0 program (OriginLab, Northampton, MA).
Circular dichroism
CD was performed with samples of pure protein and complexed with the inhibitor. The concentration of protein used was 5 μM and ligands at saturation (100 μM), in 100 mM of potassium acetate (pH 5.1) at 37°C. The data were acquired with the following specifications: range of 200–260 nm, resolution of 1.0 nm, band width 1.0 nm, sensitivity of 100 mdeg, and speed of 8 nm min−1. The α-helix/β-sheet structural content of CaM, in the presence of Ca2+ and the inhibitors, was calculated using the K2D2 softwareCitation17.
NMR titration experiments
All experiments were run in the Varian Innova 500 instrument equipped with a 1H, 13C, 15N TXI probe, by using sample tubes with a 5 mm outer diameter. Two-dimensional NMR spectra were recorded in the phase-sensitive mode using the States-TPPI method, and were carried out using the WATERGATE pulse sequence or excitation sculpting for water suppression to eliminate solvent signal in H2O/2H2O (95:5) solution. CaM solution (1.5 mM) was prepared in a 5% 2H2O solution containing 50 mM TRIS-HCl, and 10.6 mM CaCl2, and was titrated with 1 at final concentrations between 0 and 6 mM. 1H-13C and 1H-15N heteronuclear single quantum coherence (HSQC) experiments were acquired at 308 K and processed using vNMRj software (Varian Inc., Palo Alto, CA).
Docking simulations
To generate a more accurate and physically realistic model of CaM (PDB code: 1A29), several iterations of rebuilding and refinement, using the idealization application of Rosetta 3.1 software, were performed. Docking simulations of the final all-atom refinement of CaM and compound 1 were carried out using AutoDock 4.0Citation18,Citation19. Default parameters were used except for the number of GA runs (100). The protein was held rigid during the docking process while the ligand was allowed to be flexible. The grid box size was 60 Å × 60 Å × 60 Å in the x, y, and z dimensions, with the centre of the grid corresponding to the protein. FlexDock analyses were carried out using the residues found to 9 Å from the centre of the complex Ca2+-CaM-1 (Glu14, Phe16, Leu18, Phe19, Leu32, Val35, Met36, Ser38, Leu39, Met51, Phe68, Met71, Met72, Met76, Val91, Phe92, Leu105, Val108, Met109, Thr110, Asn111, Lau112, Glu114, Met124, Phe141, Met144, and Met145). The docked inhibitor-enzyme complexes were ranked according to the predicted binding energies and on the basis of the ideal conformation of the docked structures. The root-mean-square deviation (RMSD) values for each residue involved in the flexible docking were calculated in the RMSD software implemented in VMD 1.8.6 program.
Results and discussion
Reinvestigation of the extract from the mycelium and culture medium of M. aurantiaca led to the isolation of isomalbrancheamide B (3) [(5aS,12aS,13aS)-9-chloro-12,12-dimethyl-2,3,11,12,12a,13-hexahydro-1H,6H 5a,13a-(epiminomethano) indolizino[7,6b]carbazol-14-one (3)], along with the known compounds malbrancheamide (1), malbrancheamide B (2), and premalbrancheamide (4) ()Citation13,Citation20. Compound 4 was recently detected in the fungus culture by Ding et al.Citation21 while studying the biosynthesis of 1 and 2.
Figure 1. Structures of malbranchemide analogues.
For the isolation of the malbrancheamide series, the initial extract was split in two equal parts: from the first one, compounds 1–4 were isolated by CC and HPLC procedures; the second, however, was subjected to an acid-base partition process to yield a crude FA. HPLC separation of FA led to the isolation of compounds 1–4 (see Supplementary Figure 1). Comparison between the two isolation strategies showed that the yield of 1 was significantly higher with the second method (5.19 vs 9.82%, respectively).
Compounds 1 and 2 were characterized by comparison with authentic samples previously isolated from M. aurantiacaCitation12–14, and the NMR data of 4 was consistent with the synthetic premalbrancheamide described by Ding et al.Citation21. Compound 3 is a new natural product and its complete structural characterization was achieved using a combination of IR, CD, UV, as well as 1D (1H and 13C-NMR) and 2D (HSQC and HMBC) NMR analyses. The molecular formula calculated from HRMS data was identical to that of 2 suggesting that both were isomers. The NMR spectra of 3 were almost identical to those of 2. The most important differences were observed in the 1H spectra, which in both cases displayed an ABX system for the aromatic protons, but as expected, their chemical shifts were different. Thus, the signals at δH 7.31 (d, J = 8.7 Hz, H-7), 6.94 (dd, J = 8.4, 1.8 Hz, H-8), and 7.26 (d, J = 1.7 Hz, H-10) in 2, were replaced by signals at δH 7.32 (d, J = 2 Hz; H-7), 7.22 (d, J = 8.6 Hz; H-10), and 7.00 (dd, J = 8.6, 2.6 Hz; H-9) in 3. The 13C-NMR spectrum (see experimental) displayed also signals for the bicyclo[2.2.2]diazaoctane ring system including the lactam functionality and for a monohalogenated indole moiety. Altogether, this information suggested that 3 was the C-9 monochlorinated isomer of malbrancheamide B (2).
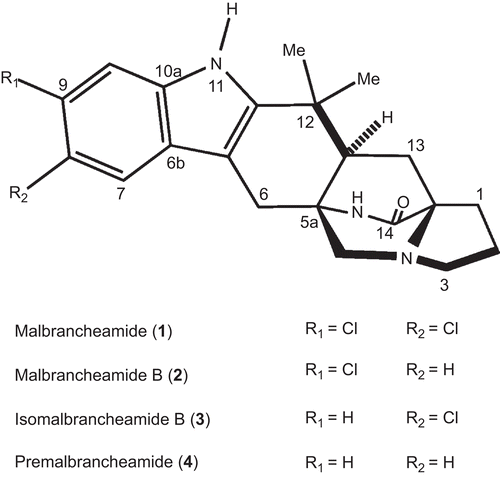
Next, in order to determine if compounds 1–4 are classical or functional CaM inhibitors, additional experiments involving quenching of the fluorescence and CD were performed. In the first case, fluorescence titration curves for CaM with alkaloids 1–4 were constructed using a fluorescent-engineered hCaM (hCaM-M124C-mBBr) biosensor, according to the protocol previously described by González-Andrade et al.Citation15. For this, Ca2+-CaM was titrated with different amounts of compounds 1–4 and the fluorescence changes were monitored in the range between 400 and 550 nm, being the maximum response at 470 nm. As shown in , the fluorescence intensity of the protein changed with increasing concentrations of compounds 1−3, however, no significant effect was observed with 4. Thus, alkaloid 1 displayed the highest affinity while 4 the least. The spectral changes produced by 1−3 were attributed to the formation of CaM-ligand complexes; the calculated Kd values were 1.11 ± 0.08, 4.82 ± 0.30, and 4.82 ± 0.09 μM, respectively, against the 1.43 ± 0.09 μM value observed for CPZ. The stoichiometry for the three alkaloids was 1:2, while for CPZ was 1:1 (). These results are in agreement with the enzymatic experiments carried out with Ca2+-CaM-PDE1 complexCitation16, since compound 1 showed a concentration-dependent inhibitory activity of the Ca2+-CaM-PDE1 complex (IC50 19.33 ± 1.40), whereas 2–4 displayed marginal effect (IC50 183.28 ± 37.58, 41.56 ± 4.64, and 35.73 ± 3.01 μM, respectively). The effect of 1 was comparable with that of the CPZ (positive control; IC5016.78 ± 3.99 μM).
Table 1. Activity and binding properties of malbrancheamides analogues on the Ca2+-CaM complex.
Figure 2. Fluorescence spectra and titration curves of Ca2+-hCaM-M124C-mBBr in the presence of 1 (A), 2 (B), 3 (C), and 4 (D). Buffer was 100 mM of potassium acetate (pH 5.1) at 37°C and 1 mM CaCl2. Samples were excited at 381 nm, and emission spectra recorded for light scattering effects from 400 to 550 nm. The absolute changes of maximal fluorescence emission were plotted against the ration alkaloids/protein total and fitted to the binding equation model to obtain the Kd and stoichiometric ration.
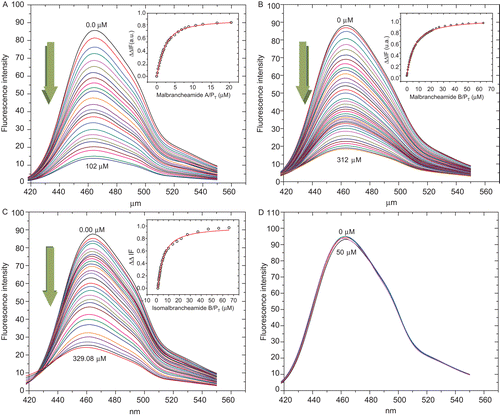
Concerning the CD experiments, the folding stability of CaM in the presence of 1–4 was assessed measuring their far-UV CD spectra (). According to previous analyses, the complex Ca2+-CaM possesses a high content of α-helix (84.2%)Citation22,Citation23; after addition of saturating concentrations of CPZ, the α-helice content decreased almost by 23% (61.3% of α-helix), bringing out significant changes in the secondary structure of Ca2+-CaM. The same trend of effects was observed after saturating the protein with 1 (68.1% of α-helix). Compounds 2 and 3 (75.45 and 78.33% of α-helix, respectively) were less effective, and 4 did not induce any change (84.2% of α-helix).
Figure 3. Far-UV circular dichroism of hCaM M124C-mBBr. in presence of 1 mM CaCl2. Buffer (−); Ca2+-hCaM M124C-mBBr (––); Ca2+-hCaM M124C-mBBr−1 (...); and Ca2+-hCaM M124C-mBBr−4 (–.–). The estimation of secondary structures from circular dichroism spectral in presence of all ligands was determined using K2D2 program.
Altogether, these results revealed that 1−3 behave as classical CaM inhibitors while 4 as functional inhibitorCitation24. The latter compound did not quench the extrinsic fluorescence of the CaM biosensor nor modify the secondary structure of CaM according to the CD analysis.
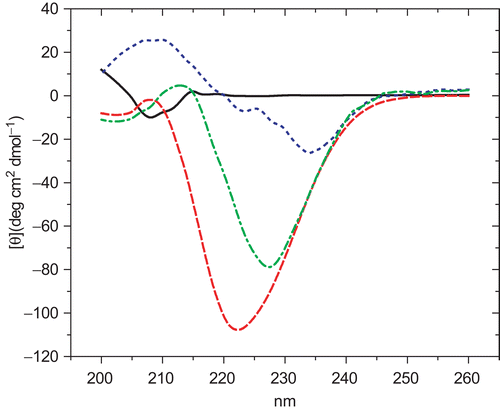
On the basis of the fluorescence and CD studies, compound 1 was selected to assess its binding mode to CaM. For this purpose the changes in the 1H-13C HSQC spectra upon addition of unlabelled 1 to uniformly 15N-13C-labelled CaM were analyzed. Compound 1 was titrated up to four equivalents of Ca2+-CaM. Most of the HSQC peaks of CaM were gradually shifted with little changes in their intensities ().
Figure 4. Schematic 1H-13C nuclear magnetic resonance spectra of the methyl groups of the methionine residues in (•) Ca2+-CaM and (○) Ca2+-CaM-1 complex. Chemical shift differences of methionines at the C-terminal (Met109, Met124, Met144, Met145) and N-terminal (Met36, Met51, Met71, Met72) domains of CaM, as well as the Met76 of the flexible linker region, are indicated with solid arrows.
The resonances of Ca2+-CaM affected by 1 were situated in the methionine methyl region, suggesting that 1 binds to the hydrophobic pockets of the protein rich in methionines, and localized at the interdomain sites of CaM, regarded as T2 and T3Citation24,Citation25. All the chemical shifts changes for the methionines residues 36, 51, 71, 72, 76, 109, 124, 144, and 145 were recorded and summarized in .
Table 2. NMR and flexible docking results of the Ca2+-CaM−1 complex formation.
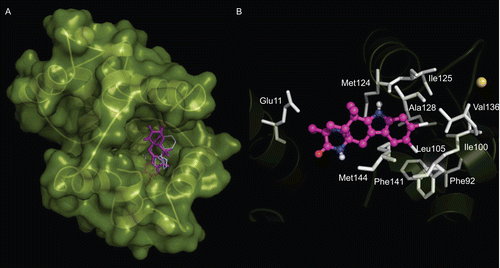
Next, in order to predict the location where compound 1 binds to CaM, ligand-receptor docking analyses into the preferred CaM-binding pocket of TFP were performed using AutoDock 4.0, and the reported X-ray structure of the TFP-CaM complex (PDB code: 1A29) as template. The lowest free energy of binding (EFEB) of the complex 1−CaM was −9.04 kcal/mol, and the calculated inhibition constant (Ki) was 0.23 μM. These values are in agreement with the parameters of binding and activity obtained by steady-state fluorescence and enzymatic tests ( 3). The refined flexible docking analysis revealed that the binding of 1 to CaM involved several hydrophobic interactions with the residues Glu11, Phe92, Ile100, Leu105, Met124, Ile125, Ala128, Val136, Phe141, and Met144, located at T2 and T3 hydrophobic pockets (). These residues are involved in the binding of most drugs with CaM and are located between the globular domainsCitation25, being their aromatic ring inside the hydrophobic area and their aliphatic side chains projecting towards the outside, so that the positive charge is in the acid patches.
Table 3. Binding free energy (EFEB) and inhibition constant (Ki) values of compounds 1–4, obtained from the molecular docking analyses (AutoDock 4.0).
Figure 5. Flexible docking model of the complex Ca2+-CaM−1. CaM is represented in green surface, 1 is depicted in purple sticks, and CPZ is shown in white lines. (A) Lowest energy AutoDock conformation of 1; (B) Residues of CaM (white sticks; Glu11, Phe92, Ile100, Leu105, Met124, Ile125, Ala128, Val136, Phe141, and Met144) involved in the complex formation. Ca2+ ions are showed in yellow balls.
Conclusions
Steady-state fluorescence and CD experiments, along with the enzymatic assay using CaM sensitive PDE1, revealed that all the alkaloids but 4 bind to Ca2+-CaM. Thus, compounds 1−3 are classical inhibitors, while compound 4 behaves as functional inhibitor. According to the NMR and docking analyses compound 1 binds to the same hydrophobic pocket than CPZ, W-7, J-8, and TFP. Furthermore, the docking study also indicated that the binding of 1 with the protein involved hydrophobic and electrostatic interactions. These observations are consistent with the highest affinity of compound 1 to CaM in comparison to that of 2 and 3, with one halogen in their structures, or 4, with no halogen in its molecule, and with not affinity at all for the protein. Finally, the anti-CaM properties exhibited by compound 1 are comparable to those of classical CaM inhibitors, and make this product a lead for the development of new drugs and a valuable tool for the study of the physiological role of CaM.
Supplementary Material
Download PDF (150.6 KB)Acknowledgements
The technical assistance of Georgina Duarte-Lisci, Margarita Guzmán-Villanueva, Marisela Gutiérrez, Isabel Rivero-Cruz and Isabel Velázquez-López is also recognized. The authors are very grateful to Dr. A. Olson and his colleagues at the Scripps Research Institute for providing AutoDock. The authors are indebted to Dirección General de Servicios de Cómputo Académico (DGSCA, UNAM), for providing the resources to carry out computational calculations through KanBalam System.
Declaration of interest
This work was supported by Consejo Nacional de Ciencia y Tecnología (CONACyT, grant 99395).
References
- Kuboniwa H, Tjandra N, Grzesiek S, Ren H, Klee CB, Bax A. Solution structure of calcium-free calmodulin. Nat Struct Biol 1995; 2:768–776.
- Chattopadhyaya R, Meador WE, Means AR, Quiocho FA. Calmodulin structure refined at 1.7 Å resolution. J Mol Biol 1992; 228:1177–1192.
- Gsponer J, Christodoulou J, Cavalli A, Bui JM, Richter B, Dobson CM, Vendruscolo M. A coupled equilibrium shift mechanism in calmodulin-mediated signal transduction. Structure 2008; 16:736–746.
- Cheung WY. Calmodulin plays a pivotal role in cellular regulation. Science 1980; 207:19–27.
- Schwaller B.. Calcium-binding Proteins. In: Schwaller B, ed. Encyclopedia of Life Sciences. Chichester: John Wiley and Sons; 2005;1–8.
- Klee CB, Crouch TH, Richman PG. Calmodulin. Annu Rev Biochem 1980; 49:489–515.
- Karwatowska-Krynska E, Beresewicz A. Trifluoperazine protection of hypoxic myocardium. Pol J Pharmacol Pharm 1985; 37:615–627.
- Porumb T, Yau P, Harvey TS, Ikura M. A calmodulin-target peptide hybrid molecule with unique calcium-binding properties. Protein Eng 1994; 7:109–115.
- Douglass PM, Salins LL, Dikici E, Daunert S. Class-selective drug detection: fluorescently-labeled calmodulin as the biorecognition element for phenothiazines and tricyclic antidepressants. Bioconjug Chem 2002; 13:1186–1192.
- Hennessey TM, Kung C. An anticalmodulin drug, W-7, inhibits the voltage-dependent calcium current in Paramecium caudatum. J Exp Biol 1984; 110:169–181.
- Craven CJ, Whitehead B, Jones SK, Thulin E, Blackburn GM, Waltho JP. Complexes formed between calmodulin and the antagonists J-8 and TFP in solution. Biochemistry 1996;35:10287–10299.
- Martínez-Luis S, Rodríguez R, Acevedo L, González M, Lira-Rocha A, Mata R. Malbrancheamide, a new calmodulin inhibitor from the fungus Malbranchea aurantiaca. Tetrahedron 2006;62:1817–1822.
- Figueroa M, Gonzalez M, Mata R. Malbrancheamide B, a novel compound from the fungus Malbranchea aurantiaca. Nat Prod Res 2008; 22:709–714.
- Miller KA, Figueroa M, Valente MW, Greshock TJ, Mata R, Williams RM. Calmodulin inhibitory activity of the malbrancheamides and various analogs. Bioorg Med Chem Lett 2008; 18:6479–6481.
- González-Andrade M, Figueroa M, Rodríguez-Sotres R, Mata R, Sosa-Peinado A. An alternative assay to discover potential calmodulin inhibitors using a human fluorophore-labeled CaM protein. Anal Biochem 2009; 387:64–70.
- Rivero-Cruz B, Rivero-Cruz I, Rodríguez-Sotres R, Mata R. Effect of natural and synthetic benzyl benzoates on calmodulin. Phytochemistry 2007; 68:1147–1155.
- Pérez-Iratxeta C, Andrade-Navarro MA. K2D2: estimation of protein secondary structure from circular dichroism spectra. BMC Struct Biol 2008; 8:25.
- Morris GM, Goodsell DS, Halliday RS, Huey R, Hart WE, Belew RK. Automated docking using a lamarckian genetic algorithm and empirical binding free energy function. J Comp Chem 1998;19:1639–1662.
- Huey R, Morris GM, Olson AJ, Goodsell DS. A semiempirical free energy force field with charge-based desolvation. J Comput Chem 2007; 28:1145–1152.
- Martínez-Luis S, Pérez-Vásquez A, Mata R. Natural products with calmodulin inhibitor properties. Phytochemistry 2007; 68:1882–1903.
- Ding Y, Greshock TJ, Miller KA, Sherman DH, Williams RM. Premalbrancheamide: synthesis, isotopic labeling, biosynthetic incorporation, and detection in cultures of Malbranchea aurantiaca. Org Lett 2008; 10:4863–4866.
- Mathur S, Badertscher M, Scott M, Zenobi R. Critical evaluation of mass spectrometric measurement of dissociation constants: accuracy and cross-validation against surface plasmon resonance and circular dichroism for the calmodulin-melittin system. Phys Chem Chem Phys 2007; 9:6187–6198.
- Settimo L, Donnini S, Juffer AH, Woody RW, Marin O. Conformational changes upon calcium binding and phosphorylation in a synthetic fragment of calmodulin. Biopolymers 2007; 88:373–385.
- Harmat V, Böcskei Z, Náray-Szabó G, Bata I, Csutor AS, Hermecz I, Arányi P, Szabó B, Liliom K, Vértessy BG, Ovádi J. A new potent calmodulin antagonist with arylalkylamine structure: crystallographic, spectroscopic and functional studies. J Mol Biol 2000; 297:747–755.
- Vandonselaar M, Hickie RA, Quail JW, Delbaere LT. Trifluoperazine-induced conformational change in Ca(2+)-calmodulin. Nat Struct Biol 1994; 1:795–801.