
Abstract
To develop naphthyridine derivatives as anticancer candidates, pharmacokinetic (PK) evaluations of 10 novel derivatives of 1,4-dihydro-4-oxo-1-proparagyl-1,8-naphthyridine-3-carboxamide, with potent anticancer activity were done using in vitro ADME (absorption, distribution, metabolism, excretion) and pharmacokinetic--pharmcodynamic (PK/PD) assays. Only derivatives 5, 6, 9 and 10 showed better metabolic stability, solubility, permeability, partition coefficient and cytochrome P450 (CYP) inhibition values. PK of derivatives 5, 6, 9 and 10 in rat showed comparable PK profile for derivative 5 (C0 = 6.98 µg/mL) and 6 (C0 = 6.61 µg/mL) with no detectable plasma levels for derivatives 9 and 10 at 5.0 mg/kg i.v. dose. PK/PD assay of derivatives 5 and 6 in tumor-bearing mice (TBM) showed comparable PK but tumor plasma index (TPI) of derivative 6 (4.02) was better than derivative 5 (2.50), suggesting better tumor uptake of derivative 6. Derivative 6, as lead compound, showed highest tumor growth inhibition (TGI) value of 33.6% in human ovary cancer xenograft model.
Introduction
One of the major objectives of any anticancer research program is the preclinical development of bioactive molecules and their derivates as chemotherapeutic agent. Amongst target-specific small organic molecules, Quinazoline-related chemical classes such as Naphthyridines are being investigated for their potential in cancer chemotherapy. SNS-595, a derivative of 1, 8-naphthyridine is in Phase 2 clinical trial and acts as a cell cycle modulatorCitation1–4. There is evidence that antitumor activity of naphthyridine is due to the intercalation between the base pairs of DNA and interference with normal functioning of the enzyme topoisomerase II, which is involved in the breaking and releasing of DNA strandsCitation5. As a result of potential antitumor activity, many novel derivatives of 1,8-naphthyridine have been synthesized and evaluated in preclinical studiesCitation6–8. In an effort to utilize the potential of this class of compounds, we have synthesized and investigated several novel derivatives in preclinical studies. We have previously demonstrated the synthesis of novel 1, 8-naphthyridine derivatives modified at C-3 position. Several of these novel derivatives exhibited anticancer activity on a range of cancer cells using in vitro cytotoxicity assayCitation9–11.
C-3 carboxamide derivatives of 1,8-naphthyridine with a spacer showed good anticancer potential against different cancer typesCitation9. The derivatives were further synthesized based on structure activity relationship (SAR), by modifying the C-3 carboxamide acid with different amino acid derivatives and with cycloalkyl, aryl, hetroaryl and tertiary amine derivatives with and without substitution at C-6 and C-7 positionsCitation11. These derivatives not only exhibited broad spectrum cytotoxicity, but were also found to be specific to tumor cells as compared to normal cells.
To develop these potential drug candidates, an essential step is the evaluation of pharmacokinetic properties as it is now well recognized that one of the important reasons for high attrition in drug development process is due to poor PK properties of the moleculesCitation12,Citation13. In the past, various in vitro ADME parameters were used alone and in combination for screening the compounds during initial discovery stageCitation14–16. Although these PK evaluations definitely improved the screening process, the translation of the in vitro ADME data to in vivo conditions is sometimes not straight forward. Further, in case of anticancer research, lack of PK/PD data from the tumor creates a gap, which limits the preclinical ADME data to accurately predict the in vivo efficacy further in the development process. With significant information in the area of PK and pharmacodynamics (PD), model-based drug development and PK/PD-based approaches is getting more focus in the area of drug discoveryCitation17. There is limited literature where the PK/PD properties, depending upon the disease area were used for screening the compounds. Recently, the PK/PD-based approach was used for selection of anticancer candidate for brain tumor chemotherapyCitation18 and CNS tumor therapyCitation19.
In our present effort, we have investigated the PK behavior of novel and potent naphthyridine derivatives by evaluating the in vitro PK, in vivo PK and PD properties of the selected derivatives in tumor. The understanding of such PK/PD properties in tumors is expected to lead to more accurate prediction for the naphthyridine derivative/s having favorable PK properties. In vitro ADME results were also used to study the structural modification, which provides vital information for further synthesis of the derivatives with better PK properties. We investigated 10 novel 1, 8-naphthyridine derivatives, obtained from our previous studyCitation10,Citation11, having single to broad spectrum anticancer properties (). The derivatives 1, 2, 3, 4 (Structure shown in ) in this study are the compounds 20, 22, 19 and 34 of our previous studyCitation10 and derivatives 5, 6, 7, 8, 9 and 10 (Structure shown in ) represents compounds 25, 29, 36, 47, 49, 53 of our another studyCitation11. These derivatives were selected based on the superior cytotoxicity and specificity to human cancer cells (). The derivatives were evaluated for the PK properties, that is, solubility, permeability, metabolic stability, plasma stability, protein binding, partition coefficient and CYP inhibition studies using in vitro assays. The shortlisted derivatives were evaluated for in vivo PK behavior and tumor uptake properties. In vivo PK/PD data was used to select the best derivative/s possessing favorable PK and tumor uptake properties. In vivo PK/PD data and in vitro cytotoxicity data was subsequently employed to determine the chemotherapy class under which the selected derivative/s can be tested for in vivo studies.
Table 1. In vitro cytotoxicity of naphthyridine derivatives*.
Finally, a preliminary efficacy study in xenograft model was performed to validate our findings and generate a preclinical proof of concept.
Materials and methods
Chemicals and materials
All the 10 naphthyridine derivatives () were synthesized at the Division of Medicinal Chemistry of Dabur Research Foundation (Sahibabad, India). The chromatographic purity of all the derivatives was above 95.0%. Derivatives 5 and 6 which were used in tumor uptake study and xenograft study had chromatographic purity more than 98.0%. HPLC-grade acetonitrile and methanol were purchased from J.T. Baker INC (Phillipsburg, NJ). Lecithin, carboxy methyl cellulose (CMC), dimethyl sulfoxide (DMSO), Rhodamine 123, nonessential amino acids were purchased from Sigma Chemical Co. (St. Louis, MO). Dulbecco’s modified eagle’s medium (DMEM) was from Caisson Labs (North Logan, UT), fetal bovine serum (FBS) from Cansera (Rexdale, ON, Canada). Octanol and tert-butyl methyl ether (TBME) were purchased from Spectrochem Pvt. Limited (Mumbai, India). The potassium dihydrogen phosphate used was of HPLC grade from Sigma (St. Louis, MO). All other chemicals used in the preparation of samples were of reagent grade or better (Sigma, St. Louis, MO) unless otherwise specified. The inhibitor screening kits, CYP1A2/CEC HTP inhibitor screening kit (Cat. No.459500), CYP2C19/CEC HTP inhibitor screening kit (Cat. No. 459400), CYP2C9/MFC HTP inhibitor screening kit (Cat. No. 459300), CYP2D6/AMMC HTP inhibitor screening kit (Cat. No. 459200), CYP3A4/BFC HTP inhibitor screening kit (Cat. No. 459100) were purchased from BD Gentest (Woburn, MA). Each of the screening kits contains buffers, cofactors, enzyme, substrate and positive control inhibitor. Pooled human liver microsomes (Cat. No.452161) and NADPH regenerating system (SOLUTION-A™, Cat. No.451220; SOLUTION-B™, Cat. No.451200) were purchased from BD Gentest (Woburn, MA). The pooled liver comprised of 22 human specimens with a protein content of 10 mg/mL. Microsomes were stored at −70 °C. The Caco-2 cells (HTB-37) origination from a human colorectal carcinoma was obtained from the American Type Culture collection (Rockville, MD) at passage no. 17. PA1 and DU145 human cells were provided by cell line depositary of Dabur Research Foundation (Sahibabad, India). Water used was MILLI Q™ grade (Milli Q System, Waters). Calibrated single and multi-channel pipettes were used for dispensing (Pipettman, Gilson, France).
Analytical methodology
Chromatographic purity of the derivatives was determined using high performance liquid chromatography (HPLC) method. HPLC analysis was carried out on Shimadzu LC2010CHT series HPLC (Kyoto, Japan) with PDA detector. Chromatographic separation was done on an analytical column (YMC ODS-A, 250 mm × 4.6 mm I.D, 5 µm particle size, YMC, Japan) using gradient method. Area normalization method was used to determine the chromatographic purity. Peak purity estimation was also done to ensure the complete specificity of the method.
Samples of solubility and permeability assays were analyzed by UV/Vis absorption method using microplate spectrometer (VARIOSKAN™, Thermo Electron Corp., Waltham, MA). Samples of CYP inhibition assay were analyzed using spectrometer (VARIOSKAN™, Thermo Electron Corp., Waltham, MA) in fluorescence analysis mode. All samples from the plasma stability assay, plasma protein binding assay, metabolic stability assay, Caco-2 permeability, partition coefficient, PK study and tumor uptake study were analyzed using HPLC method. HPLC analysis was carried out on Shimadzu LC2010CHT series HPLC (Kyoto, Japan) with UV detector. An analytical column (YMC ODS-A, 250 mm × 4.6 mm I.D, 5 µm particle size, YMC, Japan) was used to carry out the chromatographic separations. Samples of plasma stability, plasma protein binding, metabolic stability, Caco-2 permeability, PK study (Rat), PK study (TBM) and tumor uptake study of all derivatives, except the derivative 5, was analyzed using a binary mobile phase consisting of 50 mmol/L KH2PO4 (solvent A) and acetonitrile (solvent B). The flow rate was 1.0 mL/min with following gradient: solvent A/solvent B 80:20 for 5 min, changed from 80:20 to 0:100 from 5 to 25 min, held at 0:100 from 25 to 35 min, changed from 0:100 to 80:20 from 35 to 40 min; the column was further allowed to equilibrate at 80:20 from 40 to 50 min before the next injection. Poor specificity of derivative 5 in the above method led to develop an alternate method for derivative 5. The plasma samples of derivative 5 were analyzed using the gradient solvent A/solvent B 80:20 for 5 min, changed from 80:20 to 0:100 from 5 to 10 min, held at 0:100 from 10 to 28 min, changed from 0:100 to 80:20 from 28 to 33 min 80:20 from 33 to 40 min before the next injection. The detector wavelength for all the assays was set at 220 nm. The chromatographic methods were checked for specificity, intraday and inter day variability and sensitivity in all matrices (buffer, plasma and tumor homogenate). The analytical parameters of each individual chromatographic assay are summarized in .
Table 2. Summary of analytical parameters of chromatographic methods used for sample analysis of various in vitro and in vivo ADME assays.
Solubility assay
The aqueous solubility was determined using a DMSO precipitation method. Briefly, the test compound was dissolved in DMSO at a concentration of 10 mmol/L. 10 µL of stock compound was dispensed directly into 190 µL of 0.1 mol/L phosphate buffer (pH 7.4) to obtain 500 µM and mixed with gentle shaking (100–300 rpm, orbital shaker) at room temperature for 1.5 h and filtered using a syringe filter (0.45 µM, MILLEX™, Millipore, Billerica, MA). After filtration, 160 µL/well of filtrate was transferred to a UV STAR™ 96-well plate, scanned in a microplate spectrometer (VARIOSKAN™, Thermo Electron Corp., Waltham, MA) from 250–500 nm and read along with a standard curve to determine the soluble concentration of each test compound. The two derivatives 4 and 8 were also evaluated for equilibrium solubility using traditional shake flask methodCitation20. The solubility data obtained for the derivatives were rank ordered.
Permeability assay
Permeability was determined using the Parallel artificial membrane permeability assay (PAMPA) as described previouslyCitation21. Briefly, 1% w/v lecithin in dodecane was prepared by sonication and 5 µL of the lecithin/dodecane solution was pipetted into each donor plate well of a drug filtration plate (ELISPOT IP™, Cat. No. ELIIP10SSP, Millipore, Billerica, MA), avoiding pipette tip contact with the membrane. Immediately after the application of lecithin (within 10 minutes maximum), 150 µL of test compound dissolved in phosphate-buffered saline (PBS) containing 5% DMSO was pipetted to each well of the donor plate. 300 µL of buffer containing 5% DMSO was pipetted to each well of the acceptor plate (MSACCEPTOR™, Millipore, Billerica, MA). The donor plate was placed gently into the acceptor plate, making sure the underside of the membrane is in contact with the buffer in all wells. Plate lid was replaced and incubated at room temperature in a sealed container for 16 h. After incubation, UV/Vis absorption was measured from 250 to 500 nm for 100 µL/well of the donor solution and 250 µL/well of the acceptor solution. Solutions at the theoretical equilibrium concentration (i.e. the resulting concentration if the donor and acceptor solutions were simply combined) were prepared and measured by UV/Vis absorption (VARIOSKAN™, Thermo Electron Corp., Waltham, MA) from 250 to 500 nm for 250 µL/well of each. Permeability value was calculated as mean of 6 samples/well using formula given belowCitation22:
Like solubility, the permeability data was also rank ordered.
Plasma stability assay
Stability of the derivatives was evaluated in human and rat plasma by incubation of the test compound with plasma at 37 °C for 8 h. Test compound was dissolved in DMSO at a concentration of 5 mM. 20 µL of stock compound was dispensed into 980 µL of diluent (methanol:water, 80:20) to obtain working solution of 100 µM. 40 µL of working solution was incubated with 360 µL of plasma at 37 °C for 8 h. Samples were analyzed using Gradient HPLC method () after extracting the plasma samples with TBME. All the derivatives which show plasma stability more than 50% were deemed acceptable in the present work.
Plasma stability was expressed as percentage of the initial amount of the test compound as shown below:
Where,
t1 is area of test compound peak at 8 h
t0 is area of test compound at 0 min
Metabolic stability assay
Metabolic stability of the derivatives was determined by adapting a previously published methodCitation23 by calculating the amount of the compound remaining un-metabolized following incubation with pooled human liver microsomes. Briefly, DMSO stock solutions of test compound were prepared at a concentration of 5 mM and further diluted with 0.1 M phosphate buffer, pH 7.4, to the required concentration. The test compound at a concentration of 10 µM was incubated with the microsomes (0.5–1 mg/mL) in the presence of cofactors (SOLUTION-B™, BD Gentest, Woburn, MA) at 37 °C in a water bath with shaking (JULABO™, Julabo Labortechnik GMBH, Germany). Solvent concentration was <1% in the incubation mixture. Samples were withdrawn at 0 min and 60 min and terminated by the addition of equal volume of cold acetonitrile. Incubates were centrifuged at 10 000 rpm for 10 min in a refrigerated centrifuge (BIOFUGE FRESCO™, Heraeus, Germany) and supernatant analyzed by HPLC (). Stability was assessed by the disappearance of test compound peak based on the change in test compound area. Metabolic stability was defined as the amount of test compound metabolized by the incubation with human liver microsomes and expressed as a percentage of the initial amount of the test compound (0 min). Diclofenac was used as control in the experiment. All the derivatives which showed metabolic stability more than 50% were deemed acceptable in this work.
Partition coefficient determination
The octanol/water partition coefficient was used to measure the lipophilicity or partition coefficient (log P). The log P value is the ratio of the concentrations of neutral substances in two immiscible phases, water and octanol. The partition coefficient (log P) of the derivatives was determined using shake flask method. 10 mM stock solution of each derivative was prepared. 75 µL of solution was added to a system of two essentially immiscible liquids consisting of an aqueous phase (water saturated with octanol) and an organic phase (octanol saturated with water) to obtain a concentration of 500 µM. Once the derivative was fully equilibrated with the two solvents, the concentration of the derivative in both the solvent was determined using gradient HPLC method () and partition coefficient was calculated.
Partition coefficient was expressed as log of amount of test item in the organic phase by the amount of derivative present in aqueous phase. Log P was calculated as shown below:
Where,
BP = before partition solution
AP = after partition solution
Plasma protein-binding assay
Plasma protein binding was determined in human plasma using ultra filtration method. Test solutions were prepared by adding an aliquot of 5 µL of test compound (1 mmol/L in DMSO) to 495 µL of plasma, affording a final concentration of 10 µM. The test solution was mixed well and incubated for 1 h at 37 °C. After incubation the test solution was loaded onto 1.5 mL centrifugal filter device with 30 KD cut-off (MICROCON ULTRACEL YM-30™, Cat. No. 42410, Millipore, Billerica, MA) and centrifuged for 45 min at 2000 × g at 37 °C (BIOFUGE FRESCO™, Heraeus, Germany). The filter was removed and the sample ultrafiltrate was recovered from the receiver tube. Desired volume was pipetted from the receiver tube for analysis. The amount of the test compound in the ultrafiltrate and retentate was measured by HPLC () using standard curves. The percentage protein binding was calculated using the formula:
Cytochrome P450 inhibition assay
Derivatives were screened for their ability to inhibit CYP1A2, 3A4, 2C9, 2C19 and 2D6 marker substrates using an in vitro fluorometric microtiter plate assay described previouslyCitation24. Briefly, derivatives were dissolved in acetonitrile to obtain a stock of 500 µM. The test compound was prepared at 50 times the highest final concentration desired in the IC50 assay. (Highest final concentration = 10 µM). Six microliter of the test compound stock solution was added in 144 µL of NADPH–cofactor mixture. The mixture was further serial diluted by mixing 50 µL of the mixture in 100 µL of NADPH cofactor to obtain eight serially diluted samples of concentration of 10 µM, 3.33, 1.11, 0.37, 0.123, 0.041, 0.014 and 0.0046 µM. Samples were preincubated at 37 °C in a shaker water bath (JULABO™, Julabo Labortechnik GMBH, Germany) for 10 min. The reaction was initiated by adding 100 µL of enzyme–substrate mixture in each sample. The reaction mixture was further incubated at 37 °C in a shaker water bath (JULABO™, Julabo Labortechnik GMBH, Germany) for 30 min. The reaction was terminated at the specified time point by adding 75 µL of stop reagent (0.5 mol/L Tris Base). The sample was scanned with a multi well spectrophotometer (VARIOSKAN™, Thermo Electron Corp., Waltham, MA) at the recommended excitation/emission filters. IC50 values were calculated from the net fluorescent signal obtained for the different substrate samples. Furafylline, sulphafenazole, qunidine, ketoconazole and tranylcypromine were used as inhibitor controls for the enzymes CYP1A2, CYP2C9, CYP2D6, CYP3A4 and CYP2C19, respectively.
Permeability study using Caco-2 cells
Permeability of compound 6 was studied using Caco-2 cells. Cell culture and bidirectional transport study were done as per previously published methodCitation25. Briefly, for the study, cells were seeded in 6-well plates at a density of 3.0 × 10⁵ cells/insert, in polycarbonate tissue culture inserts (Nalge Nunc Int., NY) having 25 mm I.D and 3.0. The culture medium was replaced every three days for first seven days and every two days thereafter. Cells were used for transport experiments at passages 22–28 at 21–25 days after seeding. Integrity of confluent Caco-2 cell monolayer was determined by measuring the transepithelial electrical resistance (TEER, Ω cm2) using an epithelial Volt-Ohm Meter (Millicell-ERS, Millipore Corporation, Billerica, MA). After subtraction of the background TEER (i.e. the resistance exhibited by the filter alone) only Caco-2 cell monolayers that exhibited a TEER > 400 Ω cm2 throughout the experiments were used (measured prior to and at the end of the experiment). Rohdamine-123 was used as probe substrate for ensuring P-gp expression in Caco-2 cellsCitation26.
On the day of experiment, before performing the transport experiments, the cell monolayer were washed twice with phosphate buffer saline pH 7.4 to remove traces of culture media. After washing, the plates were incubated at 37 °C for 30 min. For the measurement of apical to basolateral transport (A-B), 1.5 mL transport buffer containing drug solution (10 µM) was added to the apical side and 2.6 mL of blank transport medium to basolateral compartment. For the investigation of basolateral-to-apical transport (B-A), drug was placed into basolateral side and blank media on the other side. Samples of 200 µL were withdrawn from the acceptor compartment till 90 min. Before conduction the experiment with test item, the P-gp expression in cell monolayer was ascertained by carrying out bidirectional studies using rhodamine at 1 µM concentration. For the inhibition experiment, verapamil solution of 100 µM was added to the transport buffer in both apical and basolateral sides. Blank media was used for the control inserts. Experiment was performed in shake incubator at 37 °C and 50–60 rpm. The collected samples were analyzed by HPLC with UV detection. All the experiments were conducted in triplicates.
The apparent permeability, Papp (cm/s) was calculated as:
where dQ/dt is the transport rate of the compound (nmol/s),
A is the area of the cell monolayer (cm2) and Co is the initial donor concentration in nmol.
Animal studies
All animal experiments were carried out as per guidelines of Committee for the Purpose of Control & Supervision of Experiments on Animals (CPCSEA), Govt. of India. Individual protocols were approved by Institutional Animal Ethics Committee (IAEC), Dabur Research Foundation.
PK in rat
Selected derivatives, 5, 6, 9 and 10 from the in vitro ADME studies were studied for their in vivo PK behavior following intravenous administration. Derivative 6 was also studied for oral PK.
Male Wistar rats, age 6–10 weeks, weighing between 150 and 180 g were used for the study. A cosolvent formulation of each of the derivatives 5, 6, 9 and 10 was prepared separately and diluted in water for injection to a final concentration of 1.0 mg/mL. For oral administration, derivative 6 was suspended in 0.5% CMC at a concentration of 2.0 mg/mL.
For intravenous study, rats were administered with a single intravenous dose of 5.0 mg/kg of derivatives 5, 6, 9 and 10 in the peripheral tail vein. For oral dosing, rats were fed with 10 mg/kg of derivative 6 using an appropriate gavage needle. Doses were selected based on maximum tolerated dose (MTD) of the derivatives, established in rat, following 14 day i.v. administration. Derivatives 5 and 6 showed MTD of 15.0 mg/kg while the derivatives 9 and 10 showed the MTD of 20 mg/kg. For comparison purpose, all the four derivatives were dosed at same dose of 5.0 mg/kg in current experiment. After dosing, blood samples (250 µL) were collected by orbital bleeding under mild ether anesthesia in EDTA-containing tubes at 0, 3, 10, 30 min and 1, 2, 4, 6, 8, 24 h (intravenous dosing) and 0, 10, 30 min and 1, 1.5, 2, 3, 4, 6, 8, 24 h (per oral dosing). The study was conducted using staggered sampling approach where no more than three samples were taken from the each rat to avoid excessive blood loss from the rats. The blood samples were immediately centrifuged, plasma collected and extracted in ethyl acetate: methanol (75:25) and analyzed by HPLC (Shimadzu LC2010CHT, Japan) using the gradient method. The concentration of derivatives in plasma was calculated using the ratio of their peak to the internal standard (a closely related derivative of each compound) peak and then comparing the ratio to a simultaneously performed standard curve. The limit of quantitation (LOQ) of the method for each derivative was 0.1 µg/mL (50 µL injection).
PK and tumor uptake study in tumor-bearing mouse
The derivatives 5 and 6 which showed acceptable PK in rat were studied for PK and tumor uptake in prostate xenograft and ovarian xenograft model, respectively. These xenograft models were selected because the derivatives 5 and 6 had shown superior in vitro cytotoxicity in DU145 and PA1 cell lines, respectively.
Athymic nude mice, age 6–8 weeks, weighing between 15 and 20 g were maintained in sterile individually ventilated cages (IVC) at the small animal facility, Dabur Research Foundation. These animals were quarantined for one week prior to beginning the study. The animals were kept in an air conditioned laboratory (room temperature maintained between 22 °C and 26 °C) with 12 h light and dark cycle.
Total 48 mice were taken and divided in two groups of 24 mice. Human ovarian (PA1) tumor xenograft was established in athymic nude mice of group I by subcutaneous inoculation of a single cell suspension of PA1 cells (10 × 106 cells/200 µL containing BD MatrigelTM in ratio of 1:1). In group II animals, prostate xenograft was established by subcutaneous inoculation of a single cell suspension of DU145 cells (12 × 106 cells/200 µL containing BD MatrigelTM) harvested at exponential growth phase by trypsinization (0.25% trypsin and 0.02% EDTA) in flank area of the experimental animal using a 30 G sterile needle.
Treatment with test compounds was initiated in each group when approx. 100 mm3 tumor volume was attained. Animals of group I were administered a single intravenous dose of 5.0 mg/kg of derivative 6 and animals of group II were administered a single intravenous dose of 5.0 mg/kg of derivative 5 in the peripheral tail vein. Post dosing, blood and tumor samples were collected at 0.25, 0.5, 2, 4, 6 and 8 h upon sacrifice. Plasma and tumor homogenate (20% w/w tumor/water) were analyzed by HPLC () using the gradient method after extraction of tumor homogenate and plasma with ethyl acetate and methanol (75:25). The LOQ of the method for each compound was 0.1 µg/mL (50 µL injection) for both plasma and tumor homogenate.
Pharmacokinetic data analysis
The PK parameters were determined using WinNonlin v5.0.1 software (Pharsight Corporation, St. Louis, MO) for both PK study and tumor uptake study. Non-compartmental analysis (NCA Model 201 – IV-bolus input) was selected for PK modeling. The parameters that were evaluated for PK study includes initial plasma concentration at zero time (C0), half life (T1/2) and area under the drug concentration time curve in plasma (AUCp). The parameters which were evaluated for tumor uptake study includes initial tumor concentration at zero time (C0t), half-life (T1/2) and area under the drug concentration-time curve in tumor (AUCt). All AUC calculations were based on the area from time zero to time infinity. The derived parameter tumor plasma index (TPI) for the mouse PK study was calculated as the ratio of AUCt/AUCp. The TPI was used to indicate the comparative tumor uptake between the compounds.
Tumor xenograft assay
Human tumor xenograft assay was adapted from previously published methodsCitation27,Citation28. Athymic nude mice, age 6–8 weeks, weighing between 15 and 20 g were maintained in sterile IVC at the small animal facility, Dabur Research Foundation. These animals were quarantined for one week prior to beginning the study. Autoclaved standard food pellets (Golden feed, Delhi) and water (Aquaguard pure) through a sterile glass bottle fitted with a nozzle were available for 24 h. The animals were kept in an air-conditioned laboratory (room temperature maintained between 22 °C and 26 °C) with 12 h light and dark cycle.
Human ovarian (PA1) tumor xenograft was established in athymic nude mice by subcutaneous inoculation of a single cell suspension of PA1 cells (10 × 106 cells/200 µL containing BD MatrigelTM in ratio of 1:1), respectively. The tumor-bearing animals were randomized into two groups of eight animals each (1 treated, 1 control). Treatment with derivative 6 was initiated when approx. 100 mm3 tumor volume was attained. The derivatives were administered intravenously to the treatment group of tumor-bearing animals. The cosolvent formulation of derivative 6 containing 15% cosolvent and 85% dextrose solution (5% dextrose) was administered at a dose of 5 mg/kg once daily for a period of 14 days using sterile 1 mL disposable syringe and 30 G needle. Dose and treatment period was based on the MTD, established in the nontumor-bearing athymic nude mice, following 14 days i.v. administration. The MTD for derivative 6 was 15.0 mg/kg. Selection of nontumor-bearing athymic nude mice for MTD assay over TBM was done to address the ethical consideration in using large number of TBM for the assay and simultaneously not compromising much on the sensitivity of the strain. Control animals received equivalent volume of vehicle for the same period. All the animals were observed daily for 21 days for tumor reduction and body weight.
The comparative antitumor activity of derivative 6 was monitored by measuring tumor volumes weekly twice using digimatic caliper (Mitutoyo) and was calculated using the formula L × W2 × 0.5 (W = smaller diameter, L = larger diameter). Tumor regression (T/C) was calculated using the formula (1 - tumor volume(treated)/tumor volume(control)) × 100 and tumor growth inhibition (TGI) was calculated using the formula [(tumor volume(control) – tumor volume(treated))/(tumor volume(control)) × 100]. Animals were sacrificed humanely for ethical considerations on day 22.
Statistical analysis
In vitro data was expressed as mean ± SEM of at least three experiments. In vivo data was expressed as mean ± SD. For tumor data, multiple comparisons of LSMEANS with “Dunnett-Hsu” approximation was calculated using SAS 9.1.3 and Mann–Whitney U test was done. Differences were considered significant when p < 0.05.
Results
Aqueous solubility of naphthyridine derivatives
The solubility and permeability data of the tested derivatives indicated that except derivatives 5 and 6, other derivatives had very poor aqueous solubility and permeability. The aqueous solubility of the derivatives was in the range of 4.2 to 202.4 µM, in the presence of 0.05% DMSO (). It appeared that nonhalogen-substituted derivatives 5 and 6 had better solubility (>100 µM) as compared to others. The derivative 6 had shown highest aqueous solubility (202.36 µM) followed by 5 (148.75 µM) among all the derivatives while 3 showed the lowest solubility (4.2 µM). Solubility of rest of the derivatives was between the two extreme values. Solubility ranking of the shortlisted derivatives was 6 > 5 > 10 > 9 > 7 > 4 > 8 > 1 > 2 > 3.
Table 3. In vitro ADME properties and structure correlation of naphthyridine derivatives.
However, the solubility of derivatives 4 and 8, using the traditional shake-flask methodCitation20 was found to be very poor (<1.0 µM) as determined by HPLC. From these results, it was apparent that these derivatives had slightly poor equilibrium solubility as compared to kinetic solubility. Solubility of the derivatives seemed to have enhanced in the presence of amphoteric solvents like DMSO.
Permeability of naphthyridine derivatives
The PAMPA assay measures the passive transport of test compounds across a lipid layer that mimics the intestinal lipid bilayer. The log Pe value for these derivatives ranged from −4.90 to −6.08 (). The permeability of these derivatives across the lipid (lecithin) as a percentage of the total amount added to the donor compartment was in the range of 6.73% to 65.23%. This falls in the range of “moderate” to “poor” permeability as compared to data of known drugs. The effective permeability (log Pe) was calculated to be greater than −5.0. Based on permeability, the derivatives 5 and 6 showed moderate permeability while other derivatives showed poor permeability. Permeability ranking of the shortlisted derivatives was 6 > 5 > 9 > 10 > 8 > 2 > 4 > 1 > 3 > 7.
Plasma stability of naphthyridine derivatives
Stability of the selected derivatives was evaluated in both human and rat plasma by incubating the derivatives with plasma at 37 °C for 8 h. None of the derivatives had shown any instability in plasma. Percentage amount of these derivatives from its initial value was found to be 100 after the experimental incubation period ().
Table 4. Partition coefficient, plasma protein binding, Caco-2 permeability and plasma stability of naphthyridine derivatives.
Metabolic stability of naphthyridine derivatives
The metabolic stability of all naphthyridine derivatives in human liver microsomes is depicted as % unmetabolized and summarized in . Derivatives 5, 6, 9 and 10 remained unmetabolized in liver microsomes. Derivative 1 metabolized to some extent (about 15%), while derivative 2 metabolized by more than 90%. Derivatives 3, 4, 7 and 8 were metabolized by more than 70%. Positive control, diclofenac metabolized by 45% in the current experimental conditions, which is in accordance with the published literature.
Our HPLC method did not show any prominent metabolite peaks for the compounds except derivative 2 which showed an extra peak at less retention time in the chromatogram. The probable reason of this could either be the formation of metabolite having less sensitivity in current chromatographic conditions or formation of very polar metabolite which eluted out in solvent front.
Partition coefficient of naphthyridine derivatives
Partition coefficients of these derivatives were assessed by their log P values. The lipophilic characteristics of drug affect its binding to the receptor targets. It is highly recommended to use drugs with good hydrophilic and lipophilic balance propertiesCitation29. For a good anticancer candidate, partition coefficient should remain low. Shortlisted naphthyridine derivatives showed the log P value in the range of 4.02 to 6.22 (). Most of the derivatives had shown the high lipophilic character (log p > 5.0), except derivatives 5 and 6 which showed the log P values around 4.0, suggesting that these two derivatives had good hydrophilic and lipophilic balance. Derivatives 3 and 4 showed very high lipophilic character (log p > 6.0)
Plasma protein binding of naphthyridine derivatives
Relevance of protein binding as ADME filter has gained importance in case of anticancer drugs. In past, Sparreboom et al. published a report on the (ir)relevance of protein binding in anticancer drugs but emphasized in the report that there are few conditions like protein concentration-dependent binding, irreversible or near covalently binding of compounds or formulation excipients modulated unbound drug levels, the assay becomes very relevantCitation30. The effects have been found significant with taxanes namely docetaxel and paclitaxel where unbound docetaxel rather than the total drug level is more closely related than total drug to drug induced hematological toxicityCitation31. Protein binding becomes more significant if the candidate is highly bound. All the naphthyridine derivatives showed very high protein binding (>97.0%) in human plasma () except derivative 1 which showed binding of 92.0%. High protein binding of these derivatives suggests that less free concentration will be available of these derivatives and therefore high doses may be needed for sustained activity.
Potential for inhibition of cytochrome P450 enzymes by naphthyridine derivatives
In cancer chemotherapy, setting drug interaction arising from CYP interaction is very well reportedCitation32–34. Drug candidates inhibiting cytochrome P450 has led to the removal of several drugs from the market during the past years because of the significant alteration in the PK of the drugsCitation35,Citation36.
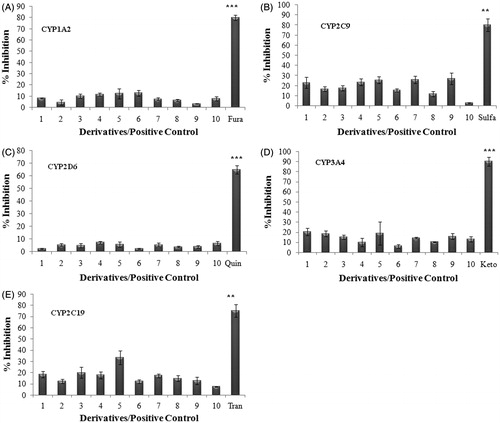
The effect of selected naphthyridine derivatives on CYP enzyme activity was determined by evaluating the changes in metabolism of the substrate of that CYP, in the presence of the derivative. Selected derivatives did not show any major inhibition of any of the selected CYPs. The maximum % inhibition of activity of CYP1A2, CYP2C9, CYP2D6, CYP3A4 and CYP2C19 by these derivatives was found to be 23.22%, 26.89%, 26.22%, 18.88% and 33.32%, respectively. The maximum inhibition by their respective inhibitors was found in the range of 65% to 90% (). CYP inhibition data suggest that the selected derivatives will not pose the interaction issues in clinical situations and can be used in combination therapy with other major anticancer drugs if required.
Figure 1. Inhibition of cytochrome P450 enzyme isoforms (A) CYP1A2, (B) CYP2C9, (C) CYP2D6, (D) CYP3A4 and (E) CYP2C19. The ability of compounds at 10 µM to inhibit substrate of five specific CYP enzymes was analyzed using fluorometric microtiter plate assay. Data shown are mean ± SEM of three independent experiments. ** and *** represent p < 0.05, p < 0.01 and p < 0.001 when compared with other compounds in the study.
Caco-2 cell permeability
There was no significant change in the TEER value (>400 Ω cm2) measured before and after the completion of transport studies. Papp values of Rhodamine 123(PappB-A: 98 ± 15 nm/s; PappA-B: 3 ± 1 nm/s) ensured complete standardization of Caco-2 cell monolayerCitation37. Derivative 6 showed permeability coefficient (PappB-A) of 198 ± 23 nm/s for the direction B-A and showed the permeability coefficient (PappA-B) of 9 ± 3 nm/s for the direction A-B. The efflux ratio (PappB-A/PappA-B) was found to be 22.0, suggesting it to be substrate of P-gp. In the presence of inhibitor verapamil A-B and B-A Papp values for transport of derivative 6 was found to be 123 ± 23 nm/s and 26 ± 8 nm/s, respectively, giving the net efflux ratio of 4.7.
PK analysis in rat
The in vivo PK of the derivatives 5, 6, 9 and 10, which showed favorable ADME properties, was carried out in rats (n = 4) by intravenous route. Derivative 6, due to its superior solubility and permeability properties, was also studied for its PK behavior after oral administration. The pharmacokinetic parameters AUC, which represent the extent of exposure and T1/2, which indicates the time of exposure, were compared for the selected derivatives. Higher AUC and optimum T1/2 is usually desirable, as this may represent the potential of candidate to achieve effective drug concentration in tumor with maintenance of the concentration up to sufficient time for showing efficacy.
The intravenous administration of the derivatives 9 and 10 surprisingly had not shown any detectable plasma levels while the plasma concentration profile of derivatives 5 and 6 were shown in . Noncompartmental analysis of the plasma time concentration data of derivatives 5 and 6 using WinNonlin v5.0.1 was performed (). Compound 6 showed elimination half-life of 7.02 ± 2.98 h and C0 of 6.61 ± 1.43 µg/mL. The AUC and Tmax were 14.45 ± 0.61 h × µg/mL and 0.05 h, respectively. The C0 and elimination half-life value of compound 5 were 6.98 ± 2.18 µg/mL and 2.45 ± 0.27 h, respectively. The AUC and Tmax were 11.58 ± 2.18 h × µg/mL and 0.05 h, respectively.
Figure 2. (A) Plasma concentration profile of derivatives 5 (squares) and 6 (diamond) following intravenous administration at 5.0 mg/kg dose in Wistar rat. Data shown in mean ± SD (n = 4). (B) Plasma and tumor concentration profiles of 5 and 6 following intravenous administration at 5.0 mg/kg dose in tumor-bearing mice (TBM). Data shown in mean ± SD (n = 4). Plasma and tumor concentration (µg/mL) determined by HPLC.
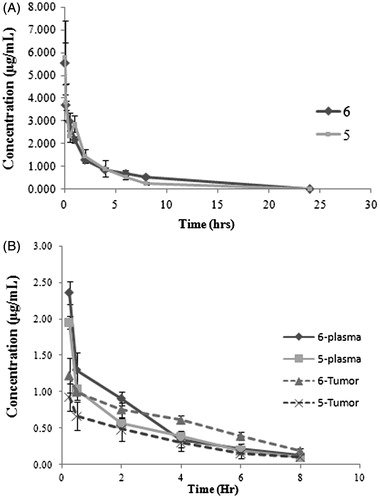
Table 5. Mean pharmacokinetic parameters of shortlisted naphthyridine derivatives following intravenous administration in Rat and Tumor bearing mouse (TBM) at intravenous dose of 5.0 mg/kg.*.
In vivo PK results showed favorable PK for the derivatives 5 and 6 by i.v. route (). The PK parameters of derivatives 5 and 6 were comparable. The derivative 6 showed slightly improved AUC and T1/2 values as compared to derivative 5 ().
Oral bioavailability of the derivative 6 could not be calculated as only few time points showed the plasma levels. This suggested that the compound 6 had poor oral bioavailability
PK and tumor uptake study in TBM
The derivatives 5 and 6 which showed acceptable plasma concentration time profile curve in rat were subjected to in vivo PK study using TBM. Following intravenous administration in TBM (n = 3), plasma concentration and tumor concentration profiles were evaluated (n = 3).
Noncompartmental analysis of the plasma concentration time data of derivative 6 showed the C0 of 4.41 ± 1.55 µg/mL, AUC of 5.15 ± 0.11 h × µg/mL and elimination half-life of 3.62 ± 2.48 h (). Similar analysis of derivative 5 showed the C0 of 3.67 ± 0.13 µg/mL, AUC of 4.40 ± 0.38 h × µg/mL and elimination half-life of 3.22 ± 1.85 h ().
Tumor concentration time data of derivatives 5 and 6 on non compartmental analysis showed the C0t of 5.21 ± 0.91 µg/gm, AUCt of 11.00 ± 3.56 h × µg/g, elimination half-life of 3.22 ± 0.24 h and C0t of 6.09 ± 2.04 µg/gm, AUCt of 20.68 ± 2.06 h × µg/g, elimination half-life of 3.01 ± 0.69 h, respectively ().
Plasma PK of the two compounds showed the comparable PK () but the tumor uptake of derivative 6 was found to significantly higher than the derivative 5. The TPI value for derivative 6 was 4.02 while the derivative 5 showed the TPI value of 2.50 for similar parameters ().
In vivo antitumor activity
Based on in vitro anticancer activity and ADME properties, derivative 6 was evaluated for in vivo antitumor activity. In this study, cosolvent formulation of derivative 6 was dosed continuously for 14 days in ovarian xenograft at an early stage (tumor volume ≈ 100 mm3) by intravenous route. Control animals received equivalent volume of vehicle for the same period.
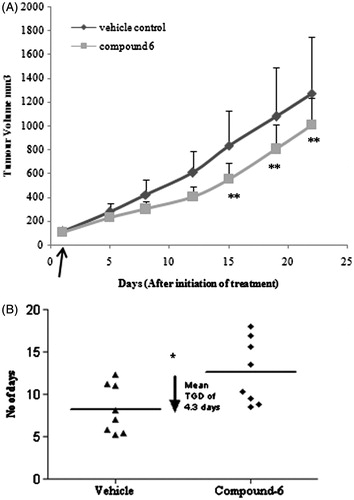
Data showed that derivative 6 inhibited the growth of tumor volume in comparison with vehicle control. The lowest mean percentage treatment/control (T/C) value of 66.4 was shown on day 15. Mean % T/C for the entire group was calculated from tumor volume data. The highest mean TGI value of 33.6 was shown on day 15. Mean tumor volume data are represented in . With derivative 6, the time taken to reach the 4 × tumor volume in the treatment group at the dose of 5 mg/kg (G2) was 13 days and its growth delay for the same was 4.3 days with respect to vehicle control group .
Figure 3. In vivo antitumor activity of derivative 6. (A) Derivative 6 showed 33% tumor growth inhibition (TGI) against human ovarian xenograft model. Curve indicates the tumor volumes of ovary (PA1) tumor-bearing mice of vehicle-treated (circle) and derivative 6-treated (square) groups at i.v. dose of 5.0 mg/kg once daily for 14 day. **Represents p < 0.01 when compared with untreated group (B) Dotplot of derivative 6 showed mean tumor growth delay (TGD) of 4.3 days to reach the 4x tumor volume. Linear regression y = 45.41x + 56.45(R2 = 0.998) and y = 26.88x + 84.24(R2 = 0.99) was followed for time to reach 4x start volume for vehicle and treated group, respectively. *represents p < 0.05 when compared with untreated group (Mann–Whitney U test). Horizontal line (–) indicates the mean value. The Data shown are mean ± SD (n = 8). Arrow indicates start of the treatment.
Intravenous administration of derivative 6 at the tested dose level of 5 mg/kg did not cause significant body weight loss, and mortality during dosing period which indicates there was no test item related systemic toxicity.
Considering all the above parameters, that is, TV, % T/C and TGI, 14 days continuous i.v. administration of 6 showed antitumor potential in ovarian cancer with no or minimum systemic toxicity.
Discussion
In our present work toward the discovery of naphthyridine derivatives as anticancer agents, investigations were made to identify the lead compound through evaluation of in vitro, in vivo and PK/PD properties of 10 novel C-3 modified 1, 8-Naphthyridine-3-Carboxamide derivatives, 1 to 10. These derivatives selected from our previous study were reported to have excellent in vitro cytotoxicity across various cancer cell linesCitation10,Citation11.
The initial selection of derivatives was made based on the reported IC50 values of the derivatives across various cancer cell lines. The mean IC50 values and cancer cell specificity values are used in selecting these 10 derivatives. Cancer cell specificity of test derivative was calculated using the ratio IC50 in normal cell line/IC50 in cancer cell line and termed as N/T. If N/T was greater than 2, the derivative was designated as more specific to cancer cells than normal cells (). The in vitro PK evaluations of these selected derivatives were made using set of ADME assays like solubility, permeability and partition coefficient, which are species independent, and assays like metabolic stability, plasma stability and CYP inhibition which assess the acceptability of derivatives in clinical situations. To understand the PK behavior in animals, we have focused on in vivo PK/PD studies rather than in vitro assays. This has been done to reduce time and cost while maintaining the accuracy of choosing the right candidate. However, stability studies were also performed in rat plasma to rule out false negative PK behavior in the in vivo PK in rats. The in vivo PK of the selected derivatives was performed in rats and TBM. The design of in vivo PK experiments provided in vivo PK properties, interspecies scaling of PK between the two species and PK/PD correlation for these selected derivatives, to accurately choose the right candidate. The metabolic stability of these derivatives in rat liver microsome (RLM) and mouse liver microsomes (MLM) was also carried out providing rationale for the selection of species. Derivatives were found stable in both RLM and MLM (data not shown).
The in vitro ADME results indicated that these derivatives have comparable data for properties like protein binding, CYP inhibition, plasma stability. However, the derivatives differ in other ADME properties like solubility, permeability, metabolic stability and Log P. The derivatives were found to be very susceptible to metabolic stability in HLM and in general had poor solubility and permeability. Poor HLM stability of the compound generally leads to rapid clearance, low bioavailability and very short half-life in humans. Such compounds metabolize rapidly in humans, which would ultimately result in loss of efficacy. The derivatives 1, 2, 3, 4, 7 and 8 were screened out from the further development because of poor metabolic stability in HLM. Glutathione conjugation of derivatives 9 and 10 immediately after entering the systemic circulation further reflected the sensitivity of these derivatives toward phase II metabolism. This phenomenon could be responsible for higher MTD of these compounds in rat. The battery of in vitro and in vivo ADME assays employed for the derivatives led to the selection of two promising derivatives 5 and 6, which showed acceptable in vitro and in vivo PK. Both the derivatives showed comparable PK. However, when the derivatives were subjected to PK and tumor uptake evaluations in tumor-bearing mice, the derivative 6 showed much better tumor uptake as compared to derivative 5, as reflected by their respective TPI values () and emerged as a lead compound. A better log P value of derivative 6 is likely to result in a better tumor uptake of 6 as compared to 5. Because the efficacy of an anticancer compound is directly related to the tumor uptake of the compound, derivative 6 was expected to show better efficacy. This was further confirmed in our preliminary in vivo efficacy study of derivative 6 which showed good efficacy with TGI value of 33.6% on day 15. Because derivative 6 showed excellent in vitro cytotoxicity in PA1 cell line, in vivo efficacy was carried out in ovarian xenograft.
The lead compound 6, selected from the our screening process, showed high metabolic stability in HLM, high human plasma stability and low CYP inhibition which ensures excellent acceptability of the compound in clinical situation. Derivative 6, with solubility value >200 µM and permeability >63%, is expected to show good oral bioavailability if the compound’s absorption in the systemic circulation is through passive diffusion mechanism but the oral bioavailability was found to be poor. The poor bioavailability of derivative 6 can be attributed to P-gp interaction. Caco-2 permeability assay established that the derivative 6 is a substrate of P-gp and seems to get efflux out upon oral administration. A suitable formulation of derivative 6, containing excipients having efflux transport inhibition properties, could increase the oral bioavailability of the derivative. Appropriate structural modification in 6 which selectively increase the solubility and alter its interaction with P-gp without any alteration of other properties may also increase the bioavailability of the compound. The systemic bioavailability of the derivative via intravenous route was found to be good. Although there was good interspecies scaling of PK properties in the two species, as at similar dose (5.0 mg/kg), the AUC and Co values were found to be double in rat as compared to the TBM. Comparative PK in mouse (without tumor) and TBM need to be evaluated to further confirm the fact. However, the same scaling was not reflected in the MTD evaluations. A good interspecies scaling of MTD dose should have shown the MTD of 30 mg/kg in nontumor-bearing athymic nude mice but it actually showed the value much less than that (15.0 mg/kg). The possible reason could be the higher sensitivity of immune-compromised mice as compared to rats. In efficacy study, although the derivative 6 showed good efficacy with TGI value of 33.6% on day 15 at dose of 5.0 mg/kg, when dosing is discontinued after 14 days, the growth rate (slope) of the treated tumors showed relatively less lasting effect. The short half-life of the derivative could be the reason for such behavior. However, the MTD value in athymic nude mice (15.0 mg/kg) suggests that the doses can be further increased 2- to 3-fold for enhanced efficacy and good lasting effect. In our present investigation, the derivative 6 was tested for ovarian cancer due to its best in vitro cytotoxicity in PA1 cell line (0.41 µM); however, it can show good efficacy in colon and lungs models also because of better in vitro cytotoxicity in their respective cell lines.
Structural correlation with in vitro ADME results revealed that -R1 and -R2 groups of C3 carboxamide and –X (halogens) group at C6 and C7 have significant role in establishing the ADME properties of derivatives (). Halogen groups (-Cl and -F) at C6 and C7 position significantly reduce the solubility and permeability of the compounds. Further, high electronegativity of these groups makes the compounds more susceptible to glutathione conjugation. Although the compounds with halogen group show broad spectrum cytotoxicity, PK properties of the compounds were severely compromised due to these groups. Derivative 4, which is devoid of one –CH2 group, had superior in vitro cytotoxicity and selectivity. The hydroxyl group (–OH) in the carboxamide chain also affects the solubility. Derivatives 1, 2, 3 and 4, which are devoid of –OH and have halogens in structure, have lowest solubility among all the derivatives. Derivatives 5 and 6 without halogen at C6 and C7 position have maximum solubility. Group -R2 in the carboxamide group has strong correlation with the metabolic stability of the derivatives. Saturated cyclic ring structure at R2 is responsible for derivatives susceptibility to metabolic instability. We propose a rational approach for pharamcokinetically superior molecules by modifications at position –X and –R1 with suitable functional group to further increase the solubility and permeability of these derivatives keeping the functional group at –R2, which renders metabolic stability to these derivatives. Compounds with no –CH2 in the side chain attached to C-3 and a suitable functional group at –X and –R2 may also have promising drug-like properties.
The preliminary PK of the derivative 6 was found to be better than PK of voreloxin; (+)-1, 4-dihydro-7-(trans-3-methoxy-4-methylamino-1-pyrrolidinyl)-4-oxo-1 -(2-thiazolyl)-1, 8naphthyridine-3-carboxylic acid formally known as SNS-595, which is under investigation for the treatment of platinum resistant ovarian cancer and acute myeloid leukemia in phase II clinical trials (n = 38). Voreloxin showed C0 of 4.3 ± 0.9 µgEq/mL and AUC of 17 ± 2 µgEq × h/mL in rats at dose of 10 mg/kg while derivative 6 had approximately similar levels at 5.0 mg/kg only (). The half-life of derivative 6 is comparable to Voreloxin. Comparing the potential of 6 as anticancer agent with other molecules of different class, under development, also revealed that our compound has superior efficacy. A lead compound 89 S of pyrrolopyridinones class which is under developmentCitation39 has shown TGI value of 68% at oral dose of 60.0 mg/kg in ovarian xenograft model. The in vitro cytotoxicity and ADME properties of derivative 6 were found comparable with 89 S except oral bioavailability which was better for 89 S. Another compound, 18 which is under preclinical development and belongs to chemical class of 5-hetroaryl-3-carboxamido-2-substituted pyrrolesCitation40 showed the TGI of 90% in ovarian xenograft model but at much higher dose of 90 mg/kg. In vitro cytotoxicity and ADME properties of derivative 6 were found to be much superior to the compound 18. Compound 18 has reported solubility of 179 µM, permeability value (Log Pe) of 6.0 and IC50 value of 0.8 in A2780 cell lineCitation40. This suggests that the compound 6, (2-hydroxy-1-phenyl-2-(pyridine-2-ylcarbamoyl)-ethyl-1,4-dihydro-4-oxo-1-proparagyl-1, 8-naphthyridine-3-carboxamide, has the potential for treating ovarian cancer. However, to develop the compound further as a useful clinical candidate the detailed toxicity profile of derivative across various species and a detailed in vivo efficacy profiling needs to be performed.
Conclusion
In vivo efficacy of derivative 6 validated our hypothesis of choosing the battery of in vitro and in vivo ADME assays for lead identification. The strategy of using PK/PD based assay (PK in tumor-bearing mice) in the set of assays for the selection of derivatives led to development of a logical process of screening with improved probability of selecting the compounds with favorable ADME properties for further development. Derivative 6 with good in vitro cytotoxicity, optimum PK properties and good in vitro–in vivo correlation appears to have good potential to be developed as a systemically administered anticancer drug.
Declaration of interest
The authors report no declarations of interest.
We are thankful to the Dabur Research Foundation for the financial support for this research.
References
- FDA. News Drug Pipeline Alert. 2006;4:56
- Burden DA, Osheroff N. Mechanism of action of eukaryotic topoisomerase II and drugs targeted to the enzyme. Biochim Biophys Acta 1998;1400:139–54
- Tomita K, Tsuzuki Y, Shibamori K, et al. Synthesis and structure activity relationships of novel 7-substituted 1,4-dihydro-4-oxo-1-(2-thiazolyl)-1-8-naphthyridine-3-caboxylic acids as antitumour agents. Part 1. J Med Chem 2002;45:5564–75
- Tsuzuki Y, Tomita K, Shibamori K, et al. Synthesis and structure activity relationships of novel 7-substituted 1,4-dihydro-4-oxo-1-(2-thiazolyl)-1-8-naphthyridine-3-caboxylic acids as antitumour agents. J Med Chem 2004;47:2097–109
- Baez A, Gonzalez FA, Vazquez D, Waring M. Interaction between a 3-nitrobenzothiazolo (3,2-a) quinolinium antitumour drug and deoxyribonucleic acid. Biochem Pharmacol 1983;32:2089--94
- You QD, Li ZY, Huang CH, et al. Discovery of a novel series of quinolone and naphthyridine derivatives as potential topoisomerase I inhibitors by scaffold modification. J Med Chem 2009;52:5649–61
- Banti I, Nencetti S, Orlandini E, et al. Synthesis and in-vitro antitumour activity of new naphthyridine derivatives on human pancreatic cancer cells. Pharm Pharmacol 2009;61:1057–66
- Atanasova M, Ilieva S, Galabov B. QSAR analysis of 1,4-dihydro-4-oxo-1-(2-thiazolyl)-1,8-naphthyridines with anticancer activity. Eur J Med Chem 2007;42:1184–92
- Srivastava SK, Jaggi M, Singh AT, et al. Anticancer and anti-inflammatory activities of 1,8-naphthyridine-3-carboxamide derivatives. Bioorg Med Chem Lett 2007;17:6660–4
- Kumar V, Jaggi M, Singh AT, et al. 1,8-Naphthyridine-3-carboxamide derivatives with anticancer and anti-inflammatory activity. Eur J Med Chem 2009;44:3356–62
- Kumar V, Madaan A, Sanna VK, et al. Anticancer and immunomodulatory activities of novel 1,8-naphthyridine derivatives. J Enzyme Inhib Med Chem 2009;24:1169–78
- Kennedy T. Managing the drug discovery/development interface. Drug Discovery Tech 1997;2:436–44
- Kola I, Landis J. Can the pharmaceutical industry reduce attrition rates? Nature Rev 2004;3:711–15
- Masimirembwa CM, Bredberg U, Andersson TB. Metabolic stability for drug discovery and development: pharmacokinetic and biochemical challenges. Clin Pharmacokinet 2003;42:515–28
- Baranczewski P, Stanczak A, Sundberg K, et al. Introduction to in vitro estimation of metabolic stability and drug interactions of new chemical entities in drug discovery and development. Pharmacol Rep 2006;58:453–72
- Yan Z, Caldwell GW. Metabolism profiling, and cytochrome P450 inhibition & induction in drug discovery. Curr Top Med Chem 2001;1:403–25
- Singh SS. Preclinical pharmacokinetics: an approach towards safer and efficacious drugs. Curr Drug Metab 2006;7:165–82
- Lv H, Wang F, Reddy MV, et al. Screening candidate anticancer drugs for brain tumour chemotherapy: pharmacokinetic-driven approach for a series of (E)-N-(substituted aryl)-3-(substituted phenyl)propenamide analogues. Invest New Drugs 2012;30:2263--73
- Motl S, Zhuang Y, Waters CM, Stewart CF. Pharmacokinetic considerations in the treatment of CNS tumours. Clin Pharmacokinet 2006;45:871–903
- OECD Guidelines for the Testing of Chemicals, Section 1, Physical-Chemical properties. Test No. 107: Partition Coefficient (n-octanol/water): Shake Flask Method; 1995
- Schmidt D, Lynch J. Evaluation of the reproducibility of Parallel Artificial Membrane Permeation Assays (PAMPA) Millipore Protocol No. AN1728EN00, Millipore Corporation, USA, 2002. Available from: http://www.millipore.com/publications.nsf/docs/an1728en00 [last accessed 2002]
- Sugano K, Hamada H, Machida M, Ushio H. High throughput prediction of oral absorption: improvement of the composition of the lipid solution used in parallel artificial membrane permeation assay. J Biomol Screen 2001;6:189–96
- Rodrigues AD. Use of in vitro human metabolism studies in drug development. Biochem Pharmacol 1994;48:2147–56
- GENTEST Technical Bulletin. Methodology of a high throughput method for measuring cytochrome P450 inhibition. Woburn (MA): GENTEST Corporation; 1998
- Bansal T, Awasthi A, Jaggi M, et al. Pre-clinical evidence for altered absorption and billary excretion of irinotecan (CPT-11) in combination with quercetin: possible contribution of P-glycoprotien. Life Sci 2008;83:250–9
- Troutman MD, Thakker DR. Rhodamine 123 requires carrier-mediated influx for its activity as a P-glycoprotein substrate in Caco-2 cells. Pharm Res 2003;20:1192–9
- Plowman J. Human tumour xenograft models in NCI drug development. In: Teicher B, ed. Anticancer drug development guide: preclinical screening, clinical trials, and approval. Totowa (NJ): Humana Press Inc; 1997:101–25
- Kelland LR. Of mice and men: values and liabilities of the athymic nude mouse model in anticancer drug development. Eur J Cancer 2004;40:827–36
- Pliska V, Testa B, Waterbeemd H. Lipophilicity in drug action and toxicology. New York: John Wiley & Sons Ltd; 1996:439
- Sparreboom A, Nooter K, Loos WJ, Verweij J. The (ir) relevance of plasma protein binding of anticancer drugs. Neth J Med 2001;59:196–207
- Baker SD, Li J, Tije AJ, et al. Relationship of systemic exposure to unbound docetaxel and neutropenia. Clin Pharmacol Ther 2005;77:43–53
- Brockmoller J, Roots I. Assessment of liver metabolic function: clinical implications. Clin Pharmacokin 1994;27:216–48
- Kivisto KT, Neuvonen PJ, Klotz U. Inhibition of terfenadine metabolism: pharmacokinetic and pharmacodynamic consequences. Clin Pharmacokin 1994;27:1–5
- Balis FM. Pharmacokinetic drug interactions of commonly used anticancer drugs. Clin Pharmacokin 1986;11:23–235
- Friedman MA, Woodcock J, Lumpkin MM, et al. The safety of newly approved medicines: do recent market removals mean there is a problem. JAMA 1999;281:1728–34
- Lasser KE, Allen PD, Woolhandler SJ, et al. Timing of new black box warnings and withdrawals for prescription medications. JAMA 2002;287:2215–20
- Irvine JD, Takahashi L, Lockhart K, et al. MDCK (Madin-Darby canine kidney) cells: a tool for membrane permeability screening. J Pharm Sci 1999;88:28–33
- Evanchik MJ, Allen D, Yoburn JC, et al. Metabolism of (+)-1,4-dihydro-7-(trans-3-methoxy-4-methylamino-1-pyrrolidinyl)-4-oxo-1-(2-thiazolyl)-1,8-naphthyridine-3-carboxylic acid (voreloxin;formerly SNS-595), a novel replication-dependent DNA-damaging agent. Drug Metab Dispos 2009;37:594–601
- Menichincheri M, Bargiotti A, Berthelsen J, et al. First Cdc7 kinase inhibitors: pyrrolopyridinones as potent and orally active antitumour agents. 2. Lead discovery. J Med Chem 2009;52:293–307
- Menichincheri M, Albanese C, Alli C, et al. Cdc7 kinase inhibitors: 5-heteroaryl-3-carboxamido-2-aryl pyrroles as potential antitumor agents. 1. Lead finding. J Med Chem 2010;53:7296–315