
Abstract
The aim of this study is to propose an improved computational methodology, which is called Compressed Images for Affinity Prediction-2 (CIFAP-2) to predict binding affinities of structurally related protein–ligand complexes. CIFAP-2 method is established based on a protein–ligand model from which computational affinity information is obtained by utilizing 2D electrostatic potential images determined for the binding site of protein–ligand complexes. The quality of the prediction of the CIFAP-2 algorithm was tested using partial least squares regression (PLSR) as well as support vector regression (SVR) and adaptive neuro-fuzzy ınference system (ANFIS), which are highly promising prediction methods in drug design. CIFAP-2 was applied on a protein–ligand complex system involving Caspase 3 (CASP3) and its 35 inhibitors possessing a common isatin sulfonamide pharmacophore. As a result, PLSR affinity prediction for the CASP3–ligand complexes gave rise to the most consistent information with reported empirical binding affinities (pIC50) of the CASP3 inhibitors.
Introduction
Significant progress has been made by scientists towards understanding diseases at molecular levels by developing new methods in the field of genomics, proteomics as well as medicine. Increasing stored knowledge of drug actions at a molecular level renders development of some novel drugs which are safer and more efficient in medical treatmentsCitation1. Experimental drug discovery and development is a time-consuming and expensive process which may involve testing a large library of compounds that frustratingly yield many failures in drug discovery. Understanding protein–ligand interactions at a molecular level is important to design new drugs which are safe and efficient. Computational methods such as docking and molecular dynamics have become powerful, time-saving and cheaper methods for providing detailed information on protein–ligand interactions. However, docking energy functions provided by docking programs are not always reliable as majority of docking energy functions do not include electrostatic and non-electrostatic contributions to solvation. In other words, docking energy functions mostly employ electrostatic and Van der Waals energy terms determined in space, but not in aqueous media. Intelligent computational methods have recently become popular in drug designCitation2–10. It is possible to search for or predict specific properties of new drugs by using information from known ligand–receptor interactions in association with bioinformatics and machine learning methodsCitation11.
We previously reportedCitation12 a novel pharmacophore-based drug development algorithm for data representation, namely Compressed Images for Binding Affnity Prediction (CIFAP), to predict binding affinities for an array of different ligands (carrying a common pharmacophore) interacting with the binding site of a protein. CIFAP is implemented in two phases: In the first phase, CIFAP involves preperation of orthogonal 2D-compressed grid images of experimentally determined or docked coordinates of ligand–receptor complexes. The second phase of CIFAP predicts binding affinities by filtering the 2D images by Sequential Forward Selection (SFS) techniqueCitation13 to find certain patterns, followed by application of regression and learning methods such as the Support Vector Regression (SVR)Citation14 and Adaptive Neuro-Fuzzy Inference System (ANFIS)Citation15 methods to make a correlation between observed and predicted binding affinites.
CIFAP has two major drawbacks due to the choice of feature selection and prediction algorithms. The first drawback is the irreversible feature selection of the SFS method. Once a feature is selected by SFS, it cannot be removed from the feature set. However, a previously selected feature may reduce performance when it is used in combination with other selected features. The second drawback is about an expensive parameter tuning process applied by the SVR and ANFIS algorithms. For finding the optimal parameters, SVR uses an exhaustive grid search, while ANFIS uses a neural network which takes a long time to train. Moreover, both algorithms do not guarantee globally optimized parameters since there is a trade-off between generalization ability and prediction performance of the algorithms.
In this study, CIFAP-2, an improved version of CIFAPCitation12, is proposed based on some fine-tunings applied on two main phases taken to implement CIFAP. While the first phase of CIFAP-2 is identical to that of CIFAP, the second phase of CIFAP-2 utilizes the sequential forward floating selection (SFFS) methodCitation16, but not SFS as in CIFAP. That follows a predicition step which involves using the partial least squares regression (PLSR) algorithmCitation17 as well as SVR and ANFIS. The aforementioned algorithms selected for CIFAP-2 is hoped to overcome the drawbacks of CIFAP. SFFS method extracts more predictive features than SFS because the method can eliminate features that are not found useful in later steps. Furthermore, PLSR, which does not need time-consuming parameter search, provides a more simple linear fit between the data model and binding activities.
Caspase enzymes (CASP) play an important role in the process of apoptosisCitation18, a programmed-cell-death playing a major role in cell damage and immune system activitiesCitation19. Caspase activity is related to a number of diseases including neurodegenerative diseases, stroke, cardiomyopathy, ischemia and cancersCitation18,Citation20,Citation21. For instance, CASP3 becomes active in Alzheimer's disease, triggering neural apoptosisCitation18. Controlling cell death by capase enzyme inhibition is thought to be effective in the treatment of the aforementioned diseasesCitation21.
Recent experimental studies report that isatin sulfonamide analogues could be promising inhibitors of CASP3 in medical therapyCitation22–24. In this study, the applicability of CIFAP-2 is evaluated by implementation on 35 isatine sulfonamide derivatives in complex with human CASP3 enzyme, whose half maximal inhibitory concentrations (IC50) as well as their pIC50 values are defined in literatureCitation20,Citation25, hoping that CIFAP-2 will have a future in the design and development of novel CASP3 inhibitors.
Methods
Data modeling methods
Ligand preparation and docking
Chemical structures of 35 Caspase 3 (CASP3) inhibitors used in this study, carrying an isatine sulfonamide pharmacophore, and their experimental pIC50 values were published by Hasegawa et al. ( therein)Citation25. X-ray coordinates for human CASP3, the receptor, in a complex with compound 1 were obtained from the Protein Data Bank, PDB ID: 1GFWCitation26. Ligands were constructed and minimized by the MM2 force field using HyperChem v.5.1 (Hypercube, Inc., Gainesville, FL), which were then saved in MOL2 format. The ligands were then converted to Protein Data Bank (PDB) format by Discovery Studio Visualizer v.1.7Citation27.
Table 1. RMSE comparison between observed binding affinities (pIC50) for 35 CASP3 inhibitors, published by Wang et al.Citation20, and the corresponding binding affinities (pIC50) predicted by the PLSR, SVR, and ANFIS determination of leave-one-out cross-validation for the X-feature vectors of the testing data sets.
Compound 1, the reference compound, was initially removed from the binding site of CASP3. MGL Tools v.1.5.4Citation28 was used to prepare the ligands and the receptor for docking, which were then saved in PDBQT format. AutoDock Vina v.1.1.2Citation29 was used to dock the ligand flexibly into the binding site of the rigid coordinates of human CASP3. Ligands were docked in a confined grid box, set by MGL Tools v.1.5.4, encapsulating the binding site of CASP3. The most suitable docked coordinates of ligands were selected based on the lowest RMSD coordinates of the isatine sulfonamide pharmacophore in reference to the X-ray coordinates of compound 1, PDB ID: 1GFWCitation26. Protons of docked ligands were added by MGL Tools v.1.5.4, which were then saved in PDB format.
Generation of 2D compressed ımages from 3D cubic grids
A cubic frame with dimensions of 37 Å × 37 Å × 37 Å that centers the binding site of the receptor was set by MGL Tools v.1.5.4. Center coordinates for the cubic frame was determined by averaging the center coordinates of all ligands. Electrostatic potential grid map files in ASCII format were generated for all ligand–receptor complex structures within the cubic frame by the AutoGrid v4.2 module of AutoDock v4.2 suite of programsCitation30. Each cubic grid contains 37 electrostatic potential grid points separated by 0.5 Å in all dimensions. It is worthy of note here that the grid cube should be preferentially as small as possible, including only the ligand and the binding interface, so that more significant grid points are focused on.
3D electrostatic potential matrices for the binding site of the complexes were constructed by MATLABCitation31 using the corresponding electrostatic potential grid map files as input. The matrices were then compressed through the X, Y, and Z directions into 2D images by summing up the electrostatic potential values at the subsequent grid points in orthogonal dimensions, which gave rise to three 2D images for each complex: namely, the X-image, the Y-image, and the Z-image, respectively. Each image possesses a total of 1369 pixels of the compressed electrostatic potential values, which were used as feature sets in the feature selection step.
Feature selection
Compressed 2D images, possessing a total of 1369 (37 × 37) compressed features (pixels), were further processed to generate the corresponding X/Y/Z feature vectors. Sequential Floating Forward Selection (SFFS) methodCitation16 was then applied to reduce the number of features in the vectors to avoid irrelevant and redundant features. To do so, SFFS algorithm started out with an empty feature set and applied a forward selection step by randomly adding a single feature one at a time, whose prediction error is validated by Multiple Linear RegressionCitation32 with leave-one-out cross-validationCitation33. An added attribute yielding a large error of prediction is then removed from the future set when necessary by backward elimination method to ensure the best generalizationCitation16. Cycles of single forward selection followed by backward elimination steps continues until the least prediction error levels off in the feature set.
Prediction methods
Prediction methods include regression analysis which aims to discover the relationship between a dependent variable, ![]() , and n-dimensional independent variables,
, and n-dimensional independent variables, ![]() , in the form of the function f(x1, … , xn) = y. Here, xi corresponds to SFFS features obtained from 2D compressed images while y corresponds to the binding affinity expressed in observed pIC50 values. In this study, three prediction methods were applied by MATLABCitation31 to test CIFAP-2 on CASP3 inhibitors: (1) PLSRCitation17, (2) Support Vector Regression (SVR)Citation14, and (3) Adaptive Neuro-Fuzzy Inference System (ANFIS)Citation15. Theoretical background for the first prediction method is given in details in the following subsection, while the last two prediction methods were already described by Erdaş et al.Citation12 as prediction methods utilized in the development of CIFAP.
, in the form of the function f(x1, … , xn) = y. Here, xi corresponds to SFFS features obtained from 2D compressed images while y corresponds to the binding affinity expressed in observed pIC50 values. In this study, three prediction methods were applied by MATLABCitation31 to test CIFAP-2 on CASP3 inhibitors: (1) PLSRCitation17, (2) Support Vector Regression (SVR)Citation14, and (3) Adaptive Neuro-Fuzzy Inference System (ANFIS)Citation15. Theoretical background for the first prediction method is given in details in the following subsection, while the last two prediction methods were already described by Erdaş et al.Citation12 as prediction methods utilized in the development of CIFAP.
In general, future sets are grouped into training and test sets for validation by, for instance, repeat random subsampling (RRS)Citation12,Citation33. However, RRS is not applied in this study for validation of CASP3–ligand complexes due to insufficient number of the ligands. Instead, leave-one-out cross-validationCitation33 was utilized for the validation of the sample sets. The leave-one-out cross-validation methodCitation33 picks up a different X-,Y-,Z-feature vector as a test set at each step and leaves the remaining X-,Y-,Z-feature vectors as a training set for implementation of the prediction method. The performance of the prediction method was determined by averaging the resulting performance of each test set.
Partial least squares regression
In this study, PLSRCitation17 was utilized as one of the prediction methods to test CIFAP-2 on CASP3–ligand complexes. PLSR aims to find a dependent variable, Y, resulting in independent variables, X, in order to extract their common statistical properties.
PLSR employes the leave-one-out cross-validation methodCitation33, see previous section, to test CIFAP-2 on CASP3 inhibitors. Feature vectors obtained from X-pattern, Y-pattern, and Z-pattern images by SFFS methodCitation16 were used as input to compute a PLSR model including linear coeffcients of each variable for each training set. The coeffcients are then used to predict pIC50 values for the test vectors, which are then validated by the leave-one-out cross-validation method.
Performance evaluation
General performance terms used in this study for the evaluation of predicted pIC50 values are root mean square error (RMSE) and coeffcient of determination (R2), whose equations and their implementation were previously described by Erdas et al.Citation12.
As far as leave-one-out cross-validation is concerned, a criterion of > 0.5, reported by Tropsha et al.Citation34,Citation35, was used for a regression model to be predictive.
Results and discussion
In general, the size of the cubic frame (37 Å × 37 Å × 37 Å) used to generate electrostatic potantial map for docked compounds in complex with CASP3 gave rise to meaningful 2D features sets after compression. “Supplementary Figure S1” exemplifies orthogonal 3D- as well as 2D-compressed views of the grid cube for the docked coordinate of the CASP3–compound 1 complex.
Feature selection by the SFFS algorithmCitation16 was implemented before the prediction phase in order to eliminate redundant features and find out the most informative features. To do that, 2D X-, Y-, and Z-images were initially converted to feature vectors as described in Section “Feature Selection”. The best RMSE values determined by SFFS computations were found to be 0.0964, 0.1797, and 0.1421 upon leave-one-out cross-validation of the X-images, Y-images, and Z-images, respectively. The future vectors obtained by SFFS were then transformed into 2D pattern images for visualization as shown in , where black pixels represent informative features used to predict pIC50.
Figure 1. (A) X-, (B) Y- and (C) Z-pattern images of CASP3–ligand complexes obtained by sequential floating forward selection, SFFS. Each image has 37 × 37 pixels. Black pixels represent the selected features.
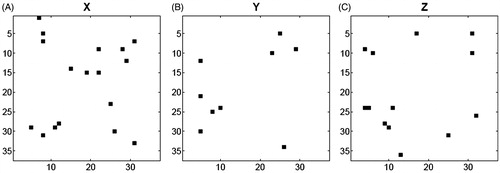
SFFS determined 17, 9, and 13 valuable features from the X-, Y-, and Z-images, respectively, to be used in regression analysis. It was determined that X-images of isatine sulfonamide analogues in complex with CASP3 gave rise to the lowest RMSE values, due probably to the greatest 2D area occupied by the ligand when looking at the cubic grid in the binding site through the X-axis as in Figure S1. It should be noted here that, except for a few patterns in the X-pattern image (Figure S1a), meaningful features are usually located away from the center, corresponding to binding interface between the ligands and CASP3.
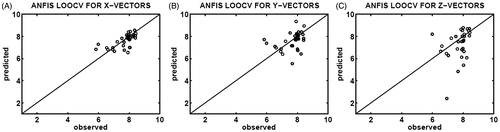
The binding affinities (pIC50) of CASP3–ligand complexes were predicted by ANFIS, SVR, and PLSR using the X-feature, Y-feature, and Z-feature vectors obtained by the SFFS algorithm. Three scatter plots in show a correlation between the experimental and predicted affinities upon application of ANFIS with leave-one-out cross-validation which utilized 35 distinct test sets for each of the X-feature, Y-feature, and Z-feature vectors of CASP3–ligand complexes. The X-scatter and Y-scatter plots in , respectively, indicate better correlations than that of the Z-scatter plot in , whose data are distributed away from the identity (y = x) line. Moreover, the RMSE values obtained by ANFIS determination of leave-one-out cross-validation (RMSE = 0.5299, 0.7992 and 2.7216 for the X-feature, Y-feature and Z-feature vectors, respectively) indicate that ANFIS failed to predict the binding affinities from the feature vectors obtained from Z-images of CASP3–ligand complexes. In addition to the high RMSE values, the resulting R2 values of 0.3347, 0.1359, and 0.0023 for the X-feature, Y-feature, and Z-feature vectors, respectively, suggest that the ANFIS determination of leave-one-out cross-validation was not a suitable method of prediction in CIFAP-2.
Figure 2. Correlation plots of the observed (x-axis) and predicted (y-axis) binding affinities (pIC50) constructed upon ANFIS determination of leave-one-out cross-validation (LOOCV), using 35 different testing sets selected from the X-feature (A), Y-feature (B), and Z-feature (C) vectors of the CASP3–ligand complexes.
In order to predict binding affinities of the CASP3–ligand complexes, SVR with RBF-kernel was applied to X-feature, Y-feature, and Z-feature vectors produced in data modelling phase. In order to predict binding affinities, the SVR parameters including C, the trade-off value between error tolerance and model complexity, ɛ, the radius of the ɛ-tube, and γ, the width of the RBF-kernel, were initially optimized by a grid search using the leave-one-out cross-validation. The optimal C, ɛ, and γ values for the X-feature, Y-feature, and Z-feature vectors which provided the lowest RMSE and the highest R2 values were selected for the SVR models of X-, Y-, and Z-images. The optimal C parameter for all three models of CASP3–ligand complexes was found to be 100. Values of C lower than 100 was not found to be useful as these values cause the predictive model to be smooth and general. Optimal values for the ɛ parameter were computed to be 0.0063 for the X-image, 0.0611 for the Y-image, and 0.0249 for the Z-image. Moreover, optimal values for the γ parameter were computed to be 0.008 for the X-image, 0.0032 for the Y-image, and 0.0143 for the Z-image.
SVR with RBF-kernel was applied to predict the binding affinities (pIC50) of 35 CASP3 inhibitors by using the leave-one-out cross-validation as well as optimal C, ɛ, and γ values.
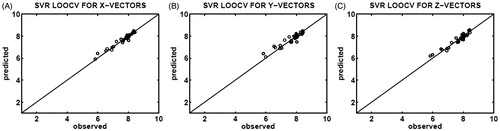
Correlations between the observed (x-axis) and predicted (y-axis) binding affinities are shown in for the X-feature vectors, for the Y-feature vectors, and for the Z-feature vectors of CASP3–ligand complexes. As seen in , feature vectors in all directions results in good correlations. Furthermore, it is seen in that the X-feature and Z-feature vectors led to better correlations with smaller margins as compared to the Y-feature vectors. All three SVR models are capable of addressing at least 87% of the variability in the data. In addition, R2 values of 0.9476, 0.8791, and 0.9213 obtained for the X-feature, Y-feature, and Z-feature vectors, respectively, verify that all three SVR models are predictive considering the first Tropsha criterionCitation34,Citation35, see Section “Performance evaluation”.
Figure 3. Correlation plots of the observed (x-axis) and predicted (y-axis) binding affinities (pIC50) constructed upon SVR determination of leave-one-out cross-validation (LOOCV), which utilized 35 different testing sets selected from the X-feature (A), Y-feature (B), and Z-feature (C) vectors of the CASP3–ligand complexes.
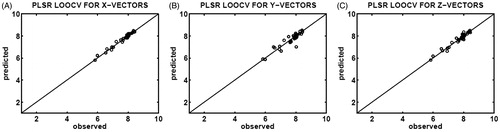
Finally, PLSR, see section “Partial Least Squares Regression”, was used for regression analysis to predict the binding affnities of the CASP3 inhibitors, utilizing the X-feature, Y-feature, and Z-feature vectors produced by SFFS method. Correlations between the observed (x-axis) and predicted (y-axis) binding affinities obtained by the PLSR determination of the leave-one-out cross-validation are illustrated in for the X-feature, Y-feature, and Z-feature vectors, respectively. The X-feature vectors possessing an RMSE of 0.1097 and an R2 of 0.9717 are found to be more informative as compared to the Y-feature vectors with an RMSE of 0.2576 and an R2 of 0.8429, and Z-feature vectors RMSE of 0.1562 and an R2 of 0.9422.
Figure 4. Correlation plots of the observed (x-axis) and predicted (y-axis) binding affinities (pIC50) constructed upon PLSR determination of leave-one-out cross-validation (LOOCV), using 35 different testing sets selected from the X-feature (A), Y-feature (B), and Z-feature (C) vectors of the CASP3–ligand complexes.
In terms of CIFAP-2, all the aforementioned regression models presented in this section provide more valuable information with the X-feature vectors of the CASP3 inhibitors. lists the observed binding affinities (pIC50) of 35 CASP3 inhibitors published by Wang et al.Citation20 and the predicted binding affinities obtained by PLSR, SVR, and ANFIS determination of leave-one-out cross-validation of the X-feature vectors. As compared to both the SVR (RMSE = 0.1488) and ANFIS (RMSE = 0.5299) determination of leave-one-out cross-validation, it is clearly seen in that predicted pIC50 obtained by PLSR (RMSE = 0.1097) determination of leave-one-out cross-validation are in better agreement with the experimental binding affinities. The PLSR determination of the leave-one-out cross-validation using the X-feature vectors provided the best correlation during the evaluation of the X-feature vectors, giving rise to a R2 value of 0.9717, while the other two regression models SVR (R2 = 0.9476) and ANFIS (R2 = 0.3347) yielded lower R2 values.
We determined here that CIFAP-2 performs better with the X-feature vectors of the CASP3 inhibitors as compared to CIFAP [1]. CIFAP possesses some drawbacks. CIFAP uses an irreversible feature selection method, called SFS, having a risk of selecting less relevant features while filtering out more relevant features. In addition, CIFAP possesses exhaustive non-linear prediction methods such as SVR and ANFIS, consuming excessive time for predictive model construction and parameter optimization. The PLSR prediction algorithm utilized in CIFAP-2 is more advantageous than the prediction methods used in CIFAP in that PLSR produces a highly correlated predictive model and saves up a substantial amount of computational time.
As a result, the X-images seem a better choice for predicting binding affnities of recently developed isatine sulfonamide derivatives that inhibit CASP3. Although the coordinate system and the angular view may vary from one system to another, the X-images are assigned here as the best shots of information to be used by the CIFAP-2 algorithm as far as the CASP3–ligand complexes are concerned.
Here, the ANFIS method was not found to produce reliable predictions for any of the X-feature, Y-feature, and Z-feature vectors. Nevertheles, both the PLSR and SVR methods produce lower RMSE and higher R2 for the X-feature vectors. All the models generated by PLSR and SVR methods are found to be predictive since they satisfy the first criteron of TropshaCitation34, which is > 0.5 for the leave-one-out cross-validation. Besides the better results of PLSR, the fast implementation of PLSR approves the fact that the utilization of PLSR for the X-feature vectors is superior to the SVR and ANFIS methods. Therefore, PLSR is the preferred method here for predicting the binding affinities of CASP3 inhibitors by CIFAP-2 as well as the development of novel ligands derived from an isatine sulfonamide pharmacophore.
Conclusion
Applicability of CIFAP-2, an improved version of a previously reported data representation model CIFAPCitation12, by analysis of 3D electrostatic maps for protein–ligand complexes is proposed and exemplified here to be succesful on predicting binding affinities of CASP3–ligand systems. The CIFAP-2 algorithm possesses two sequential phases. The first phase is the data modeling phase, which involves modeling the 3D structure of the binding site of a receptor–ligand complex into 2D images and selecting relevant features from 2D images to form feature vectors. The second phase is the prediction phase, which involves predicting binding affinities by using the 2D images.
In order to test CIFAP-2, CASP3 protein complexes along with its published 35 inhibitors possessing a common isatine sulfonamide pharmacophoreCitation20,Citation25 were selected. In the first phase, all inhibitors were docked into the protein based on the isatine sulfonamide pharmacophore with the lowest RMSE of superposition with that of the X-ray coordinates of Compound 1 in complex with CASP3, PDB ID: 1GFWCitation26. The binding interaction sites were then isolated in the form of electrostatic potential grid cubes. The resulting cubes were compressed into 2D images by summing up the sequential grid-point values in orthogonal directions. The resulting three 2D images contained average electrostatic potential values in each pixels. In the second phase of CIFAP-2, feature selection was applied by extracting the most correlative pixels from the resulting 2D images in order to eliminate redundant variables that make it difficult to predict the binding affinity. The feature selection phase gave rise to more informative pixel values around the surface of the ligand. The prediction phase tested the performance of the data model by applying promising prediction methods of machine.
CIFAP-2 utilizes SFFS (as a replacement of SFS used in CIFAP) for feature selection in the first phase and PLSR (as a replacement of ANFIS and SVR as in CIFAP) for prediction in the second phase. As expected, the PLSR method used by CIFAP-2 gave rise to a linear correlation between predicted and experimental binding affinities. ANFIS, which is a rule based system using fuzzy relations and neural networks, was found out to be complicated for addressing the relation between the compressed binding site images and the binding affinities. Meanwhile, SVR was also found to be a successful predictor although it was outperformed by PLSR.
It was found that feature vectors generated from X-images gave rise to better correlations with experimental binding affinities as compared to Y-images and Z-images. Moreover, the X-feature vectors produced by the SFFS method provide more significant information at the margins of the binding interface. The PLSR determination of leave-one-out cross-validation was found to be the most successful prediction method, working best on the X-feature vectors of the CASP3–ligand complexes. The SVR determination of leave-one-out cross-validation of the X-feature vectors of the CASP3–ligand complexes may perhaps be regarded as a less promising method as compared to the PLSR method. Finally, ANFIS determination of leave-one-out cross-validation failed to reliably predict binding affinities for the CASP3–ligand complexes. Therefore, it is suggested that the PLSR implementation of leave-one-out cross-validation should be the best choice of prediction method for CIFAP-2 development of novel isatin sulfonamide carrying inhibitors of CASP3.
We think that it is yet early to generalize the application of the SFFS implementation of the feature selection step in CIFAP-2 on all kinds of receptor–ligand systems as CIFAP-2 was only tested to work on the aforementioned 35 CASP3–ligand complexes. Nevertheless, the SFFS implemention of CIFAP-2 could be the first choice to apply on other receptor–ligand systems while other linear and non-linear regression methods should also be tried in order to compare and determine the most suitable method that lead to optimal RMSE and R2 values in prediction.
In this study, a pharmacophore-based docking algorithm was applied to dock 35 isatine sulfonamide pharmacophore derivatives into the binding site of the CASP3, assuming that the pharmacophore of all ligands possesses binding coordinates very similar to that of the X-ray coordinates of compound 1, PDB ID: 1GFWCitation26. Unfortunately, except for Compound 1, there are currently no X-ray structures for the rest of the isatine sulfonamide derivatives in complex with CASP3. Therefore, we are unable to make a comparison between the docked and empirical coordinates of the 34 CASP3–ligand complexes. Also, it has not been tested so far how RMSE values would differ if different docked conformations of CASP3 inhibitors are used. Nevertheless, the docked coordinates of the 35 bound CASP3 inhibitors studied here resulted in the best predicted values in agreement with empirical pIC50 values.
Supplementary figure available online
Supplementary Figure S1.
Supplemental Material.pdf
Download PDF (86.6 KB)Acknowledgements
We would like to thank the TR-Grid e-Infrastructure of Turkey for allowing us to use the computational facility therein.
Declaration of interest
The study is funded by The Scientific and Technological Research Council of Turkey (TUBITAK), 2211 National PhD Scholarship Programme.
References
- Herrling PL. The drug discovery process. In: Imaging in drug discovery and early clinical trials. Springer; 2005:1–14
- Jacob L, Vert J-P. Protein-ligand interaction prediction: an improved chemogenomics approach. Bioinformatics 2008;24:2149–56
- Liu Y. Drug design by machine learning: ensemble learning for qsar modeling. In: Proceedings of the Fourth International Conference on Machine Learning and Applications. Los Angeles (CA): IEEE Computer Society; 2005:187–93
- Burbidge R, Trotter M, Buxton B, Holden S. Drug design by machine learning: support vector machines for pharmaceutical data analysis. Comput Chem 2001;26:5–14
- Deng W, Breneman C, Embrechts MJ. Predicting protein-ligand binding anities using novel geometrical descriptors and machine-learning methods. J Chem Inf Model 2004;44:699–703
- Amini A, Shrimpton PJ, Muggleton SH. A general approach for developing system-specific functions to score protein-ligand docked complexes using support vector inductive logic programming. Proteins 2007;69:823–31
- Li S, Xi L, Wang C, et al. A novel method for protein-ligand binding affinity prediction and the related descriptors exploration. J Comput Chem 2009;30:900–9
- Ballester PJ, Mitchell JBO. A machine learning approach to predicting protein-ligand binding affinity with applications to molecular docking. Bioinformatics 2010;26:1169–75
- Saghaie L, Shahlaei M, Madadkar-Sobhani A. Application of partial least squares and radial basis function neural networks in multivariate imaging analysisquantitative structure activity relationship: study of cyclin dependent kinase 4 inhibitors. J Mol Graphics Modell 2010;29:518–28
- Breiman L. Bagging predictors. Mach Learn 1996;24:123–40
- Alberts B, Johnson A, Lewis J. Molecular biology of the cell. New York: Garland Science; 2002:125–93
- Erdas O, Andac CA, Gurkan-Alp AS, et al. Compressed images for affinity prediction (CIFAP): a study on predicting binding affinities for checkpoint kinase 1 protein inhibitors. J Chemometr 2013;27:155–64
- Whitney AW. A direct method of nonparametric measurement selection. IEEE Trans Comput 1971;100:1100–3
- Drucker H, Burges CJC, Kaufman L, et al. Support vector regression machines. Adv Neural Info Proces Syst 1996;6:155–61
- Jang J-SR. Anfis: adaptive-network-based fuzzy inference systems. IEEE Transactions on systems, man, and cybernetics, Part B: Cybernetics 1993;23:665–85
- Pudil P, Novovicová J, Kittler J. Floating search methods in feature selection. Patt Recogn Lett 1994;15:1119–25
- Marill T, Green D. On the effectiveness of receptors in recognition systems. IEEE Trans Informat Theory 1963;9:11–17
- Fang B, Boross PI, Tozser J, Weber IT. Structural and kinetic analysis of caspase-3 reveals role for s5 binding site in substrate recognition. J Mol Biol 2006;360:654–66
- Harrington HA, Ho KL, Ghosh S, Tung KC. Construction and analysis of a modular model of caspase activation in apoptosis. Theor Biol Med Model 2008;5:26
- Wang Q, Mach RH, Reichert DE. Docking and 3d-qsar studies on isatin sulfonamide analogues as caspase-3 inhibitors. J Chem Inf Model 2009;49:1963–73
- Weber IT, Fang B, Agniswamy J. Caspases: structure-guided design of drugs to control cell death. Mini Rev Med Chem 2008;8:1154–62
- Lee D, Long SA, Murray JH, et al. Potent and selective nonpeptide inhibitors of caspases 3 and 7. J Med Chem 2001;44:2015–26
- Chu W, Zhang J, Zeng C, et al. N-benzylisatin sulfonamide analogues as potent caspase-3 inhibitors: synthesis, in vitro activity, and molecular modeling studies. J Med Chem 2005;48:7637–47
- Chu W, Rothfuss J, d'Avignon A, et al. Isatin sulfonamide analogs containing a michael addition acceptor: a new class of caspase 3/7 inhibitors. J Med Chem 2007;50:3751–5
- Hasegawa K, Funatsu K. New description of protein-ligand interactions using a spherical self-organizing map. Bioorg Med Chem 2012;20:5410–15
- Lee D, Long SA, Adams JL, et al. Potent and selective nonpeptide inhibitors of caspases 3 and 7 inhibit apoptosis and maintain cell functionality. J Biol Chem 2000;275:16007–14
- Accelrys Software Inc., Discovery Studio Modeling Environment, Release 1.7, San Diego: Accelrys Software Inc. Available from: http://www.accelrys.com/ [last accessed 15 Jul 2014]
- Sanner MF. Python: a programming language for software integration and development. J Mol Graph Model 1999;17:57–61
- Trott O, Olson AJ. Autodock vina: improving the speed and accuracy of docking with a new scoring function, effcient optimization and multithreading. J Comp Chem 2010;31:455–61
- Morris GM, Huey R, Lindstrom W, et al. Autodock4 and autodocktools4: automated docking with selective receptor flexiblity. J Comput Chem 2009;16:2785–91
- MATLAB. version 7.12 (R2011a). The MathWorks Inc., Natick, Massachusetts, 2011
- Chatterjee S, Hadi AS. Regression analysis by example. John Wiley & Sons; 2006
- Picard R, Cook D. Cross-validation of regression models. J Am Stat Assoc 1984;79:575–83
- Golbraikh A, Tropsha A. Beware of q2! J Mol Graph Model 2002;20:269
- Tropsha A, Gramatica P, Gombar VK. The importance of being earnest: validation is the absolute essential for successful application and interpretation of qspr models. QSAR & Comb Sci 2003;22:69–77