
Abstract
Background and purpose — Unloading alters the thickness of joint cartilage. It is unknown, however, to what extent unloading leads to a loss of glycosaminoglycans (GAGs) in the cartilage tissue. We hypothesized that muscle forces, in addition to axial loading, are necessary to maintain the joint cartilage GAG content of the knee and the upper and lower ankle.
Patients and methods — The HEPHAISTOS orthosis was worn unilaterally by 11 men (mean age 31 (23–50) years old) for 56 days. The orthosis reduces activation and force production of the calf muscles while it permits full gravitational loading of the lower leg. MRI measurements of the knee and ankle were taken before the intervention, during the intervention (on day 49), and 14 days after the end of the intervention. Cartilage segmentation was conducted semiautomatically for the knee joint (4 segments) and for the upper (tibio-talar) and lower (subtalar) ankle joints (2 segments each). Linear mixed-effects (LME) models were used for statistical analysis.
Results — 8 volunteers completed the MRI experiment. In the lower ankle joint, differences in ΔT1 were found between the end of the intervention and 14 days after (p = 0.004), indicating a decrease in GAG content after reloading. There were no statistically significant differences in ΔT1 values in the knee and upper ankle joints.
Interpretation — Our findings suggest that in addition to gravitational load, muscular forces affect cartilage composition depending on the local distribution of forces in the joints affected by muscle contraction.
Unloading has been shown to cause a decrease in cartilage thickness (CitationVanwanseele et al. 2002a, b, CitationHinterwimmer et al. 2004, CitationEckstein et al. 2006, CitationLiphardt et al. 2009, CitationWang et al. 2010) and is thought to lead to a loss of glycosaminoglycans (GAGs) in cartilage tissue (CitationBashir et al. 1996, 1999). Reduced GAG content may be interpreted as an early sign of cartilage degeneration (CitationBashir et al. 1996). Cartilage is known to be sensitive to mechanical strain, but it is unclear how far axial loading, shear forces, and the pull of the muscles on bone contribute to the adaptation of joint cartilage GAG content to unloading.
To investigate the effects of selective muscular unloading during normal gravitational load on the lower limb, the HEPHAISTOS orthosis was developed and tested in an ambulatory clinical interventional study (the HEP study). During walking and standing, the orthosis substantially reduces the activation of the calf muscles and the production of force on the forefoot in the plantar direction, while it permits full gravitational loading of the ankle joint and the lower leg (CitationWeber et al. 2013a). It has been shown that muscle contractions have a key role in generation of strain in bone during locomotion, and are therefore crucial for mechano-adaptation of bone (CitationRittweger 2008).
Increased joint cartilage thickness, as found in athletes (Eckstein 2014), improves cushioning and protects against wear-off. Cartilage thickness is known to depend on both mechanical and biochemical factors (CitationNiehoff et al. 2011).
We investigated the effects of chronically reduced forces produced by the plantar flexors, in combination with normal axial weight loading, on joint cartilage. The unique feature of the study was that the orthosis enabled us to reduce muscular forces while keeping gait and load normal. Delayed gadolinium-enhanced MRI of cartilage (dGEMRIC) was chosen to assess changes in the cartilage tissue (CitationBashir et al. 1996, 1997, 1999, CitationBurstein et al. 2001). We used a standard MRI hardware protocol for dGEMRIC imaging. This protocol has been applied to knee joint cartilage in a large number of studies (CitationBashir et al. 1996, 1997, 1999, CitationBurstein et al. 2001, CitationMayerhoefer et al. 2010) and to the upper ankle joint in only a few studies so far (CitationDomayer et al. 2010, CitationWiewiorski et al. 2013). dGEMRIC measurements of the lower ankle joint have not been published before, probably because they are technically more demanding.
We hypothesized that a chronic reduction of plantar flexion forces would result in a reduction in GAG content in the cartilage of the ankle joints and the knee. We also hypothesized that joints that are normally loaded to a higher degree by calf muscle contraction would react on calf muscle unloading to a greater extent than those joints that are less influenced by calf muscle contractions. Thus, effects would be expected to be greatest in the lower ankle joint followed by the upper ankle joint. Only small effects, if any, would be expected in the knee joint.
Material and methods
Study setting
The HEPHAISTOS study (HEP study) was conducted at the German Aerospace Center in Cologne, Germany, and is registered at www.clinicaltrials.gov (identifier: NCT01576081). It was approved by the Ethics Committee of the Northern Rhine Medical Association (Ärztekammer Nordrhein, Düsseldorf, Germany, no. 2010169). Out of 11 men (mean age 31 (23–50) years) who wore the orthosis unilaterally for 56 days, 8 completed the MRI experiment presented here. 2 volunteers had to be excluded from further MRI measurements after showing symptoms of contrast-agent intolerance and 1 refused to participate in the MRI measurements. The study protocol and details of the organization, schedule, and methods of the HEP study have already been published by CitationWeber et al. (2013a).
The HEPHAISTOS orthosis
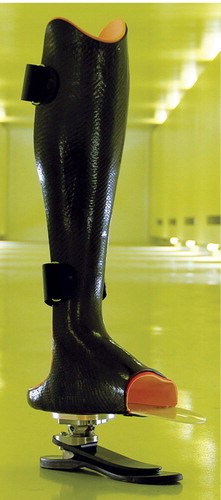
The orthosis causes unloading of the calf muscles while permitting a near to normal gait, thus maintaining full impact of the body mass on the ankle and the lower leg (). It substantially reduces plantar flexor torque and muscle activation (measured by electromyography), and it affects arterial diameter (measured by ultrasound) (CitationWeber et al. 2013a, b,2014). When the orthosis is worn, normal movement in the knee joint is possible. Flexion and extension are limited in the upper ankle joint, while supination and pronation of the lower ankle joint are not possible. Tibio-talar forces are reduced by three-quarters, while femoro-tibial forces are unaltered when wearing HEPHAISTOS. Force development of the gastrocnemius muscle and its pull on the calcaneus through the Achilles tendon are reduced by the absence of counter-forces on the forefoot (unpublished observations). The mechanical role of the ankle during walking is taken over by a metallic joint below the foot with an integrated spring that replaces the role of the calf muscle. To investigate the influence of the orthosis on joint cartilage, we analyzed the knee joint and the upper (tibio-talar) and lower (subtalar) ankle joints. The orthosis was manufactured individually for each subject by ORTEMA GmbH (Markgröningen, Germany). The volunteers had to wear the HEPHAISTOS orthosis for 56 days, during all locomotive activities that required loading of the leg. The following link leads to the webpage of the DLR with a video clip presenting the HEPHAISTOS unloading orthosis: http://www.dlr.de/me/en/desktopdefault.aspx/tabid-7389/12432_read-35410/.
Figure 1. The HEPHAISTOS orthosis.
The dGEMRIC protocol
MRI scans were done according to the dGEMRIC protocol (CitationMayerhoefer et al. 2010). Each volunteer underwent MRI scans of the ankle and knee of the intervention leg before the intervention (BDC), on day 49 of the intervention (HEP49), and 14 days after the end of the intervention phase (R+14). Each time, MRI scans were performed before and after intervenous administration of the gadolinium-based contrast agent Gd-DOTA (Dotarem; gadoteric acid, 0.4 mg per kg body mass).
MRI
MRI scans of the ankle and the knee were obtained with a knee coil in a 3T MRI scanner (Achieva; Philips Medical Systems). Measurements were taken with 2 flip angles of 5° and 25°, and calculations were performed according to CitationMayerhoefer et al. (2010). Signal intensities were calculated for each pixel and intensities were corrected from a B1-map (map of relative pulse angles). Scaling of maps was adjusted and T1 was calculated pixel-wise. Each ankle measurement was planned with a series of cross-sectional images based on sagittal pilot images. From the ankle, 2 individual slices were analyzed with a 160 × 160 mm field of view, an acquisition matrix of 704 × 704 pixels, and 3 mm slice thickness. From the knee, 2 individual slices were analyzed with a 160 × 160 mm field of view, an acquisition matrix of 560 × 560 pixels, and 3 mm slice thickness.
Calculation of ΔT1 values and segmentation
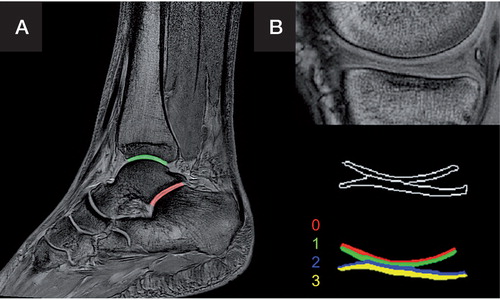
Segmentation was performed semiautomatically for the areas shown in . This means that a ROI was first set manually, and a threshold algorithm was applied to the selected region before the cartilage region was defined by region-growing. The knee joint cartilage was subdivided into 4 segments of equal height for analysis. For the ankle joints, a proximal segment and a distal segment of equal height were selected. The ankle joint cartilage was not thick enough for the analysis of more subsegments in the resolution available.
Figure 2. Segmentation of the upper (green) and lower (red) ankle joint (articulatio subtalaris) with a distal and a proximal segment each (panel A), and the knee joint (segments 0–3) (panel B).
Statistics
IBM SPSS Statistics release 20.0.0 was used to calculate linear mixed-effects (LME) models with segment, measurement, and their interaction as fixed effects and subjects as a random effect (variance components). Significance was assumed at p < 0.05. The assumptions made were a normal distribution of the raw data and the residuals. The Kolmogorov-Smirnov test showed a normal distribution of ΔT1 values in the cartilage of the upper ankle joint (p = 0.6, residuals p = 0.9), the lower ankle joint (p = 0.8, residuals p = 0.6), and the knee (p = 0.9, residuals p = 0.4). Data are presented as counts with their SD. Exclusion conditions were ΔT1 times of < 400 ms and > 1,500 ms. SigmaPlot software version 12.0 was used to plot data. ΔT1 was the primary outcome measure of this study. An increase in ΔT1 corresponded to a decrease in the GAG content.
Results
An overview of average ΔT1 values for each site and each measurement is provided in . Further details are shown in .
Figure 3. ΔT1 values in the course of the study, in each joint for each volunteer. The baseline measurement was taken before the intervention (baseline data collection, BDC), the second measurement was on day 49 of the intervention (HEPHAISTOS, HEP49), and the third measurement was 14 days after the end of the intervention (recovery, R+14). ΔT1 indicates the GAG content (lower ΔT1 values reflect higher GAG content).
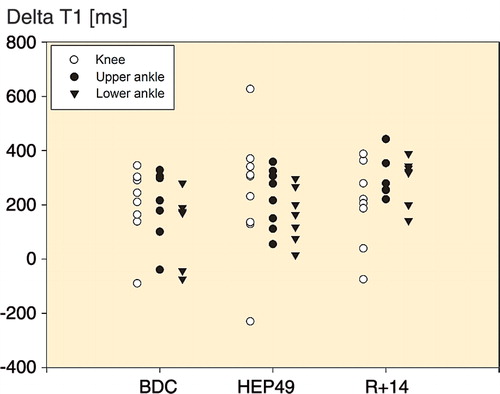
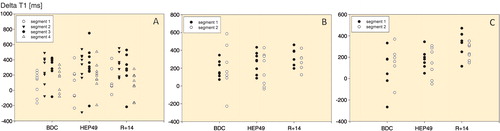
Figure 4. ΔT1 values of the separate segments of the knee joint (A), the upper ankle joint (B) and the lower ankle joint (C) in the individual volunteers throughout the course of the study. In the knee joint, values differ significantly among segments (p < 0.001). ΔT1 indicates the GAG content (lower ΔT1 values reflect higher GAG content).
The knee joint
The LME model revealed a significant difference in ΔT1 values between segments (p < 0.001) but no statistically significant difference between measurements, either for the entire knee cartilage (p = 0.5) or for the interaction with the individual segments (p = 0.9). Throughout the study, cartilage closer to the bone had lower ΔT1 values than cartilage further away from the bone.
The upper ankle joint
There was no statistically significant difference between the ΔT1 values of the 2 segments (proximal and distal, p = 0.4) or between measurements (p = 0.2). The interaction between segment and measurement was not significant either (p = 0.7).
The lower ankle joint
We found a difference in ΔT1 values between measurements, with higher ΔT1 after the intervention than before (p = 0.004). The effect occurred after reloading. ΔT1 values were similar when comparing the proximal and distal segment (p = 0.7), and no statistically significant differences could be found when we analyzed the interaction between segment and measurement (p = 0.2).
Discussion
The HEPHAISTOS orthosis makes it possible to investigate the effects of widely inactive lower leg muscles during normal gravitational load patterns as experienced in everyday life, without any substantial change in gravitational and mass-inertial skeletal forces (CitationWeber et al. 2013a). Our main findings were as follows. (1) A decrease in GAG content of the lower ankle (subtalar) joint cartilage was found to occur not during the intervention, but after reloading. (2) Axial load alone was sufficient to maintain the cartilage GAG content of the upper ankle joint. The GAG content of the knee joint cartilage was not affected either. (3) The dGEMRIC method can be applied to the lower ankle joint.
Observations in the literature
The dGEMRIC protocol was initially developed to assess the glycosaminoglycan content of knee joint cartilage (CitationBashir et al. 1996, 1997, 1999, CitationBurstein et al. 2001). The dGEMRIC method was recently applied to the upper ankle joint (CitationDomayer et al. 2010, CitationWiewiorski et al. 2013). To our knowledge, the dGEMRIC method has not been applied to the lower ankle joint before, probably because the cartilage is thin and segmentation is technically difficult. We found that the dGEMRIC protocol can be used to assess relative changes in the GAG content of the lower ankle joint, which may be of interest for research in foot and ankle surgery as well as for rheumatology.
Unloading has been shown to reduce cartilage thickness (CitationEckstein et al. 2014). By analyzing MRI images taken before and after 14 days of 6° head down tilt bed rest in human subjects, CitationLiphardt et al. (2009) showed that the articular knee cartilage thickness is sensitive to unloading. They found a substantial decrease in thickness of the tibial knee joint cartilage but not in the thickness of femoral knee joint cartilage. CitationWang et al. (2010) performed a 4-week tail suspension study on rats and found decreases in cartilage thickness of the patella and the medial femoral condyle. CitationVanwanseele et al. (2002a, b) found progressive thinning of the knee cartilage in patients with spinal cord injuries. CitationHinterwimmer et al. (2004) showed thinning of articular cartilage already after 7 weeks of partial load bearing. Regarding cartilage thickness, changes were usually found to occur throughout unloading and not after reloading.
CitationMayerhoefer et al. (2010) analyzed the effect of 15 min of unloading of the knee joint on T1-Gd with the dGEMRIC method and found that there was no statistically significant effect on T1-Gd relaxation times. Long-term unloading of human joint cartilage has not, however, been investigated previously with this method. The effects of selective muscular unloading on joint cartilage during normal weight bearing had also not been investigated before our study. One might think that the GAG content decreases during unloading, just as cartilage thickness has been shown to decrease. Our results, however, indicate that a decrease in glycosaminoglycan content may occur after reloading following muscular inactivation, depending on the joint location and the type of immobilization. It remains unclear, however, whether reloading causes remodeling or whether remodeling is just delayed and takes a while to occur. Other studies have shown changes in GAG content in cartilage tissue to occur within a few weeks (Roos et al. 2005, Van CitationGinckel et al. 2010). However, the timing of changes in joint cartilage GAG content remains unclear. Increased ΔT1 is thought to be correlated with reduced glycosaminoglycan content, and it is usually interpreted as a sign of early degeneration (CitationBashir et al. 1996, 1999). Our findings indicate that degeneration of joint cartilage might in some cases follow reloading after a longer period of unloading. Future studies in this field should therefore include a follow-up period after reambulation.
Possible reasons for asymmetrical findings
HEPHAISTOS unloads the ankle, but not the knee. When the orthosis is worn, normal movement is possible in the knee joint while flexion and extension are limited in the upper ankle joint and supination and pronation are not possible in the lower ankle joint. The subtalar joint has an angle of 30–40° to the horizontal line. Supination and pronation are the possible movements of the subtalar joint, and both are made impossible while wearing HEPHAISTOS. The subtalar joint is therefore almost completely immobilized by the orthosis, while the upper ankle joint is only partially restricted (extension and flexion of the ankle) and the knee joint is not restricted at all. Furthermore, tibial forces are known to load eccentrically on the calcaneus, leading to torque and shear stresses in the joint. Forces are not distributed homogenously throughout the articular surface of the subtalar joint (CitationMueller et al. 2014). In cases in which the stabilizing muscles were atrophied after the intervention, shear stresses may have exceeded their normal extent and led to cartilage impairment.
Clinical relevance of our findings
Considering our results, a reduction in the GAG content of cartilage following reloading after cast immobilization and after nonoperative treatment of conditions such as Achilles tendon ruptures appears to be possible and should be investigated further. The same effects may also follow immobilization in an external fixator. The findings may fuel the ongoing discussions for or against nonoperative and operative treatment options in a number of conditions (CitationCohen and Balcom 2003, CitationJiang et al. 2012). For these considerations, it would be of interest to know how long the reduction in GAGs lasts, how its timely development takes place, and the degree to which it is reversible. Furthermore, it is important to identify joints that are particularly vulnerable and unloading patterns that prevent changes in cartilage.
BG: analysis and interpretation of the data, drafting of the article, and assembly of data. JZ: conception and design, and analysis and interpretation of the data. TW: organization of study and recruitment of subjects. RPF: segmentation and data processing. BWJ: statistical analysis. MH: technical support (MRI) and radiology expertise. JR: obtaining of funding, and conception and design. PE: administrative support. TK: conception and design, and collection of data.
We thank the volunteers for participating willingly in the study. Special thanks to Jonas Reck who helped to organize the experiments.
No competing interests declared.
- Bashir A, Gray ML, Burstein D. Gd-DTPA2- as a measure of cartilage degradation. Magn Reson Med 1996; 36 (5): 665-73.
- Bashir A, Gray ML, Boutin RD, Burstein D. Glycosaminoglycan in articular cartilage: in vivo assessment with delayed Gd(DTPA)(2-)-enhanced MR imaging. Radiology 1997; 205 (2): 551-8.
- Bashir A, Gray ML, Hartke J, Burstein D. Nondestructive imaging of human cartilage glycosaminoglycan concentration by MRI. Magn Reson Med 1999; 41 (5): 857-65.
- Burstein D, Velyvis J, Scott KT, Stock KW, Kim YJ, Jaramillo D et al. Protocol issues for delayed Gd(DTPA)(2-)-enhanced MRI (dGEMRIC) for clinical evaluation of articular cartilage. Magn Reson Med 2001; 45: 36-41.
- Cohen RS, Balcom TA. Current treatment options for ankle injuries: lateral ankle sprain, Achilles tendonitis, and Achilles rupture. Curr Sports Med Rep 2003; 2 (5): 251-4.
- . Domayer SE, Trattnig S, Stelzeneder D, Hirschfeld C, Quirbach S, Dorotka R et al. Delayed gadolinium-enhanced MRI of cartilage in the ankle at 3 T: feasibility and preliminary results after matrix-associated autologous chondrocyte implantation. J Magn Reson Imaging 2010; 31 (3): 732-9.
- Eckstein F, Hudelmaier M, Putz R. The effects of exercise on human articular cartilage. J Anat 2006; 208: 491-512.
- Eckstein F, Boeth H, Diederichs G, Wirth W, Hudelmaier M, Cotofana S et al. Longitudinal change in femorotibial cartilage thickness and subchondral bone plate area in male and female adolescent vs. mature athletes. Ann Anat 2014; 196 (2-3): 150-7.
- Hinterwimmer S, Krammer M, Kroetz M, Glaser C, Baumgart R, Reiser M et al. Cartilage atrophy in the knees of patients after seven weeks of partial load bearing. Arthritis Rheum 2004; 50 (8): 2516-20.
- Jiang N, Wang B, Chen A, Dong F, Yu B. Operative versus nonoperative treatment for acute Achilles tendon rupture: a meta-analysis based on current evidence. Int Orthop 2012; 36 (4): 765-73.
- Liphardt AM, Mündermann A, Koo S, Baecker N, Andriacchi TP, Zange J et al. Vibration training intervention to maintain cartilage thickness and serum concentrations of cartilage oligometric matrix protein (COMP) during immobilization. Osteoarthritis Cartilage 2009; 17 (12): 1598-603.
- . Mayerhoefer ME, Welsch HG, Mamisch TC, Kainberger F, Weber M, Nemec S et al. The in vivo effects of unloading and compression on T1-Gd (dGEMRIC) relaxation times in healthy articular knee cartilage at 3.0 Tesla. Eur Radiol 2010; 20: 443-449.
- Mueller F, Hoechel S, Klaws J, Wirz D, Mueller-Gerbl M. The subtalar and talonavicular joints: a way to access the long-term load intake using conventional CT-data. Surg Radiol Anat 2014; 36 (5): 463-72.
- Niehoff A, Müller M, Brüggemann L, Savage T, Zaucke F, Eckstein F et al. Deformational behaviour of knee cartilage and changes in serum cartilage oligometric matrix protein (COMP) after running and drop landing. Osteoarthritis Cartilage 2011; 19 (8): 1003-10.
- Rittweger J. Ten years muscle-bone hypothesis: what have we learned so far?-almost a festschrift-. J Musculoskelet Neuronal Interact 2008; 8 (2): 174-8.
- Roos EM, Dahlberg L. Positive effects of moderate exercise on glycosaminoglycan content in knee cartilage: a four-month, randomized, controlled trial in patients at risk of osteoarthritis. Arthritis Rheum 2005; 52(11): 3507-14.
- Vanwanseele B, Eckstein F, Knecht H, Stussi E, Spaepen A. Knee cartilage of spinal cord-injured patients displays progressive thinning in the absence of normal joint loading and movement. Arthritis Rheum 2002a; 46: 2073-8.
- Vanwanseele B, Lucchinietti E, Strussi E. The effects of immobilization on the characteristics of articular cartilage: current concepts and future directions. Osteoarthritis Cartilage 2002b; 10: 408-19.
- Van Ginckel A, Baelde N, Almqvist KF, Roosen P, McNair P, Witvrouw E. Functional adaptation of knee cartilage in asymptomatic female novice runners compared to sedentary controls. A longitudinal analysis using delayed Gadolinium Enhanced Magnetic Resonance Imaging of Cartilage (dGEMRIC). Osteoarthritis Cartilage 2010; 18(12): 1564-9.
- Wang Q, Zheng YP, Wang XY, Huang YP, Liu MQ, Wang SZ et al. Ultrasound evaluation of site-specific effect of simulated microgravity on articular cartilage. Ultrasound Med Biol 2010; 36 (7): 1089-97.
- Weber T, Ducos M, Mulder E, Herrera F, Brüggemann GP, Bloch W et al. The specific role of gravitational accelerations for arterial adaptations. J Appl Physiol 2013a; 114 (3): 387-93.
- . Weber T, Ducos M, Yang P-F, Jos D, Frings-Meuthen P, Brüggemann G-P et al. The HEPHAISTOS study: Compliance, adherence and rehabilitation with a novel orthotic device for calf muscle silencing. J Musculoskelet Neuron Interact 2013b; 13 (4): 487-495.
- Weber T, Ducos M, Mulder E, Beijer A, Herrera F, Zange J et al. The relationship between exercise-induced muscle fatigue, arterial blood flow and muscle perfusion after 56 days local muscle unloading. Clin Physiol Funct Imaging 2014; 34 (3): 218-29.
- Wiewiorski M, Miska M, Kretzschmar M, Studler U, Bieri O, Valderrabano V. Delayed gadolinium-enhanced MRI of cartilage of the ankle joint: results after autologous matrix-induced chondrogenesis (AMIC)-aided reconstruction of osteochondral lesions of the talus. Clin Radiol 2013; 68 (10): 1031-8.