Abstract
Objective:
Cost-analysis comparing darbepoetin-alfa (DARB), epoetin-alfa (EPO-A), and epoetin-beta (EPO-B) for treatment of chemotherapy-induced anemia in Belgium concluded that costs for DARB-treated patients were significantly lower than costs for EPO-A- or EPO-B-treated patients. The objective of the present study was to extend the Belgian analysis to Austria, France, Italy, Portugal, and Spain, estimating differences in costs between erythropoiesis-stimulating agents (ESAs) in each country.
Methods:
Differences in epidemiology and treatment patterns between countries were adjusted using data from Eurostat, national cancer registries, IMS sales data, and reimbursement and treatment guidelines. Belgian unit costs were replaced with country-specific costs. Costs were analyzed using a mixed-effects model stratifying for propensity score quintiles.
Results:
All populations were comparable to the Belgian population in terms of age, gender, ESA, and blood transfusions use. After adjusting for country-specific chemotherapy use and cancer incidence, total management costs per patient (Euro, 2010) were 19–26% (France, Spain) lower with DARB compared with EPO-A (p < 0.0001) and 20–36% (Portugal, Austria) compared with EPO-B (p < 0.01). Anemia-related costs with DARB were between 12% (Portugal; p = 0.0235) and 38% (Italy; p < 0.0001) lower compared with EPO-A (p < 0.01; all remaining countries), and between 13% (Austria; p = 0.064) and 19% (Portugal; p = 0.0028) lower compared with EPO-B (p < 0.05; all remaining countries except Italy; p = 0.0935).
Limitations:
Not all differences could be accounted for by a lack of country-specific data; however, the potential under- and over-estimation of costs should be similar for all three ESAs.
Conclusions:
These findings are in line with the Belgian analysis. In all countries, total and anemia-related costs were lowest in patients receiving DARB vs EPO-A or EPO-B. This study demonstrates the feasibility of adapting real-life country-specific data to other settings, adjusting for differences in patients’ characteristics and treatment strategies. These findings should be valuable in healthcare decision-making in oncology patients treated in each of the countries studied.
Introduction
In patients with cancer, studies have shown that chemotherapy-induced anemia (CIA) and the associated fatigue have a large negative impact on patients’ daily livesCitation1–4. Erythropoiesis-stimulating agents (ESAs) are used in the treatment of CIA, with the goal of correcting inadequate hemoglobin (Hb) levels and, as indicated by the European Organization for Research and Treatment of Cancer (EORTC) guidelines in anemic patients with cancer, to improve quality-of-life (QoL)Citation5 and reduce the need for red blood cells (RBC) transfusionsCitation6. Improvements in fatigue have been observed in patients treated with ESAsCitation7. By improving the patient’s QoL (secondary to corrected Hb), treatment with ESAs may allow patients to receive the correct treatment doses of chemotherapy in a more timely fashion than patients who remain anemicCitation8–10. ESAs used for the management of anemia in patients with cancer include darbepoetin alfa (DARB), epoetin alfa (EPO-A), and epoetin beta (EPO-B).
Given the substantial financial burden associated with the treatment of patients with cancer, there is general interest in understanding the cost of treating CIA and any potential cost savings that could be achieved by using one ESA compared with another. A recent example of this was published in 2008, where Spaepen et al.Citation11 reported the results of a health economic evaluation comparing costs and outcomes of DARB, EPO-A, and EPO-B for the management of CIA in Belgium. The authors concluded that, for propensity score-matched patient profiles, anemia-related treatment costs with DARB were ∼20% lower compared with EPO-A or EPO-B from the healthcare payer perspective. The evidence suggested that patients treated with DARB required proportionately less ESAs due to shorter treatment duration than patients treated with either EPO-A or EPO-B to achieve similar outcomes. The investigators applied propensity score matching using 13 epidemiology and treatment pattern-related variables to adjust for selection bias. Propensity score matching is an established method employed to calculate unbiased estimates of treatment effects, and is often used in conjunction with observational retrospective dataCitation12–14. Only longitudinal, detailed, patient-level datasets allow for application of this methodology.
The Belgian analysis was performed using the IMS Hospital Disease Database (IMS HDD) (data from 2003–2005), which is a longitudinal database containing individual patient/admission-level data on diagnoses, procedures, and pharmaceutical productsCitation11. This database is unique to Belgium, and includes information on 46 out of 110 hospitals representing 34% of the day-clinic visits and hospital beds in Belgium. As ESAs can only be dispensed by the hospital pharmacy (including outpatient/ambulatory use), all ESA use in patients with cancer was captured. In terms of the completeness and level of detail reported, IMS HDD is comparable to the General Practice Research Database (GPRD) in the UKCitation15, although the GPRD focuses on primary care and IMS HDD on secondary care.
The objective of the present study was to extend the Belgian study to Austria, France, Italy, Portugal, and Spain in order to compare the cost of chemotherapy-induced anemia per patient treated with DARB to the cost per patient treated with EPO-A or EPO-B in each country. The recommended methodology of adjusting for baseline characteristics using propensity score matching was applied.
Methods
During February–March 2010, a search was performed among the web pages of country-specific health authorities, international and local cancer registries, and local experts to identify longitudinal databases reporting patient-level data on diagnosis, drug use, and costs in secondary care in Austria, France, Italy, Portugal, and Spain. The following selection criteria were used: patient age and gender, cancer type and stage, longitudinal follow-up of at least 1 year, anemia-related clinical events, drug and other healthcare resource use and costs. No databases with the same characteristics as the IMS HDD could be identified. This is consistent with the evidence of the database index managed by the International Society of Pharmacoeconomics and Outcomes Research (ISPOR)Citation16. An alternative approach had to be undertaken. In accordance with the indirect standardization method described by Kirkwood and SterneCitation17, by which demographic and epidemiological rates from a standard population are applied to the population under study, the Belgian data was applied to the setting of a country of interest, and differences in costs between ESAs within the different countries were evaluated.
To use the Belgian dataset, the comparability between the five country populations of interest and the Belgian population had to be established. The initial patient sample included a total of 2513 patients () (patient selection described in Spaepen et al.Citation11). Belgian costs were replaced by country-specific unit costs. Discrepancies in demographics, epidemiology, and treatment patterns were examined. The demographic and epidemiological parameters considered were general population statistics, incidence, and distribution of cancer types. The treatment pattern factors included use of ESAs, use of blood transfusions, and use of chemotherapy. The selection of the parameters was based on variables that had an impact on results in the original analysisCitation11.
Table 1. Analysis overview.
Country-specific unit costs
To account for the differences in the cost of pharmaceutical products, Belgian costs per unit were replaced at the individual product level within the original dataset with local costs for Austria, France, Italy, Portugal, and SpainCitation18–21. For other healthcare expenditure (including fixed fees for therapy administration, other procedures, and costs of hospitalization) the relative distributions of these costs in the Belgian All Patient Refined-Diagnosis Related Groups (APR-DRG) costs dataset were estimated per APR-DRG. It should be noted that, in the database, both hospital and day clinic costs were captured, meaning that all therapies administered during a full hospitalization are captured, as are therapies administered at the day clinic. In Belgium, the latter includes ESAs and intravenous chemotherapy (i.e. ambulatory chemotherapy dispensed by the hospital pharmacy). Costs were then imputed for the five countries of interest by replacing the specific Belgian cost with the local costs based on the local DRG and fee system, and by applying the relative distribution of costs of the Belgian dataset to the country-specific DRGs. DRGs were combined wherever needed, to correctly replace a Belgian APR-DRG for the latest year availableCitation22–26. Given that in France the dispensing of ESAs is divided between the hospital (14%) and the retail pharmacy setting (86%)Citation26, the costs were estimated as a weighted average of the hospital and retail costs to account for the delivery of ESA products in both settings in France.
Demographics and epidemiology
Statistics on gender and age distribution of the general population were derived from Eurostat, which provides harmonized statistical information across the member states of the European UnionCitation27. Country-specific sources were used to estimate the incidence of the different cancer types. Local sources were selected over international cancer registries as it was expected these would report more detailed and up-to-date information. The most recent epidemiological data available were derived from national cancer and public health registries for Belgium (2006)Citation28, Austria (2007)Citation29, France (2005)Citation30, Italy (2006)Citation31, Portugal (2001)Citation32, and Spain (2008)Citation33, and were classified according to the International Classification of Diseases, 10th Revision (ICD-10)Citation34. Four cancer types with significant differences between the treatment populations in the original analysis were included: hematological cancers (i.e., including all forms of leukemia (except leukemic reticuloendotheliosis and plasma cell leukemia), lymphoma, multiple myeloma, and other neoplasms of lymphoid or lymphatic tissue), female breast cancer, lung cancer, and ovarian cancerCitation11. To account for the differences in cancer incidence in the populations of interest compared with Belgium, the relative weight of these cancers in each country compared with Belgium was used to adjust the original dataset.
Treatment patterns
It was anticipated that differences in treatment patterns of patients with cancer in the different countries could influence incidence of CIA as well as the mean estimated costs in the analysis. Therefore, information on the use and reimbursement of ESAs for the treatment of CIA was compared between Belgium and each country on the basis of local clinical guidelinesCitation18,Citation35,Citation36. For the use of blood transfusions, no country-specific guidelines were identified, therefore it was assumed that the EORTC guidelines are followedCitation37.
To account for the differences in chemotherapy regimens used, a ratio of the number of chemotherapy-units (milligrams) used per cancer patient in each country was established. Data on chemotherapy use was derived from the IMS Multinational Integrated Data Analysis System (MIDAS) Quantum (2009) for Belgium, Austria, France, Italy, and Spain to adjust the original datasetCitation38. As IMS MIDAS Quantum does not record information on hospital sales in Portugal, sales data were derived from the Catálogo de Aprovisionamento Público da SaúdeCitation20. The Anatomical Classification Guidelines of Pharmaceutical Products (2010)Citation39 was used to establish the anatomical therapeutic class (ATC) corresponding to chemotherapeutical agents. Within section [L - Antineoplastic and Immunomodulating Agents] sub-sections L01 (Antineoplastics) and L02 (Cytostatic Hormone Therapy) were considered. A ratio of total annual chemotherapy consumption (in milligrams) per molecule (e.g., Austria vs Belgium) was calculated for all molecules of the L01 and L02 classes. These ratios were then used as relative weights in the Belgian dataset.
Analysis overview
Adjusting for country-specific chemotherapy use and cancer incidence, differences in total healthcare costs and anemia-related costs among the three ESAs were tested using a hierarchical mixed-effects model stratifying for propensity score quintiles, as described in Spaepen et al.Citation11. Total management costs (Euro, 2010) included the cost of pharmaceuticals (e.g., ESAs and chemotherapy costs), cost of procedures (e.g., chemotherapy administration), and the daily inpatient hospitalization cost (based on DRG costs, as described above). Anemia-related costs included the cost of ESAs, blood transfusions, and any other costs incurred during an admission for anemia, and were a sub-set of the total management costs. An overall normalized weight (including the cancer incidence ratio per country and the average chemotherapy consumption in milligrams per molecule per country) was calculated. This weighing was added to the existing propensity score matchingCitation11, which allowed for the set-up of the original analysis to be maintained, so that the country-specific results could be compared with the Belgian data.
Statistical analyses
Statistical methods were as described in the original publicationCitation11. In brief, propensity score-corrected costs were analyzed in a hierarchical mixed-effects model, with the propensity quintiles included as random effects (for treatment selection bias correction) and the three study groups (DARB, EPO-A, and EPO-B) included as fixed effects. The 13 variables used to calculate the propensity scores were: age >65 years, male sex, platinum therapy, intravenous iron use at index stay, RBC transfusion at index stay, severity index at index stay, lung cancer, breast/ovarian cancer, hematological cancer, other metastatic cancer, months on chemotherapy (index stay to end of treatment), hospital transfusion rate (proxy of hospital transfusion policy), and death within 1 month after the index stay. The weighted, least squares estimated mean and standard error (SE) of the mean of the costs were calculated per study group for each cost of interest (cost of other pharmaceuticals, ESA cost, inpatient hospitalization cost, cost of procedures, total anemia cost, and total management cost). From these models, estimates of the differences in costs between the three study groups were calculated. For each estimate, the mean and SE are presented. For differences between study groups, p-values and 95% confidence intervals (CI) are also presented. All statistical analyses were performed with SAS V8.2 (The SAS Institute, Carey, NC).
Results
The general demographic country profile revealed broad similarities between the countries analyzed and Belgium in terms of average age and gender distribution, and overall cancer incidence, as shown in . Nevertheless, as the incidence of hematologic cancers, female breast cancer, lung cancer, and ovarian cancer were four of the parameters included in the propensity score matching in the original analysisCitation11, ratios on the incidence of these cancer types in each one of the countries compared to Belgium were used to adjust the population of the original publication and reflect country-specific characteristics. These ratios are presented in . No major differences were identified regarding the reimbursement of ESAs in the different countries, which were consistently found to be in line with the requirements cited in the summary of product characteristics for ESAs. After matching, the study included a total of 2393 patients (DARB, n = 429; EPO-A, n = 1584; EPO-B, n = 380).
Table 2. Epidemiology and demographic profiles.
Table 3. Cancer incidence ratios*.
In the chemotherapy use analysis, Antineoplastics (ATC class L01) represented the majority of the Antineoplastic and Immunomodulating Agents sold, compared with Cytostatic Hormone Therapy (ATC class L02) in Belgium (97.01%), Austria (95.65%), France (96.97%), Italy (94.37%), and Spain (93.93%). In Portugal, Cytostatic Hormone Therapy represented 57.19% of the chemotherapy sales.
Country-specific costs
After adjusting for country-specific chemotherapy use and cancer incidence, total mean management costs of patients treated with DARB ranged between €7275 (Portugal) and €10,546 (Italy), costs of patients treated with EPO-A between €9270 (Portugal) and €14,063 (Italy), and costs of patients treated with EPO-B between €9057 (Portugal) and €13,776 (Austria) (). Anemia-related costs with DARB were between 12% (Portugal; p = 0.0235) and 38% (Italy; p < 0.0001) lower compared with EPO-A (p < 0.01; all remaining countries), and between 13% (Austria; p = 0.0640) and 19% (Portugal; p = 0.0028) lower compared with EPO-B (p < 0.05; all remaining countries except Italy). ESA costs were lower for patients treated with DARB compared with EPO-A (p < 0.01; all countries) or EPO-B (p < 0.05; all countries except Austria) (). The cost of ESA treatment was numerically lower with DARB compared with EPO-A or EPO-B, and the costs of other pharmaceutical products and the costs of procedures were consistently numerically lower across countries (). Differences between treatment arms and countries are summarized in .
Figure 1. Mean total management costs of patients treated with ESAs.
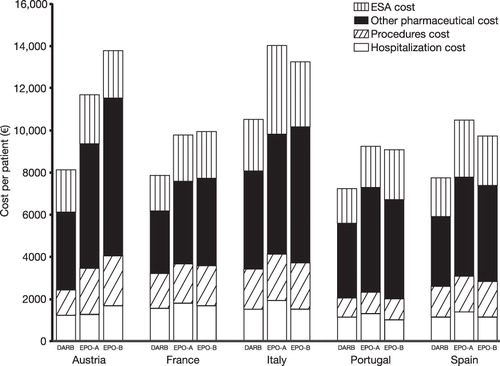
Table 4. Mean (SE) total costs and anemia-related costs (including ESAs).
Table 5. Comparison of total management costs and anemia-related costs between DARB and EPO-A or EPO-B per country.
As the original analysis concluded that the differences in costs between ESAs may have been due to the shorter treatment duration with DARB compared with EPO-A and EPO-B, the impact of country-specific adjustments on this variable has been examined in the current analysis and results are presented in . DARB remains associated with shorter treatment duration across countries (p < 0.01 vs EPO-A and EPO-B; all countries), although the absolute number of days varies by country due to different patient population weighing for each country. Mean treatment duration ranged from 40.63 days in Spain to 45.95 days in Portugal for DARB, from 53.34 days in Italy to 56.85 days in Portugal for EPO-A, and from 52.39 days in Spain to 56.19 days in Portugal for EPO-B (). Country-adjustment for population weighing had a similar impact on length of hospitalization, chemotherapy admissions, and blood transfusion use.
Table 6. Impact of country-specific adjustments on cost drivers.
Discussion
The results of the current analysis showed similar findings in Austria, France, Italy, Portugal, and Spain compared with those reported by Spaepen et al.Citation11 for Belgium: treatment of CIA is less costly with DARB compared with EPO-A and EPO-B both at the overall treatment cost level and the anemia-related cost level. While the reasons for lower costs in the DARB group are beyond the scope of this analysis, it has been previously suggested that shorter treatment duration of DARB compared with other ESAs may be a major contributing factorCitation11,Citation40. Variables, where statistically significant differences were found when comparing EPO-A or EPO-B to DARB in the Belgian population, were still found to be significantly different in the studied countries (e.g., treatment duration, length of hospitalization, and admissions for chemotherapy).
Previous research demonstrates that clinical characteristics of patients, such as baseline Hb level, are likely to influence the choice of ESAs as well as dosing and costs. In line with the ISPOR checklist for Retrospective Databases StudiesCitation41, Polsky et al.Citation42 highlighted the importance of analytical methods, such as propensity score matching, to adjust for patients’ selection bias when comparing costs on observational patient-level data. The analysis by Polsky et al.Citation42 was based on electronic medical records in two US databases and compared the cost of treatment of CIA with DARB and EPO-A. The study highlighted the importance of matching patients’ characteristics at baseline, and showed that the number of statistically significant parameters in the analysis was reduced by 83% when adjustments for Hb level were made. Polsky et al.Citation42 concluded that the cost of treatment with EPO-A was significantly higher than treatment with DARB when adjustments for baseline characteristics were made. These findings highlighted the importance of propensity score matching and were in line with the results obtained by Spaepen et al.Citation11, which are extended here for Austria, France, Italy, Portugal, and Spain, showing that costs of treatment with DARB are lower compared with EPO-A or EPO-B.
In this study, a search was performed to identify longitudinal databases reporting patient-level data in Austria, France, Italy, Portugal, and Spain. As this search did not identify databases in the countries of interest that would enable propensity-score matching analysis, the dataset from the original Belgian analysis was used. Adjustments were made to the dataset to estimate the costs of treatment of CIA in Austria, France, Italy, Portugal, and Spain, while allowing for the use of propensity-score matched dataset. Demographic profiles, as well as treatment and reimbursement guidelines, were found similar across the countries, supporting the transferability of the Belgian data to the countries of interest. Four tumor types where significant differences between the three treatment arms had been identified in the original analysis were included. Both cancer incidence and chemotherapy use influence the occurrence of chemotherapy-induced anemia and associated costs. By correcting for chemotherapy use and incidence of the four selected tumors types, adjustments were made for some of the treatment practice differences that may exist between the studied countries. The impact of the adjustments has been demonstrated on several key cost driver variables. Adjusted cost drivers varied among countries, supporting the feasibility of applying data from one country to another while adjusting for potential differences.
Retrospective databases can offer a number of advantages over prospective clinical trials when conducting outcomes research studies. Some of these include representativeness of the data in a real-life setting, reduced cost and faster access to data, and no reliance on protocol-driven events and resource useCitation43. However, with this in mind, it is important to consider the results of this analysis in light of the fact that no comparable databases (to Belgium) were identified in any of the countries of interest. It was not possible to account for all differences in CIA management, treatment protocols, and exact chemotherapy regimens used between Belgium and the other countries examined, which may lead to differences in management and treatment costs. Given that the choice of ESAs is not usually driven by the chemotherapy regimen used, the potential under- or over-estimation of costs should be similar for all three ESAs; therefore, the impact on the overall study results should be minimal. Despite the correlation between cancer incidence and chemotherapy regimen, adjusting for cancer incidence only would be insufficient, as standard local practice could lead to differences in the chemotherapy molecules used.
Although adjustments were made based on cancer incidence and chemotherapy use, not all confounders could be accounted for due to a lack of data. Some of these include disease severity and disease-specific mortality, which could influence the results of this analysis. The guidelines on anemia treatment with DARB allow a treatment schedule of 500 μg Q3W (as opposed to 150 μg QW at the time of the study by Spaepen et al.Citation11)Citation37. Although the current analysis does not include patients receiving 500 μg Q3W, this was considered a conservative approach, since capturing the lower frequency of administration would probably imply greater cost savings for DARB due to, for example, fewer visits to physicians.
Overall, the methodology implemented in this study allowed extending the Belgian analysis to Austria, France, Italy, Portugal, and Spain. Further research should explore the applicability of this methodology to different treatment options or procedures in other disease areas and other countries.
Conclusions
Strong similarities were found between the Belgian, Austrian, Italian, French, Portuguese, and Spanish populations in terms of demographics (age and gender profile), while differences in the incidence of four specific tumor types and chemotherapy regimens used were found. After adjusting for patient baseline characteristics and country differences, mean total costs with DARB were 19–35% lower compared with EPO-A and EPO-B. Mean anemia-related costs were 12–37% lower for patients receiving DARB compared with those receiving EPO-A or EPO-B. The findings are in line with those from the Belgian analysis and demonstrate the feasibility of using this methodology to adapt such data to other settings, accounting for patient characteristics and treatment costs where needed. These findings should, therefore, be valuable in healthcare decision-making in oncology patients being treated in each one of the five countries studied. The lack of granular, patient-level data in Europe that would allow for application of methods that address patient selection bias should be acknowledged. Further research examining the feasibility of the proposed methodology in another disease is warranted.
Transparency
Declaration of funding
Funding for this study was provided by Amgen GmbH. Lucie Kutikova and Beatriz Pujol are employees of Amgen and were involved in the drafting, revision and approval of the manuscript.
Declaration of financial/other relationships
LK and BP are Amgen employees; CL, BP, MB, and LA have received research funding or grant support from Amgen at their respective institutes. IMS Health received funding from Amgen to perform this study; AD, ML, and DU are employees of IMS Health; ES, EW, CL, BP, MB, SVB, and LA have acted as consultants to IMS Health.
Acknowledgments
The authors wish to acknowledge Gareth Worthington, PhD (Amgen [Europe] GmbH, Zug, Switzerland) and Dawn Batty, PhD (Bioscript Stirling Ltd [funded by Amgen]) who provided editorial support.
References
- Hofman M, Ryan JL, Figueroa-Moseley CD, et al. Cancer-related fatigue: the scale of the problem. Oncologist 2007;12(1 Suppl):4–10
- Kimel M, Leidy NK, Mannix S, et al. Does epoetin alfa improve health-related quality of life in chronically ill patients with anemia? Summary of trials of cancer, HIV/AIDS, and chronic kidney disease. Value Health 2008;11:57–75
- Cella D, Kallich J, McDermott A, et al. The longitudinal relationship of hemoglobin, fatigue and quality of life in anemic cancer patients: results from five randomized clinical trials. Ann Oncol 2004;15:979–86
- Cremieux PY, Finkelstein SN, Berndt ER, et al. Cost effectiveness, quality-adjusted life-years and supportive care. Recombinant human erythropoietin as a treatment of cancer-associated anaemia. Pharmacoeconomics 1999;16:459–72
- Bokemeyer C, Aapro MS, Courdi A, et al. EORTC guidelines for the use of erythropoietic proteins in anaemic patients with cancer: 2006 update. Eur J Cancer 2007;43:258–70
- Rizzo JD, Seidenfeld J, Piper M, et al. Erythropoietin: a paradigm for the development of practice guidelines. Hematology Am Soc Hematol Educ Program 2001;10–30
- Hedenus M, Adriansson M, San MJ, et al. Efficacy and safety of darbepoetin alfa in anaemic patients with lymphoproliferative malignancies: a randomized, double-blind, placebo-controlled study. Br J Haematol 2003;122:394–403
- Esquerdo G, Llorca C, Cervera JM, et al. Effectiveness of darbepoetin alfa in a cohort of oncology patients with chemotherapy-induced anaemia. Relationship between variation in three fatigue-specific quality of life questionnaire scores and change in haemoglobin level. Clin Transl Oncol 2011;13:341–7
- Repetto L. Incidence and clinical impact of chemotherapy induced myelotoxicity in cancer patients: an observational retrospective survey. Crit Rev Oncol Hematol 2009;72:170–9
- Khan FA, Shukla AN, Joshi SC. Anaemia and cancer treatment: a conceptual change. Singapore Med J 2008;49:759–64
- Spaepen E, Demarteau N, Van Belle S, et al. Health economic evaluation of treating anemia in cancer patients receiving chemotherapy: a study in Belgian hospitals. Oncologist 2008;13:596–607
- Rosenbaum P, Rubin D. The central role of the propensity score in observational studies for causal effects. Biometrika 1983;70:41–55
- Rosenbaum P, Rubin D. Reducing bias in observational studies using subclassification on the propensity score. J Am Stat Assoc 1984;79:516–24
- Rubin D. Estimating causal effects from large data sets using propensity scores. Ann Intern Med 1997;127:757–63
- Herrett E, Thomas SL, Schoonen WM, et al. Validation and validity of diagnoses in the General Practice Research Database: a systematic review. Br J Clin Pharmacol 2010;69:4–14
- International Society for Pharmacoeconomics and Outcomes Research (ISPOR). ISPOR International Digest of Databases. http://www.ispor.org/DigestOfIntDB/CountryList.aspx. Accessed November 2, 2010
- Kirkwood B, Sterne J. Essential Medical Statistics, 2nd edn. Oxford, UK: Blackwell Science Ltd, 2003
- Euromedia S.r.l. Pagine Sanitarie [Medical Page]. http://www.informatorefarmaceutico.it/. Accessed December 10, 2010
- Vorhandene Arzneispezialitäten. Arzneispezialitaten und Wirkstoffe [Medicinal products and active ingredients]. http://www.ami–info.at/. Accessed June 21, 2010
- Ministério de Saúde. Catálogo de Aprovisionamento Público da Saúde. [Catalogue of public health supplies]. http://www.catalogo.min–saude.pt/CAPS/publico/default.asp. Accessed August 30, 2010
- Consejo General de Colegios Oficiales de Farmacéuticos. portalfarma.com - Organización Farmacéutica Colegial. http://www.portalfarma.com/. Accessed October 27, 2010
- Bundesministerium für Gesundheit. Krankenanstalten in Zahlen [Hospitals in numbers]. http://www.bmg.gv.at/cms/site/attachments/3/0/5/CH0786/CMS1226916396155/uereg_oesterreich_2008.pdf. Accessed June 21, 2010
- Ministério da Saúde. Portaria n.° 839-A/2009, de 31 de Julho. http://www.acss.min-saude.pt/Portals/0/Portaria%20839_A_2009.pdf. Accessed September 20, 2010
- Ministerio de Sanidad, Política Social e Igualdad. Registro de Altas de los Hospitales del Sistema Nacional de Salud [National Health Service, Hospital Admissions Registry]. http://www.msps.es/estadEstudios/estadisticas/cmbdhome.htm. Accessed October 27, 2010
- Conferenza delle Regioni e delle Province autonome. Tariffa unica convenzionale per le prestazioni di assistenza ospedaliera. Regole e tariffe valide per l'anno 2009 [Conventional single tariff for the supply of hospital care. Rules and rates applicable to the year 2009]. http://www.regioni.it/upload/270110TUC_ASSISTENZA_OSPEDALIERA.pdf. Accessed December 7, 2010
- Inspection Générale des Affaires Sociales, Rapport N°RM 2010-122P. Pertinence d'une intégration du montant des agents stimulant l'érythropoïèse dans les tarifs de dialyse [Relevance of integrating the amount of erythropoiesis stimulating agents in the tariffs for dialysis]. http://www.fehap.fr/DATA/16_9_2010_14_28_9_igasdialyse072010.pdf. Accessed April 8, 2011
- Eurostat. Total population and demographic events (EU-27). http://appsso.eurostat.ec.europa.eu/nui/show.do?dataset=demo_pjan&lang=en. Accessed May 28, 2010
- Belgian Cancer Registry. Number of invasive tumours per localisation and age group, males and females. http://www.kankerregister.org/. Accessed May 28, 2011
- Statistik Austria. Krebsinzidenz (Neuerkankungen pro jahr) nach lokalisationen und geschlecht [Cancer incidence (per year) by site and gender]. http://www.statistik.at/web_de/static/krebsinzidenz_neuerkankungen_pro_jahr_nach_lokalisationen_und_geschlecht_o_021806.xls. Accessed May 28, 2010
- Institut de Veille Sanitaire. [French Institute for Public Health Surveillance]. http://www.invs.sante.fr/. Accessed April 11, 2011
- Associazione Italiana dei Registri Tumori. Available at http://www.registri-tumori.it/. Accessed October 25, 2010
- Instituto Português de Oncologia do Porto Francisco Gentil. Registo Oncológico Nacional [National Oncologic Registry]. http://www.ipoporto.min-saude.pt/Downloads_HSA/IPOP/RO_Nacional_2001.pdf. Accessed 3 August 30, 2010
- Ministerio de Sanidad, Política Social e Igualdad. Conjunto Mínimo Básico de Datos - Hospitalización (CMBDH) [Minimum Basic Hospitalization Data Set]. http://pestadistico.msc.es/PEMSC25/ArbolNodos.aspx. Accessed October 27, 2010
- National Health Center for Health Statistics. International Classification of Diseases, tenth revision (ICD-10). http://www.cdc.gov/nchs/icd/icd10.htm. Accessed May 10, 2010
- Hauptverband der Sozialversicherung. Erstattungskodex - EKO [Reimbursement Code - EKO]. http://www.sozialversicherung.at/portal27/portal/esvportal/start/startWindow?action=2&p_menuid=2&p_tabid=1. Accessed May 10, 2010
- INFARMED. Legislação Farmacêutica Compilada [Compiled Pharmaceutical Legislation]. http://www.infarmed.pt/portal/page/portal/INFARMED/LEGISLACAO/LEGISLACAO_FARMACEUTICA_COMPILADA/TITULO_III/TITULO_III_CAPITULO_I/035-E_DL_176_2006_VF.pdf. Accessed August 30, 2010
- Aapro M, Link H. September 2007 update on EORTC guidelines and anemia management with erythropoiesis-stimulating agents. Oncologist 2008;13(3 Suppl):33–6
- IMS Health. IMS Multinational Integrated Data Analysis System (MIDAS) Quantum. Danbury, CT, United States, IMS Health 2011
- European Pharmaceutical Market Research Association. ATC Guidelines 2010. http://www.ephmra.org/PDF/ATC%20Guidelines%202010.pdf. Accessed June 2, 2010
- Song X, Long SR, Marder WD, et al. The impact of methodological approach on cost findings in comparison of epoetin alfa with darbepoetin alfa. Ann Pharmacother 2009;43:1203–10
- Motheral B, Brooks J, Clark MA, et al. A checklist for retrospective database studies–report of the ISPOR Task Force on Retrospective Databases. Value Health 2003;6:90–7
- Polsky D, Eremina D, Hess G, et al. The importance of clinical variables in comparative analyses using propensity-score matching: the case of ESA costs for the treatment of chemotherapy-induced anaemia. Pharmacoeconomics 2009;27:755–65
- Sax MJ. Essential steps and practical applications for database studies. J Manag Care Pharm 2005;11:S5–S8