
ABSTRACT
Statisticians are in general agreement that there are flaws in how science is currently practiced; there is less agreement in how to make repairs. Our prescription for a Post-p < 0.05 Era is to develop and teach courses that expand our view of what constitutes the domain of statistics and thereby bridge undergraduate statistics coursework and the graduate student experience of applying statistics in research. Such courses can speed up the process of gaining statistical wisdom by giving students insight into the human propensity to make statistical errors, the meaning of a single test within a research project, ways in which p-values work and don't work as expected, the role of statistics in the lifecycle of science, and best practices for statistical communication. The course we have developed follows the story of how we use data to understand the world, leveraging simulation-based approaches to perform customized analyses and evaluate the behavior of statistical procedures. We provide ideas for expanding beyond the traditional classroom, two example activities, and a course syllabus as well as the set of statistical best practices for creating and consuming scientific information that we develop during the course.
1. A Prescription for a Post-p < 0.05 Era: Teach Statistical Wisdom
Statisticians and others are in general agreement that the current system of curating scientific knowledge is flawed (Sterne and Smith Citation2001; Leek and Peng Citation2015; Wasserstein and Lazar Citation2016). In fact, 90% of 1576 researchers surveyed agreed that there is a crisis in reproducibility in science with more than half agreeing that it is a major crisis (Baker Citation2016). There are concerns about scientists’ inability to replicate published results and the cost to society of an ineffective scientific process. To identify just a sample of the issues underlying these sentiments: questions are poorly formulated, too many tests are conducted, p-values are overvalued or misinterpreted altogether, and the peer-review process is overwhelmed. There is a pressing need to move statistical analysis and evidence-based decision making beyond the current system of overtesting and underthinking.
There is less agreement among statisticians on exactly how to repair our scientific machinery. Some promote alternative systems of assessing statistical significance, for example, p < 0.005, (Benjamin et al. Citation2018) or of evaluating information, for example, Bayesian methods (e.g., Johnson Citation2013). Some statisticians promote changes to the publication process (e.g. Sterne and Smith Citation2001) such as preregistration, preacceptance of study designs, and publication of negative results. Still others promote shifts in the way we evaluate scientists themselves with emphasis on quality of scientific work rather than quantity of high-ranking publications (e.g., Martinson Citation2017).
We follow on a proposal from Brown and Kass (Citation2009) to expand our view of what constitutes statistical training. In fact, we believe that the domain of statistics includes not only calculations but also the beginning of the scientific process, for example, asking a clear question and tying it correctly to analytical methods, and the end of the scientific process, for example, communicating results to the general public, as well as all the steps in-between. If the problem is a flawed system of curating scientific knowledge, in which p-values have played a leading role, our prescription for a Post-p < 0.05 Era is to equip students with a clear understanding of the opportunities and pitfalls in the application of statistics within that entire system.
We propose that there are opportunities to build a more efficient and effective knowledge supply chain. The wisdom necessary to identify and avoid common statistical mistakes or to understand flaws in the scientific process is generally arrived at through years, if not decades, of experience with data analysis, repeated exposure to common statistical errors and, long-term observation of the publication process. Instead of waiting for this wisdom to be accumulated, we could engage purposefully in teaching this statistical understanding to graduating statisticians and new researchers. In the previously mentioned poll on the reproducibility crisis, the number one factor needed for boosting reproducibility in science, cited by just over 50% of those surveyed, was “better understanding of statistics.” (Baker Citation2016).
In this article, we begin by outlining the history of efforts to improve teaching of statistical thinking and by describing the current atmosphere of opportunity for making an impact. We then explain the structure and unique features of our course for advanced undergraduate statistics majors and early graduate students from any discipline. Our course is explicitly designed to teach students why statistical thinking can be challenging; what common errors are and how they can be avoided; how a single statistical analysis fits into the larger supply-chain of knowledge; how errors can be induced from mismatched data summaries and research questions; what p-values are and how they are often misused; and what the responsibilities of scientists, including statisticians, are in communication of research results and uncertainty. We include two example activities and a detailed syllabus to promote the development of a shared library of resources for teaching statistical thinking beyond first-year courses. We conclude with a short synthesis of lessons learned in the first few years of delivering our course, and a call for expanding the domain of statistics to other courses and across communication platforms.
2. The Value of Teaching Statistical Thinking: Now is an Opportunity
Our ideas build on the efforts of many to improve statistical education. A conceptual framework for K-12 statistics education aimed at enhancing existing mathematics standards was produced in 2007 (Franklin et al. Citation2007). One of the stated goals of this endeavor was that “every high-school graduate should be able to use sound statistical reasoning to intelligently cope with the requirements of citizenship, employment, and family and to be prepared for a healthy, happy, and productive life.” Similarly, a tremendous effort has gone into researching and providing guidance for college-level introductory statistics courses. The GAISE College Report lists “teach statistical thinking” as the first of six recommendations for introductory courses (GAISE College Report ASA Revision Committee Citation2016). And, the American Institute of Biological Sciences (AIBS) Citation2015 report on bioinformatics workforce needs recommended training that includes the concept of the data lifecycle and project-based learning (AIBS Citation2015). There is still much room for innovation, particularly in integrating statistics and science. Statistics is “vastly underappreciated because too few statisticians, relatively speaking, have effectively conveyed the excitement of statistics, as a way of scientific thinking” (Meng Citation2009). Our course focuses on statistical thinking and, where possible, statistical wisdom across the full domain of statistics from asking questions to interpreting and communicating results. In so doing, it provides a bridge between undergraduate statistics coursework and the real-world application of statistical methods.
Teaching statistical thinking is not a new proposal. Twenty years ago, Moore (Citation1998) envisioned statistics as belonging to the liberal arts because our discipline offers tools and ideas for reasoning and a framework for evaluating evidence. Drawing conclusions from observations and data, understanding variation, and reasoning about chance are essential skills for today's world. “We [statistics] offer broad and flexible modes of reasoning that make smart people smarter in every aspect of life and work” (Moore Citation1998). He noted that the way we introduce the discipline of statistics to the hundreds of thousands of students who are subjected to a first-year statistics course every year is both an opportunity to communicate the value of statistical thinking and a public responsibility. We would add that similar opportunities and responsibilities exist at the transition from undergraduate study to graduate research and beyond.
In 1992, Cobb summarized three recommendations for curricular change in statistics as identified by a Statistics Focus Group on curricular action (Cobb Citation1992): (1) Emphasize statistical thinking; (2) more data and concepts: less theory, fewer recipes; and (3) foster active learning. Under “Emphasize statistical thinking,” the focus group included topics and principles for classroom learning such as the need for real data, consideration of how data are produced, the omnipresence of variability, and the quantification and explanation of variability. We have observed that, although the vast majority of statisticians agree with these ideals, many sequences of coursework for statistics majors fail in at least some of these and related elements. Graduate students outside of statistics are rarely exposed to these ideas at all and certainly not before they design their first research project. It remains unusual that these topics are covered explicitly, with the same depth or rigor of the technical content for which our discipline is, perhaps incorrectly, better known.
The ASA Ethical Guidelines describe statistician's responsibilities to the public, research subjects, colleagues, other statisticians, employers, and clients (ASA Citation2016). Strong statistical thinking skills and an expanded concept of the domain of statistics can help early-, mid-, and late-career statisticians meet these ethical standards that include, for example, avoidance of running multiple tests. By virtue of our experience, statisticians also have an ethical obligation to students of all ages and disciplines, an obligation to share and teach skills for critically evaluating claims of new knowledge, making strong decisions in the face of uncertain information, and avoiding egregious errors in probabilistic thinking.
As a pointed example of our current failures, and at the risk of drawing false conclusions from anecdotes, here is a short story. One of us recently suggested to a student applying for medical school that a good course in statistics was essential for physicians. She replied that she had taken AP Statistics in high school, that it was horrid, and that she had therefore met her statistics coursework requirements forever. She had no intention of ever taking another statistics course. Vaguely horrified, we asked “How will you know whether to take newly published research seriously and how will you know when to change your ideas about the best treatments? And how will you evaluate ..?” “Oh I know all that” she interrupted nonchalantly, “just check the p-value.” This student might be making health care decisions for you in 10 years.
The enthusiasm and energy surrounding this special issue and the ASA's Symposium on Statistical Inference, Bethesda, MD October 2017, together with the following trends brings unprecedented opportunity for change. The recent growth in the number of undergraduate statistics majors makes this an ideal moment in history to experiment with new course offerings. From 2003 to 2011, there was a 78% increase in bachelor's degrees in statistics, biostatistics, and related fields (Pierson Citation2013). We would expect the trend to continue as the market demand for quantitative skills continues to increase. The Bureau of Labor Statistics (Citation2017) projected that the number of statisticians would increase by 27% between 2012 and 2022, while the general job market was only expected to grow by 11% during that same time. There is, of course, expected to be a large number of jobs in the general area of Big Data; Lund et al. (Citation2013) expect openings for nearly 200,000 people in this field. The analytics area, be it in business, sports, or criminology, is seeing vastly increasing demand. The workforce a decade from now will employ a large number of statisticians all of whom must be able to both calculate to understand the context of their analysis. As well, students now enter college having completed math curricula with more probability theory and early statistical thinking skills than in the past, providing an “opportunity to build on a broader foundation of prior knowledge that leaves room to delve deeper and farther than ever before possible” (GAISE College Report ASA Revision Committee Citation2016).
3. Structure of Our Course in Statistical Thinking
The course, focused on a set of core topics that move from how the human brain works to statistical communication (), is intended for senior statistics majors, though some sophomores and juniors have enrolled, and anyone else interested in conducting research (usually graduate students but we have had some research-minded undergraduates from other disciplines). In terms of their understanding of the role of statistics in science, statistics senior undergraduates and, say, first-year ecology graduate students are not so far apart. There are no mandatory prerequisite courses, but some knowledge of standard statistical procedures, such as t-tests or linear regression, is strongly recommended. We aim to reach students who think they understand something about statistics and who are ready to think hard about what they have yet to learn. We were proud when one student described our course as having a “completely different framing than any other course: how to understand data, how to filter out nonsense, how to navigate quantitative data.”
We interweave lectures, in-class activities such as analog simulations, for example, drawing marbles from a bag, discussion groups, and computer labs. A key feature of the course structure is that all in-class work is done in assigned groups, which are designed to mix students from multiple disciplines, with different perspectives, and with a range of experiences. We have observed that the broader the range of backgrounds, the more effective the group dynamics. The application of statistical tools, after all, requires both mathematical and non mathematical knowledge (Kuzmak Citation2016). The students with domain-related knowledge and experience are essential for helping the statistics majors interpret results and engage in the exercises. Interestingly, the number of statistics courses previously taken does not seem to predict course performance. Students with lots of procedural knowledge are not necessarily those with the interest and ability to think about how those procedures can inform our understanding of the world around us. The limiting factor for many students is confidence in R programming skills. We design the groups to distribute the most experienced R programmers across groups. Sample code is always provided and we have added a lab in the second week of the course specifically designed to teach the bare bones of running simulations in R. We also ask that the least experienced R programmer does the typing which keeps all students engaged, either typing or coaching.
The course is divided into three sections (see ) which form a story arc from how humans make observations to making inference from observations to communicating what has been learned. In the first section, Making Sense of Data, we focus on the workings of the human brain and on sampling distributions. We provide students with many examples to demonstrate how easily we, as humans, are fooled by pattern and coincidence (Tversky and Kahnemann Citation1974; Diaconis and Mosteller Citation1989). And we argue that, by heightened awareness of these common errors, we can avoid them. We also discuss big ideas like confidence intervals, introduce simulations as a way of learning and testing, and give students the quick overview of R mentioned above. The second section, Using Data for Scientific Understanding, is all about making inference. Students gain experience through readings and exercises that increase their understanding of p-values (as described in detail below) and promote the idea that estimation is often a better approach than testing. We help them identify when statistical testing is appropriate and enable them to design their own randomization tests to ask and answer exactly the question of interest. We also discuss inference on a macroscale. How does science proceed from an experiment in a lab to common understanding or accepted truth? How does the peer-review process influence the application of statistics? In the third section, Using Science in Society, we focus on interpreting scientific claims (Sutherland et al. Citation2013), communication of risk, communication with and by the media, applications of statistical insight in controversial topics such as climate change, and the ability (or lack of ability) for scientific fact to change people's minds about controversial topics. Student understanding of the big ideas in the course doesn't happen all at once but through spiraling back to ideas over and over again from different perspectives.
Table 1. Core Topics for an Advanced Course in Statistical Thinking.
Table 2. Condensed syllabus for our 10-week course in statistical thinking.
During the first half of the course, students are assigned both readings (or similar activities) and R homework each week. Assigned readings and activities range from original statistics papers to science articles, magazine articles, blog posts, spurious correlation and p-hacking simulators, and videos. Many of the key readings are cited in this article. R homework generally follows directly from the in-class labs. During the second half of the course, students have very little programming homework and, instead, work in groups on a final project to apply their new understanding and communication skills in conducting statistical testing, drawing conclusions from data, and communicating findings honestly yet with enthusiasm.
Final projects are delivered as oral presentations, newspaper or magazine articles, and social media posts. These group projects not only include real data but they apply to real-world situations for which one truly seeks and cares about the answer (Kuzmak Citation2016). The data are messy; the questions are poorly specified; graphs must be designed to answer a question; and t-tests are not allowed. Although each group project is designed to cover the full spectrum of activities involved in using data to answer a question, each project emphasizes a particular element of the course from heuristics that lead to flawed thinking to the perils of multiple tests to the challenges of communicating exciting results with honesty. Past group projects have included conducting a survey similar to that of Tversky and Kahneman (Citation1974) to reproduce and/or extend their results, for example by comparing performance between statistics and nonstatistics majors; exploring the first four years of data from a large Federal research project on stream restoration in Alaska to provide the researchers with preliminary information relevant to their stated research questions; re-evaluating an article in Grist claiming that large snowstorms have become more frequent on the East Coast using the data reported in the article and publicly accessible data for several cities; and graphing downscaled climate hindcast and forecast data for a watershed south of Bangkok, Thailand, to provide insight about likely future changes in climate that would be relevant to local farmers. In the final week of the course, group project presentations are ordered so as to provide a fairly organized review of the key messages and ideas in the course. For example, the above projects would be presented in the order described so as to cover typical human errors, matching analysis to research questions, how the media communicates scientific results, and communicating to particular stakeholder groups. To avoid what might be seen as a cynical and depressing view of all the opportunities to make mistakes, we also accumulate a set of best statistical practices during the course. On the final day, we review and distribute this succinct list of reminders for conducting and consuming scientific analyses (see ).
Table 3. Best statistical practices: for implementation by undergraduates and early graduate students
After taking our course, we expect students to have gained (or sharpened) the following understandings and skills: (1) the ability to identify and prevent common errors in thinking that lead to erroneous conclusions; (2) the ability to match a research question to a statistical procedure, including the metric of interest; (3) the ability to create a bootstrap confidence interval for a quantity of interest; (4) the ability to customize a permutation test for a comparison of interest; (5) the ability to use simulations to conduct and evaluate statistical analyses; (6) an understanding of how knowledge is curated and the role that statistics plays in that process; and (7) skills for communicating scientific and probabilistic information honestly and clearly. We summarize our teaching philosophy as “building efficient skepticism to improve the application of statistics in scientific research.” By efficient, we intend to imply both that skepticism should be a natural part of consuming scientific information and also that it need not prevent the forward momentum of ideas.
Our course is called “So You Think You Can Do Statistics?”, a pun on the TV show “So You Think You Can Dance?”, and has been taught three times as a 3-credit, 1-quarter class at the University of Washington, cross-listed in Statistics and College of the Environment. Student reviews have been exceptional. “The most interesting stats class I've ever taken,” “It teaches things that weren't mentioned in a lot of theory classes,” “requires us to think about the process of doing statistics,” “mostly it really makes sense when you think about it, but you would never think about it on your own,” and “permutation tests are a Swiss-army knife for designing statistical tests.” In 2017, 72% of students ranked the course content as excellent and there was a request to increase maximum enrollment for 2018.
By the very principles we teach, we can make no assessment of the “significance” of our course. Early indications, however, are positive. As a part of our course evaluation process, students read and evaluated similar articles before and after the course. Before our class, no students mentioned that they considered the sample size or that they wished for confidence intervals in their evaluations of these articles but, after the course, students focused on these ideas. After the course, students were also concerned about the influence of base rates, cherry-picking results, and decisions about what was measured on the article's final conclusions. When asked anonymously what they would take away from the course, undergraduate students wrote “Those fallacies when interpreting those scientific news”; “Awareness of common statistical pitfalls and bootstrapping. Specifically knowing how easy it is to manipulate information to support a desired outcome”; and “All of the things that we need to look out for, and then just about how p-values aren't the end all be all of statistics like they're made out to be.” Graduate students from 2018 described their learning informally as “I learned that even published scientific studies should be taken with a grain of salt” and “I feel that I will take a much more cautious approach to analyses I will conduct in my own research, particularly when it comes to choosing a particular analysis approach ahead of time and sticking to it.” In the formal evaluation, one graduate student wrote “Since beginning this class, I am definitely more critical of every paper, article, or news story that I read. I always check sample size, and then look to see if they report confidence intervals or uncertainty. I have started to mistrust p-values and have noticed the dependence on them in literature. I have tried to decipher how much is communicated to the general public versus the research community and how data is misconstrued.” Whether this same wise skepticism is applied and retained in the future remains to be seen.
4. Unusual Features of Our Course in Statistical Thinking
There are similarities between our approach and the approaches of others, including the GAISE recommendations for first year courses in statistics (GAISE College Report ASA Revision Committee Citation2016). Like others, we also hope our course is fun and relevant to the daily life of students (Meng Citation2009), we encourage effective graphing, and we discourage overreliance on statistical testing.
Our course is, however, different from traditional statistics courses in several ways. First, our course is predicated on the idea that the biggest problems with statistics as currently practiced are not in the details of the techniques (e.g., nonnormality, nonconstant variance, unaccounted for nonlinearity) but in the big ideas surrounding application of statistical tools (e.g., how does what you have measured relate to the subject of interest (sensu Mallows Citation1998), the likelihood of observing strong patterns by chance alone, the tendency to oversell novel results). Our course therefore presents a body of knowledge not commonly taught as a cohesive whole. As a result, and secondly, the course is inherently multidisciplinary, including topics rarely covered in Statistics Departments such as human psychology, communication, and peer review. Third, our course is intended as a bridging course. It serves as a bridge between statistical knowledge and successful application of statistics in science. We have found that the sharing of experience across advanced undergraduates and early graduate students enriches the learning outcomes for both. Fourth, our course focuses on what can go wrong in the application of statistics. Statistical tools are often taught within a framework in which they are useful. We spend nearly equal time focusing on examples of when, how, and why application of statistical tools go wrong. Fifth, our course considers how a single analysis fits into the lifecycle of science. For example, we explicitly consider the file drawer effect (Rosenthal Citation1979) and the concept of the garden of forking paths (Gelman and Loken Citation2013), as well as the filtering that occurs during the peer-review process. Sixth, we conduct experiments on p-values and explicitly discuss the replication crisis in science. Seventh, we devote nearly 20% of the course to statistical communication including activities such evaluating press releases, watching videos of prominent statisticians explaining the demands of statistical communication, and considering how social media magnifies the pressure and opportunity for scientists to overstate their claims. And, finally, we confront the messiness of data analysis head-on. Subjective decisions are required at multiple steps along the way and answers are not always conclusive.
A very similar course could be taught as a seminar in “How science happens” to graduate students or as a capstone course for statistics majors. Statistical capstone courses have been designed in a variety of formats and often focus on large-scale data analysis projects (Martonosi and Williams Citation2016). One common format for a capstone course is an in-depth analysis of real-world data embedded in an advanced methodology course. As a capstone, our course would differ in its lack of emphasis on advanced methods and in the focus of our final projects on specifying the question of interest, identifying best metric to answer the question, creating graphics that tell a story, and communicating, even in the form of tweets and Facebook posts, the scientific conclusion.
Three features of our course demand a more in-depth explanation.
Simulations. Simulations can form a foundation for K-12 courses (Franklin et al. Citation2007), introductory college-level statistics courses (e.g., Lock et al. Citation2013 and Tintle et al. Citation2015), and advanced courses such as “Advanced Resampling Methods.” Simulations give us a multipurpose tool to build intuition and to create customized estimation and testing approaches that would otherwise be difficult. We use simulations in four ways: sampling from a population and observing the sampling distribution of some quantity; sampling with replacement to estimate a confidence interval; sampling without replacement to conduct permutation tests; creating multiple datasets from known distributions to evaluate the performance of statistical procedures.
It is somewhat unusual that we pair analog and digital simulations in order to build a deep, perhaps gestalt, sense of how statistical processes work. In the first week (See Example Exercise One), students draw marbles from a bag to simulate, effectively, balls in urns and experience differences in the probability of extreme events with changes in sample size. We then simulate that same experiment digitally in R (R Core Team, Citation2017). We bring a sampling distribution to life by calculating the mean weights of Faux Fish (data printed on fish-shaped bits of paper) in a pond (an envelope) from a sample of N = 3 Faux Fish and then a sample of N = 10 Faux Fish. Each mean value is written on a small sticky note and used to build a histogram of the results from all groups at the front of the room ().
Figure 1. Visualizing sampling distributions using analog simulations: (a) histogram of weights of all Faux Fish in a pond; (b) sampling distribution of the mean of samples of size n = 3; (c) sampling distribution of the mean of samples of size n = 10. The arrows correspond to the true mean from (a). Photos by E. A. Steel.
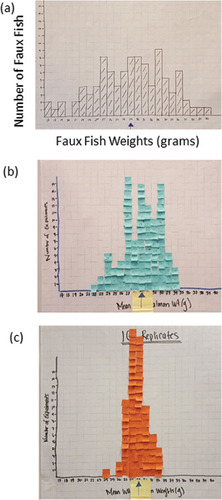
The Faux Fish exercise is taken from a curriculum aimed at middle school students (Kelsey and Steel Citation2002) but it is also effective and powerful for advanced students and even practicing professionals. There is something magical about watching a sampling distribution materialize, just as expected, as a result of random chance. We then simulate that exact same experiment digitally. Students also conduct a permutation test by physically cutting off data labels and permuting the data values, building a null model at the front of the room by graphing class results in real time. Of course, permutation tests are then conducted with a much higher sample size in R. With this foundation in simulation thinking, students go on to use simulations to evaluate the performance of p-values under a variety of situations (see Example Exercise Two), compute statistical power, and compare the performance of testing procedures under various conditions.
P-values. Because we are proposing our course, and other courses like it, as one part of the prescription for a post p < 0.05 world, it is important to describe what and how we teach students specifically about p-values. In week four, we introduce the idea of a p-value without naming it. When we permute data after cutting off the labels, as described above, we build a histogram of the distribution of the difference between group means under a null hypothesis of “no difference between the group means.” We then ask the students, “what percent of the time did we see a difference between group means as extreme or more extreme than the difference we actually observed in the original data?” And, we have a short discussion about what we conclude given the observed data and the histogram of the null distribution still without naming the idea as a p-value. Although many students are familiar with p-values, this way of approaching it is new to most of them.
We then begin week five with a 20-min lecture on the history of p-values, starting with a definition from Karl Pearson (Pearson Citation1900) and eventually comparing and contrasting Ronald Fisher's testing approach (Fisher Citation1925) with that of Jerzy Neyman and Egon Pearson (Neyman and Pearson Citation1933). We remind students that the p-value is a random variable and explain that, under the null hypothesis, the p-value has a uniform distribution. We spend time considering how likely a probability of 0.05 really is. Most students have played games of chance in which rolling two die and getting two sixes is an exciting but relatively common outcome. A p-value of 0.05 is nearly twice as likely! Students then enjoy The Chocolate Lab (see Example Exercise Two) which should reinforce a growing understanding about how p-values can be misused and misunderstood. For homework, students conduct one of five simulation experiments on p-values. The experiments build intuition about how p-values behave when the null hypothesis is true; distinguish between statistical and practical significance; determine how effect size and sample size influence the probability of rejecting; estimate the probability that the null hypothesis is true when you have and when you have not rejected; and demonstrate that when you reject with low power, the observed difference in means is likely much higher than the true difference in means. Students report out the results of their experiments in the following class so that all students can learn from all five experiments. Finally, we talk extensively about how to communicate to scientists, journalists, or user groups such as farmers, the results of statistical analyses when p-values are small and when they are not.
Limiting our course to two-sample comparisons. There is surprisingly little time in a semester course. Teaching multiple techniques or covering a range of complex applications does not leave enough time for big picture ideas on which we want to focus our efforts; therefore, we have made thoughtful tradeoffs and exclusions. For example, we limit our formal lectures and exercises to the comparison of samples from two populations using graphs, estimation, and permutation tests. This allows us to build on knowledge of t-tests, which almost all our students have been introduced to in past coursework, create manageable simulations, and explore parallels across examples. Most of the skills and big ideas are relevant beyond applications that compare two samples, for example identifying the relevant measure to compare, bootstrapping a confidence interval for an effect size, or limiting the number of tests. Student projects generally involve comparisons between many groups and the students have had no problem extending the ideas to this expanded situation. Occasionally, we do touch on linear regression because many students have been exposed to it in past coursework. For example, students simulate the distribution of r-squared values for linear regressions when there is no effect, and students who are particularly comfortable with linear regression sometimes bring it to their group projects. In this case, they might create a scatterplot, fit a regression line, and bootstrap a confidence interval for the regression coefficient. Beyond permutation tests, we do not teach any new statistical testing procedures. Although our focus on two-sample situations could be perceived as a limitation of our course, we prefer to think of it as a feature of our course. There are lots of courses that teach statistical tools. Our course teaches students about issues and opportunities that arise when applying a single, simple tool, and by extension many other statistical tools, to generate new knowledge.
5. Example Activities to Promote Statistical Thinking
We challenge students to think deeply about their own cognitive biases, issues that arise in the application of statistical testing, types of statistical mistakes that are most common, and the cumulative effect of those mistakes. Some of our exercises include a surprise so that students are forced to face their own propensity for error. We describe two such exercises here as they may be particularly useful for other courses or workshops. Other course exercises focus on activities such as writing R code to create bootstrap confidence intervals, permutation tests, and power analyses or even collecting small datasets as an opportunity to consider the effect of study design on study conclusions.
Example Activity 1: Interpret this … and that! The perils of small samples and how strong patterns arise by chance alone.
We begin this activity on the second day of the course. Students sit in mixed groups, statistics students with students from other disciplines, undergraduates and graduate students, R programmers and the computer-phobic. Each group is given a paper to direct their discussion. Half of the groups are given the following statement “Kidney Cancer across America: A study of new diagnoses of kidney cancer in the 3141 counties of the United States reveals a remarkable pattern. The counties in which the incidence of kidney cancer are lowest are mostly rural, sparsely populated, and located in traditionally Republican states in the Midwest, South, and West. Think about these findings and identify three likely explanations.” Unknown to the students, half of the groups are given the opposite statement in which kidney cancer are highest in rural counties. After the students generate ideas in their small groups, we open a discussion by making a list on the white board of “likely explanations for these observations.” The students generate explanations ranging from the magic of a more natural environment to the perils of agricultural chemicals and from access to smaller hospitals to lack of access to high-end hospitals. Because the students are unaware that groups were given different information, discomfort grows. The list of answers stops making sense; time for the class runs out; and we remind students to complete the assigned reading.
Assigned reading after this exercise includes “The most dangerous equation” (Wainer Citation2007), “The most dangerous hospital or the most dangerous equation?” (Tu and Gilthorpe Citation2007), a press release for a $25M grant to create smaller schools across Oregon State (Bill and Melinda Gates Foundation Press Room Citation2003), and a news article from the Washington Post about the fallacies of the Gates Foundation small schools initiative and the dollars potentially wasted (Strauss Citation2014). In the first reading, Wainer explains the kidney cancer example with a beautiful map that shows both the highest and the lowest kidney cancer rates in rural counties. Of course, where you have fewer residents you have smaller sample sizes; you are, by chance alone, likely to see more extreme results.
When the students return to class, they are provided with a bag of marbles in which there are 40 red marbles and 40 clear marbles, our “balls in urns.” Students take samples of size N = 7 marbles and record how many times they get an extreme event, defined as all the marbles are the same color. There are few extreme events. The exercise is repeated for samples of size N = 4 marbles and there are, as expected, many more extreme events. Class results are combined and we calculate the probability of the extreme event when you draw 4 marbles and the probability of the extreme event when you draw 7 marbles. What's the answer? For n = 4, p = 0.125. Not really all that unlikely. For n = 7, p = 0.0156. Rare!
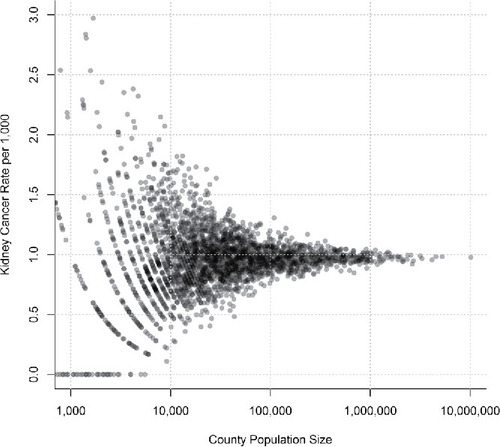
We then turn the discussion back to the kidney cancer rates and the effect of sample size on the probability of extreme events which, in that case, were high or low kidney cancer rates. Students learn that all groups were actually given correct information. We discuss the ease with which the human mind is fooled by pattern and refer back to several of the System 1 shortcuts described by Tversky and Kahnemann (Citation1974) which students had read earlier. We also comment on how willingly and confidently each group had created a story to explain an observed pattern. We then simulate the pattern in R by assuming a constant disease rate and applying it to county population data from the U.S. Census Bureau (https://www.census.gov/data/tables/2016/demo/popest/counties-total.html) (). We demonstrate to the students that, by chance alone, we nearly always see the highest and lowest disease rates in the smallest counties.
Figure 2. Simulated county cancer rates as a function of county population size using a fixed kidney cancer rate. Results demonstrate that, although the cancer rate in these simulations is the same in every county, by chance we will observed the highest and lowest county cancer rates in the counties with the fewest people.
Example Activity 2: The science of bad science. How you too can fool the world into thinking almost anything.
We welcome the students to class with local chocolate, “Good news. This is healthy so enjoy!” The students, if they have done the reading, should be in agreement. We had asked them to read “Chocolate with High Cocoa Content as a Weight-Loss Accelerator” (Bohannon et al. Citation2015). We put up a nice slide full of happy headlines reporting on the joy of chocolate as a new weight loss tool and we pull out the bare bones of the methods for the students.
The next step is to create a null model of the experiment. What would these results be expected to look like by chance alone? Students are given guidance and snippets of R code to simulate a simplified version of this study in which the researchers compared 18 responses of a small number of participants to a diet that included chocolate versus a diet that did not. Using this null model, students simulate the frequency of a particular significant effect (e.g., weight change), the frequency of any significant effect, the frequency of a significant effect when one outlier is removed (as was done in the study), the distribution of simulated effect sizes for those datasets in which the null hypothesis was rejected (as compared to the known, simulated effect size), and the number of study subjects that might truly be necessary to detect such a small difference. Note that statistical power is not formally introduced until the following week.
We then read the article “I fooled millions into thinking chocolate helps weight loss. Here's how,“ a blog post by lead author, John Bohannon (Bohannon Citation2015). “The study was 100 percent authentic. My colleagues and I recruited actual human subjects in Germany. We ran an actual clinical trial, with subjects randomly assigned to different diet regimes. And the statistically significant benefits of chocolate that we reported are based on the actual data… It was terrible science. The results are meaningless, and the health claims that the media blasted out to millions of people around the world are utterly unfounded. Here's how we did it…”
Ensuing class discussions are fun. A few of the more advanced students were a little skeptical of the whole process and knew intuitively where this was going but few had understood the details of how it works, from the perils of the statistical process to entrancing the media. We explain that any one particular statistical test worked correctly and the odds of observing any one particular outcome, for example, a loss of weight, was just 0.05. But the overall odds of finding something “surprising” is very high when there are multiple tests and higher still when you make decisions such as systematically deleting a type of outlier.
This exercise, coming at the center of the course, reflects back on earlier exercises in which students competed in teams to identify neat patterns in data (which turned out to be randomly generated) and were quickly willing to oversell their “findings” and it opens up deep topics about the lifecycle of science, how the peer review process really works, issues embedded in working with the media, and the importance of clear scientific communication. As well, the exercise builds intuition about the value of a null model and it arms students with simulation skills (and sample code) for evaluating the behavior of various testing procedures as part of their final project.
6. Conclusion
A course in statistical thinking that considers the full domain of statistics is fundamentally different from a traditional statistics course. First, the errors of concern in statistics courses are often errors in calculation, which are only one of the many kinds of statistical mistakes that can lead to poor science and bad decision-making. A large proportion of statistical mistakes result from incorrect logic or interpretation despite correct numerical calculations (Steel et al. Citation2013; Leek and Peng Citation2015). Second, the course must weave in content not traditionally taught in statistics departments. Few courses train students to understand the role of statistics in the scientific process. We argue that, if more scientists and statisticians had a clearer understanding of these interactions, there would be fewer flaws in how the scientific method is applied and we would be taking a big step in moving beyond the “bright line rule” of p < 0.05.
To think statistically is to think in distributions and probabilities and also to understand the role of statistical analysis within the greater machinery of generating scientific knowledge. A course in statistical thinking can use simulations to understand the role of chance in creating patterns, the importance of randomness in making inference from a sample to a population, the multiple ways of quantifying uncertainty, and the host of potential errors that can occur when conducting statistical tests. Such a course also needs to speed up the process of building statistical wisdom about how things can go wrong in the integration of mathematical and nonmathematical knowledge. Understanding how human fallacies make particular statistical errors very likely can be a foundation of such wisdom. Activities that surprise students or lead them to question their understanding of statistics provide benchmark lessons that students are likely to refer to as practicing statisticians and scientists. Teaching statistical thinking and teaching across the full domain of statistical content is challenging. It requires that we share success stories, great teaching examples, teaching resources, and teaching mistakes. A shared library of resources, for example, would be a great help.
In teaching the course, we have learned a good deal about how to develop deeper statistical skills. First, students need to understand how pervasive problems in statistical intuition are and they need to be convinced that they too make predictable errors. We achieve this by a precourse survey that includes a few questions even trained statisticians often get wrong and a few carefully structured trick examples as described above. Second, students need a gut-level understanding of statistical topics, and this gut-level understanding can best be achieved through simulation. In order to understand sampling distributions, they need to take samples in many ways and observe the outcomes. In order to group how p-values do and don't work, students need to experience for themselves significant results that are generated from noise. Third, students need both positive and negative examples. In our first year, we had fun presenting dozens of flawed papers, only to realize that we had left students without confidence in the best practices we were promoting. Our short list of best practices () has helped students envision how to make improvements in the system. Fourth, students need real datasets of which to ask real-world questions (Willet and Singer Citation1992; Neuman et al. Citation2013). Only through this process can students struggle with all the steps in the scientific lifecycle, from how to refine a question and how to best summarize data in a way that answers it, to how to make an informative graph and when to stop searching for patterns. Fifth, we limit lecturing through increased use of group discussions and hands-on activities. Thinking skills need to be practiced, not just preached.
Courses dedicated to statistical thinking are essential and fun, but there are many other opportunities to inject statistical thinking and wisdom into the education and minds of future lawyers, politicians, parents, investors, and even data scientists. There are engaging statistics courses that bring statistical thinking into daily life, such as Stat 105 at Harvard University, “Real Life Statistics: Your Chance for Happiness (or Misery)”, that arranges course content into real-life applications (Meng Citation2009). As well, there are myriad opportunities for speaking on these topics beyond traditional statistics curriculum or statistics departments. Big ideas in statistical thinking can also be presented as single lectures in topical undergraduate or graduate courses, as guest presentations in your local high school, and even anecdotally in talks presented at professional societies.
Teaching statistical thinking and explaining the integration of statistics in the scientific process is an essential part of repairing our scientific machinery. It doesn't stop with one new course. If we had the opportunity to teach for an additional quarter, we could design and add activities that add similar depth to linear regression and we would dedicate more time to principles of sampling design (what works and what can go wrong), the art of reviewing science papers (formally and also informally), and science journalism. Workshops for a range of practicing professionals and even for the general public would also be incredibly valuable: “Five statistical red flags: A workshop for managers who rely on the best available science to make decisions” or “Better living through statistics: A whirlwind tour of how big ideas in the quantitative world can help you make better decisions on everything from whether to buy travel insurance to whether to get a mammogram.” Through increased promotion of these ideas beyond academia, future physicians might be better equipped to evaluate new research, future judges might be less susceptible to the negative effect fallacy (Enos et al. Citation2017; Fowler Citation2017), and future charitable foundation leaders might be more skeptical of interesting patterns (Bill and Melinda Gates Foundation Press Room Citation2003). Formally and informally, teaching statistical thinking is, perhaps, our biggest, best, and easiest opportunity to make a positive impact.
Related Research Data
References
- American Institute of Biological Sciences (AIBS) Council of Member Society and Organizations Meeting (2015), Leadership in Biology an AIBS Initiative: Addressing Biological Informatics Workforce Needs, available at https://www.aibs.org/public-policy/resources/AIBS_2015_Council_Report.pdf.
- American Statistical Association (ASA) (2016), Ethical Guidelines for Statistical Practice, available at http://www.amstat.org/asa/files/pdfs/EthicalGuidelines.pdf.
- Baker, M. (2016), “Is There a Reproducibility Crisis in Science?” Nature, 533, 452–454.
- Benjamin D. J., Berger J. O., Johannesson M., Nosek B. A., Wagenmakers E. J., Berk R., Bollen K. A., Brembs B., Brown L., Camerer C., Cesarini D. (2018), “Redefine Statistical Significance,” Nature Human Behaviour, 2, 6–10.
- Bill and Melinda Gates Foundation Press Room (2003), Stronger, Smaller High Schools to Help Thousands of Oregon Students, available at https://www.gatesfoundation.org/Media-Center/Press-Releases/2003/04/Oregon-Small-Schools-Initiative.
- Brown, E. N., and Kass R. (2009), “What is Statistics?” The American Statistician, 63, 105–110.
- Bohannon, J., Koch, D., Homm, P., and Driehaus, A. (2015), “Chocolate with High Cocoa Content as a Weight-Loss Accelerator,” Global Journal of Medical Research, 15, 9–14.
- Bohannon, J. (2015), I Fooled Millions Into Thinking Chocolate Helps Weight Loss. Here's How, available at https://io9.gizmodo.com/i-fooled-millions-into-thinking-chocolate-helps-weight-1707251800.
- Bureau of Labor Statistics (2017), Occupational Outlook Handbook, Mathematicians and Statisticians, available at http://www.bls.gov/ooh/math/statisticians.htm.
- Cobb, G. W. (1992), “Report of the Joint ASA/MAA Committee on Undergraduate Statistics, in Proceedings of the Section on Statistical Education, Alexandria, VA: American Statistical Association, pp. 281–283.
- Diaconis, P., and Mosteller, F. (1989), “Methods for Studying Coincidences,” Journal of the American Statistical Association, 84, 853–861.
- Enos R. D., Fowler, A., and Havasy, C. S. (2017), “The Negative Effect Fallacy: A Case Study of Incorrect Statistical Reasoning by Federal Courts,” Journal of Empirical Legal Studies, 14, 618–547.
- Fisher, R. (1925), Statistical Methods for Research Workers, Edinburgh: Oliver & Boyd.
- Fowler, A. (2017), “Chief Justice Roberts and Other Judges Have a Hard Time with Statistics. That's a Real Problem,” The Washington Post, available at https://www.washingtonpost.com/news/monkey-cage/wp/2017/10/31/chief-justice-roberts-and-other-judges-have-a-hard-time-with-statistics-thats-a-real-problem/?utm_term=.28de5b8f0a3e.
- Franklin, C., Kader, G., Mewborn, D., Moreno. J., Peck, R., Perry, M., and Scheaffer, R. (2007), Guidelines for Assessment and Instruction in Statistics Education (GAISE) Report: A Pre-K–12 Curriculum Framework, available at www.amstat.org/education/gaise.
- GAISE College Report ASA Revision Committee (2016), Guidelines for Assessment and Instruction in Statistics Education College Report 2016, available at http://www.amstat.org/education/gaise.
- Gelman, A., and Loken, E. (2013), “The Garden of Forking Paths: Why Multiple Comparisons Can Be A Problem, Even When There Is No ‘Fishing Expedition’ Or ‘P-Hacking’ and the Research Hypothesis was Posited Ahead of Time,” Department of Statistics, Columbia University, available at http://www.stat.columbia.edu/∼gelman/research/unpublished/p_hacking.pdf.
- Johnson, V. E. (2013), “Revised Standards for Statistical Evidence,” Proceedings of the National Academy of Sciences, 110, 19313–19317.
- Kelsey, K., and Steel, A. (2002), The Truth About Science: A Curriculum for Developing Young Scientists, Arlington, VA: National Science Teachers Association Press, 226 pp.
- Kuzmak, S. (2016), Mapping Knowledge for Probability and Statistics Application: Mathematical and Non-Mathematical, in Promoting Understanding Of Statistics About Society, Proceedings of the Roundtable Conference of the International Association of Statistics Education (IASE), July 2016, Berlin, Germany, ed. J. Engel, available at https://iase-web.org/documents/papers/rt2016/Kuzmak.pdf.
- Leek, J. T., and Peng, R. D. (2015), “Statistics: P Values Are Just The Tip Of The Iceberg,” Nature, 520, 612.
- Lock R. H., Lock, P. F., Morgan, K. L., Lock, E. F., and Lock D. F. (2013), Statistics: Unlocking the Power of Data, New York: Wiley.
- Lund, S., Manyika, J., Nyquist, S., Mendonca, and Ramaswamy, S. L. (2013), Game Changers: Five Opportunities for US Growth and Renewal, available at http://www.mckinsey.com/∼/media/McKinsey/dotcom/Insights/Growth/US%20game%20changers/MGI_Game_changers_US_growth_and_renewal_Full_report.ashx.
- Mallows, C. (1998), “The Zeroth Problem,” The American Statistician, 52, 1–9.
- Martinson B. C. (2017), “Give Researchers A Lifetime Word Limit,” Nature News, 550, 303.
- Martonosi, S. E., and Williams, T. D. (2016), “A Survey of Statistical Capstone Courses,” Journal of Statistics Education, 24, 127–135.
- Meng X. L. (2009), “Statistics: Your Chance For Happiness (Or Misery),” The Harvard University Undergraduate Research Journal, 2, 21–7.
- Moore, D. S. (1998), “Statistics Among The Liberal Arts,” Journal of the American Statistical Association, 93, 1253–1259.
- Neumann, D. L., Hood, M., and Neumann, M. M. (2013), “Using Real-Life Data When Teaching Statistics: Student Perceptions of this Strategy in an Introductory Statistics Course,” Statistics Education Research Journal, 12, 59–70.
- Neyman, J., and Pearson, E. S. (1933), “On the Problem of the Most Efficient Tests of Statistical Hypotheses,” Biometrika, 20, 175–240.
- Pearson, K. (1900), “On The Criterion That A Given System Of Deviations From The Probable In The Case Of A Correlated System Of Variables Is Such That It Can Be Reasonably Supposed To Have Arisen From Random Sampling,” Philosophical Magazine Series 5, 50, 157–175.
- Pierson, S. (2013), “Growing Numbers of Stats Degrees,” AmStat News May, available at http://magazine.amstat.org/blog/2013/05/01/stats-degrees/.
- R Core team (2017), R: A Language and Environment for Statistical Computing, Vienna, Austria: R Foundation for Statistical Computing.
- Rosenthal, R. (1979), “The File Drawer Problem And Tolerance For Null Results,” Psychological Bulletin, 86, 638–641.
- Steel, E. A., Kennedy, M. C., Cunningham, P. G., and Stanovick, J. S. (2013), “Applied statistics in ecology: common pitfalls and simple solutions,” Ecosphere, 4, 1–15.
- Sterne, J. A. C., and Smith, G. D. (2001), “Sifting the Evidence—What's Wrong With Significance Tests?” Physical Therapy, 81, 1464–1469.
- Strauss, V. (2014), “How Much Bill Gate's Disappointing Small-Schools Effort Really Cost,” The Washington Post, available at https://www.washingtonpost.com/news/answer-sheet/wp/2014/06/09/how-much-bill-gatess-disappointing-small-schools-effort-really-cost/.
- Sutherland, W. J., Spiegelhalter, D., and Burgman, M. A. (2013), “Twenty Tips for Interpreting Scientific Claims,” Nature, 503, 335–337.
- Tintle N., Chance B. L., Cobb G. W., Rossman A. J., Roy S., Swanson T., and VanderStoep J. (2015), Introduction to Statistical Investigations, New York: Wiley.
- Tu, Y. K., and Gilthorpe, M. S. (2007), “The Most Dangerous Hospital or the Most Dangerous Equation?” BMC Health Services Research, 7, 185.
- Tversky, A., and Kahneman, D. (1974), “Judgment Under Uncertainty: Heuristics And Biases,” Science, 185, 1124–1131.
- Wainer, H. (2007), “The Most Dangerous Equation,” American Scientist, 95, 249–256.
- Wasserstein, R. L., and Lazar, N. A. (2016), “The ASA's Statement on p-Values: Context, Process, and Purpose,” The American Statistician, 70, 129–133
- Willet, J. B.. and Singer, J. D. (1992), “Providing a Statistical “Model”: Teaching Applied Statistics using Real-World Data,” in Statistics for the Twenty-first Century, eds. E. Gordon, and S. Gordon, Washington, DC: Mathematical Association of America, pp. 83–98.