
 ?Mathematical formulae have been encoded as MathML and are displayed in this HTML version using MathJax in order to improve their display. Uncheck the box to turn MathJax off. This feature requires Javascript. Click on a formula to zoom.
ABSTRACT
The cost and time of pharmaceutical drug development continue to grow at rates that many say are unsustainable. These trends have enormous impact on what treatments get to patients, when they get them and how they are used. The statistical framework for supporting decisions in regulated clinical development of new medicines has followed a traditional path of frequentist methodology. Trials using hypothesis tests of “no treatment effect” are done routinely, and the p-value < 0.05 is often the determinant of what constitutes a “successful” trial. Many drugs fail in clinical development, adding to the cost of new medicines, and some evidence points blame at the deficiencies of the frequentist paradigm. An unknown number effective medicines may have been abandoned because trials were declared “unsuccessful” due to a p-value exceeding 0.05. Recently, the Bayesian paradigm has shown utility in the clinical drug development process for its probability-based inference. We argue for a Bayesian approach that employs data from other trials as a “prior” for Phase 3 trials so that synthesized evidence across trials can be utilized to compute probability statements that are valuable for understanding the magnitude of treatment effect. Such a Bayesian paradigm provides a promising framework for improving statistical inference and regulatory decision making.
1 Introduction
There has been nearly uniform acceptance of in most fields of research since R.A. Fisher first made his statements about what he thought might be considered “statistically significant” evidence (Fisher Citation1926). Following the passage of the Kefauver-Harris Amendment to the Food, Drug and Cosmetic Act of 1962, drug manufacturers have been required to demonstrate “evidence [of effectiveness] consisting of adequate and well-controlled investigations, including clinical investigations … to evaluate the effectiveness of the drug involved” (Drug Amendment Act Citation1962). With the passage of the 1962 legislation, there were Congressional hearings and debates about the need for “adequate and well-controlled” trials, including topics such as randomization, whether placebo-controlled trials were ethical, and why investigators should be blinded to the study medication. During the years following the passage of the Act, FDA promulgated regulations that defined and set standards for these trial characteristics, while hiring statisticians to assess the adequacy of the evidence. The use of the null hypothesis significance testing (NHST) approach to compare treatments was adopted according to the prevailing customs in the canon of statistical methods.
In regulated drug development, the worldwide approach is to conduct a sequence of clinical studies, first establishing the safety of a new drug in small trials (Phase 1 trials). This is followed by treatment of larger groups of patients with various doses of the treatment under various durations and conditions to learn what might be most useful for a disease/condition of interest, referred to as Phase 2. Once there is an understanding of the right patient population(s) to treat and the doses that are safe and efficacious, clinical development moves into large-scale confirmatory trials (Phase 3) with the intent being to demonstrate clearly that the treatment is safe and effective when used as intended. Because of the Kefauver-Harris Amendment and its reference to “clinical investigations” (note the plural term), it generally is expected that drug sponsors will conduct at least two independent Phase 3 trials. Each trial is evaluated independently and declared a success or failure based on whether the trial achieves a statistically significant result (i.e., p < 0.05 in most cases). Both trials must be “successful” for a drug to be considered by a regulatory agency for review and approval. While the above is a general framework for drug development that helps put this work into context, there are a wide variety of drug development programs that may deviate from the Phase 1-2-3 paradigm, although the standard of evidence ( in two adequate and well-controlled trials) remains in place most often.
The adoption of a p-value < 0.05 for concluding “success” was also done as a convention and a matter of convenience in the paper and pencil era of the late 1960s and 1970s. This convenience was first noted by Fisher himself in 1925 when he wrote, “The value for which p = 0.05 is 1.96 or nearly 2; it is convenient to take this point as a limit in judging whether a deviation is to be considered significant or not” (Fisher Citation1925, p. 45). However, there is nothing that any of the authors of this report can find, after diligent review of Congressional hearings and documents or the FDA archives, that discusses or debates the level of evidence needed for drug approval or the standard by which that evidence is judged. Thus, the acceptance of fundamental concepts for what constitutes adequate, well-controlled investigations—use of placebo, blinding and randomization—that we take for granted today, were heavily debated 50 years ago. While these trial design characteristics are accepted today as the gold standard for generating credible evidence, the acceptable level of statistical evidence (p < 0.05) was, AND STILL IS, just a matter of tradition and convenience.
Using a decision criterion of p < 0.05, NHST ignores available evidence from sources external to each individual trial as well as the clinical context in which a decision is made. However, is it always reasonable to conclude that a treatment does not work after obtaining, for example, a p-value of 0.01 in one Phase 3 trial and a p-value of 0.08 in a second Phase 3 trial of the same treatment, that is, one “successful” trial and one “unsuccessful” trial? Furthermore, should the interpretation of two such trials—one success and one failure—be the same regardless of whether the trials are for a chronic, debilitating disease (e.g., rheumatoid arthritis) or a transient treatment of symptoms (e.g., dental pain)? In contrast to inferring whether a treatment works or not using NHST (and requiring 0.05 in two independent trials), imagine a world in which the approval of a new treatment—drug or biologic—is truly based on the probability that the treatment works according to the totality of the evidence and the clinical context. “That the treatment works” is subject to judgment, as is the probability level that is needed for approval. That takes some very hard thinking and lively discussion. But we should not shy away from this diligence and hide behind convenience. We posit that patients would accept a treatment that has a 50% probability of curing pancreatic cancer, while most might prefer a 95% probability that a treatment produces a 10 kg weight loss in one year. Those statements are much better suited for describing a treatment effect in a Bayesian paradigm. Moreover, the Bayesian paradigm seems ideally suited for synthesizing evidence from not only two Phase 3 trials but also the other trials conducted over many years in the drug development process, as well as other scientifically relevant evidence.
This paper sets the stage for Bayesian thinking for regulated drug development in Section 2. Section 3 provides a real and recent industry example with some specific details of how the Bayesian paradigm could be implemented when analyzing and interpreting Phase 3 clinical trials. Current uses of Bayesian approaches within FDA, as well as possible extensions of the Bayesian paradigm for regulatory decision making, are covered in Section 4. We end with further discussion in Section 5.
2 Bayesian Thinking for Drug Development
The debates about the suitability of a frequentist paradigm versus the Bayesian paradigm have been long-standing and, at times, acrimonious. There is abundant literature comparing and contrasting both approaches (Bayarri and Berger Citation2004; Christensen Citation2005; Inoue et al. Citation2005). Goodman (Citation1999) provides an excellent description of “the p-value fallacy,” and posits that the over-reliance on p-values “has almost eliminated our ability to distinguish between statistical results and scientific conclusions.” This could certainly be a criticism of current regulatory practice in which a p-value < 0.05 in pivotal trials is almost always a requirement for regulatory consideration, let alone approval, despite other supportive clinical trial evidence from earlier phases of drug development.
The Bayesian way of thinking and formal analytical approach seems ideally suited for the drug development process. The learn and confirm paradigm has been espoused in drug development (Sheiner Citation1997). The idea is to learn as much as one can about a new treatment, followed by well informed, confirmatory trials. This approach acknowledges that clinical drug development proceeds over many years. It is a continual sequence of learning studies and confirming, using ever larger samples sizes and different populations of subjects, gradually accumulating knowledge about the efficacy and safety of a novel treatment. Since this development proceeds over many years, additional scientific knowledge is also accumulating during that time—knowledge of the disease state, knowledge of molecular biology surrounding the mechanism of action of the treatment, genomics and additional data from animal experiments or other companies developing similar treatments. The advantage of the Bayesian approach is that it can formally incorporate prior data or external information into the analysis of the confirmatory trials.
It is important to note that this is not an attempt to “lower the bar” for substantial evidence of a treatment effect and may in some instances increase the evidentiary barrier to approval. For regulatory decision making, Bayesian analytical approaches can be rigorously prespecified to provide a formal mechanism utilizing information that comes from outside a single Phase 3 trial or can be used to synthesize information across Phase 3 trials. Information external to the Phase 3 study can be incorporated into a vague/diffuse prior or an informative prior, depending on the strength of evidence from such information related to the treatment effect. Such priors would need agreement and formal documentation with regulators in advance of Phase 3 trials. This is no different than the current practice for clinical trial analysis using frequentist approaches for which models and assumptions are agreed in advance. It is worth noting, however, that in the case of some difficult to treat diseases, such as Alzheimer’s Disease or sepsis, the history of failed clinical trials could result in a more skeptical prior that may lead to a more rigorous standard being applied to determine trial success.
The focus of this article is on the evaluation of efficacy at the completion of two Phase 3 trials. However, Bayesian approaches also seem ideally suited for use in interim analysis of clinical trials where data are accumulating within a clinical trial and decisions are made whether to continue or terminate that trial based on the data/evidence accumulated at that time. Also, safety considerations and analysis of adverse events plays a major role in drug development and regulatory decisions, but often is not the subject of rigorous hypothesis testing. The evaluation of adverse effects of a treatment seem amenable to Bayesian approaches, especially for less frequent adverse events. In any single clinical trial, the sample size may be insufficient to elucidate a treatment effect on an adverse outcome. Nevertheless, the accumulation of safety data across all phases of drug development can be used in formal Bayesian approaches to assess the probability that any particular adverse outcome is the result of an experimental treatment as well as the probability associated with any magnitude of that effect.
In summary, the Bayesian approach makes direct probability statements about the treatment effect itself, given the observed data. The inferential framework is more relevant to information needs of patients and prescribers, and in fact, all stakeholders of our healthcare system.
3 Industry Example
The frequentist paradigm is engrained in our scientific culture and implementation of regulated clinical research for new treatments. A Bayesian perspective in this realm is novel, and the following example illustrates how the drug development process and decision making could be modified to take this approach. The example is taken from real and recent experience in a pharmaceutical company. The sponsor asked that additional details about the drug and disease not be shared since there are proprietary elements of this example. We do not believe that withholding such information detracts substantially from the key points that we are seeking to illustrate.
Because the Bayesian approach requires the definition of a prior, its application should be considered upon initiation of the first efficacy clinical trials—generally before Phase 2. However, for simplicity and to illustrate how the Bayesian approach could replace NHST for confirmatory Phase 3 trials, the following example focuses on the analysis and interpretation of two Phase 3 trials, the priors for which are described below. While much of the methodology presented here is described in Spiegelhalter et al. (Citation2004), this example illustrates how the Bayesian approach can lead to better understanding and interpretation of clinical trial results that are considered conflicting or confusing under the frequentist paradigm. In that sense, the approach described herein serves as an informative contribution to the comparison of frequentist and Bayesian paradigms in a practical application with important consequences in drug development and approval.
The prior distribution of effect size for Phase 3 can be quantified from a variety of sources, which is one of the benefits of the Bayesian approach. Phase 2 results of the new treatment provide some direct evidence of its effect. In addition to randomized Phase 2 trials that include a comparator, either a placebo or an active treatment, qualified data from other trials outside the clinical development program of the new treatment can also be used. For simplicity, we will focus on placebo-controlled trials, although the concepts can be easily extended to trials with active comparators. Bayesian network meta-analysis (Greco et al. Citation2016) can be employed to synthesize data into a single posterior distribution of effect for both the new treatment as well as the placebo. Care must be taken to account for differences in study populations, duration of treatment, study design and other relevant factors when doing such meta-analysis.
The scientific context for this example is that a treatment from a competitor sponsor was approved recently by the FDA and on the market. That treatment had a very similar mechanism of action and was approved for the treatment of a disease and population of patients similar to what was intended by the sponsor for the experimental treatment in this example. The sponsor wanted to leverage data from the competitor treatment and scientific knowledge that was emerging in this disease area to skip Phase 2 and proceed with two Phase 3 trials.
When there is scant or no clinical data on the experimental treatment of interest, one can consider using appropriately discounted data from other treatments in the same class (e.g., treatments that have a similar mechanism of action, such as inhibition of the same/similar enzyme or binding to the same/similar cell surface receptor). There are also well-developed methods for “prior elicitation” (O’Hagan et al. Citation2006; Morris et al. Citation2014) in which experts can use animal data, disease state knowledge and other biological or medical knowledge to express their beliefs about the treatment effect in the form of a prior distribution of effect size. Finally, there are historical evaluations of a large number of new treatments and the success rates of such treatments in different disease states (Hay et al. Citation2014) that can provide insight into the development of a prior distribution.
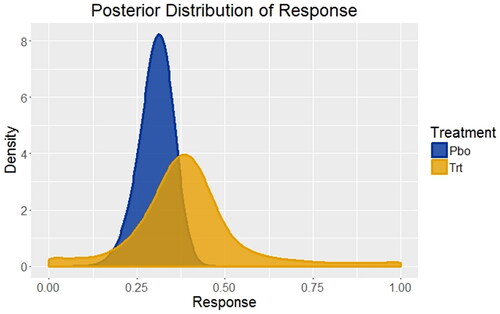
In this example, the primary response variable for this disease is the percentage of patients responding with a prespecified and clinically meaningful degree of improvement across a variety of disease symptoms. As noted previously, there were no Phase 2 studies of the experimental treatment, but two Phase 3 studies were available of an FDA approved and marketed competitor treatment with the same mechanism of action in the same disease state and patient population. There were also many studies in this disease state of other treatments compared to placebo. Using a Bayesian network meta-analysis, the posterior distribution of responses from those studies served as a foundation for development of a prior distribution of treatment responses for the Phase 3 studies of the experimental treatment versus placebo, as well as a very good estimate for the prior distribution of the placebo response (). Because placebo has been used in many studies, one can see that its posterior distribution of response has a much sharper peak (smaller variance) than the competitor treatment, which included only two studies.
Fig. 1 Distributions of treatment responses for placebo and an FDA approved and marketed competitor treatment based on systematic literature review and Bayesian network meta-analysis. For placebo (Pbo), the response rate is 30% with 95% credible interval (20%, 39%); for the competitor treatment (Trt) the response rate is 39% with 95% credible interval (7%, 82%). These are the starting points for developing the priors to be used for the Phase 3 trials of placebo versus the experimental treatment.
Credible prior distribution of response for the Phase 3 studies cannot, in general, be taken directly from the posterior distributions derived in . For example, the only experimental treatments that progress to Phase 3 studies are those that show a substantial effect in Phase 2 (i.e., statistically significant or medically meaningful). There is well-documented regression to the mean in which estimates of the treatment effect in Phase 3 studies tend to be smaller than those observed in Phase 2 studies of the same compound (Chuang-Stein and Kirby Citation2014). Also, there may be other causes for differences between the studies used for the posterior distribution described previously and the planned Phase 3 study of the experimental treatment that are not easily measured or defined. They include, but are not limited to, changes in medical care/practice that occur over time, differences in investigative sites chosen for the study (including a potentially different mix of countries in global Phase 3 trials), changes in patient inclusion/exclusion criteria or the precise definition of the primary endpoint.
Cumulatively, the reasons given above make it advisable to discount the derived posterior distribution of response () when creating the prior distribution of response for the planned Phase 3 trail, denoted ’(
. This can be accomplished easily with two different approaches. The first is to use a robust prior (Berger Citation1990) in which a mixture is used combining the posterior distributions derived from the data, π(m
, and a more skeptical or diffuse prior, π(m
. The latter prior of the mixture is chosen so that it is centered closer to the null hypothesis of no effect (skeptical) and has greater uncertainty or variability (diffuse). This is done to counter-balance the possibility of using a prior that is too optimistic, that is, too closely dependent on historical data. This can be written as
(1)
(1) where ε is the borrowing factor or mixing proportion. Another discounting approach is to use a power prior (Ibrahim and Chen Citation2000)
(2)
(2)
where
.
The choice of ε is based on the degree to which the Phase 3 study is similar to the other studies that were used to create , which is subjective. While the subjectivity may be considered a drawback to the Bayesian approach, the construction of the Phase 3 prior, including the choice of ε, can be debated and adjudicated by agreement with regulatory agencies prior to the commencement of the Phase 3 trials. For this analysis, ε was chosen to be 0.4 since there were many similarities between the studies of the competitor treatment and the experimental treatment, but no direct data on the experimental treatment. While analyses were done using both borrowing approaches, we present the results using the robust prior approach (EquationEquation 1
(1)
(1) ) since the results did not differ much between the two methods.
Lastly, the prior effective sample size for placebo and the competitor treatment are approximately 83 and 6, respectively. This is obtained by approximating the posterior distribution of the response rate of placebo and a competitor treatment by a beta distribution. The sum of the shape parameters of the beta distribution is used as the approximate effective sample size for the prior. The effective sample size can be used as an indicator of the “informativeness” of the prior, and the larger value for the placebo treatment shows that there is considerably more information to be gained using the prior for the placebo than using the prior for the competitor treatment (Morita et al. Citation2008).
In this example, there were two Phase 3 studies of the experimental treatment that included two different dose levels based on frequency of dosing—every 2-week dosing (Q2W) and every 4-week dosing (Q4W). The Q2W dose will be referred to as the high dose since twice as much of the experimental treatment is given in each 4-week period of treatment. The summary results are presented in . The placebo (PBO) responses for the two Studies were consistent with historical data that were used for creating the Phase 3 prior. The Q4W dose (lower dose) of the experimental treatment behaved consistently across trials and was very close to traditional statistical significance at the 0.05 level. The Q2W dose (higher dose) performed erratically; in Study 1, Q2W was slightly better than placebo and slightly worse than Q4W (i.e., not consistent with a dose-response relationship), while in Study 2, Q2W outperformed placebo and Q4W, exhibiting a dose–response relationship. Also, Q2W of this experimental treatment performed similarly in Study 2 to the synthesized effect size derived from the Bayesian network meta-analysis of the competitor treatment (38.4% versus 39%, respectively), as was anticipated prior to the initiation of the Phase 3 program.
Table 1 Results from two randomized, controlled, double-blind trials of two dose levels (every 4-week dosing—Q4W—and every 2-week dosing—Q2W) of an experimental treatment versus placebo. N = sample size; Responders were defined prospectively based on improvement in a variety of clinical symptoms. P-values were derived from logistic regression, taking prespecified covariates into account.
In the frequentist paradigm, such results present a conundrum. Strictly speaking, Study 1 did not achieve statistical significance and, therefore, is a failed study. Study 2 did achieve statistical significance for Q2W only, and therefore, was a successful study since the objective of the study was to demonstrate that at least one dose was significantly different from placebo. With the regulatory requirement to show replication in two adequate and well-controlled trials, the Phase 3 program, and thus, the experimental treatment, is technically a failure. Yet, there are very similar results for the Q4W effect across the two trials, and the p-values are so close to 0.05 that it is difficult to argue that the treatment has no effect.
Using the Bayesian paradigm with the prior distribution of treatment effect as described previously () with borrowing parameter ε = 0.4 (EquationEquation 1(1)
(1) ), the posterior distributions of treatment effect are shown in (Study 1) and (Study 2). From these distributions based on the Phase 3 data, the probability that there is a positive treatment effect can be computed easily, and the results are given in . At present, there are no conventions related to acceptable probability levels for a treatment effect to be considered a success, which could and should vary depending on the disease state severity or unmet medical need. Nonetheless, with probability levels exceeding 0.98, one could safely conclude that Study 2 shows a clear treatment effect at both dose levels, while Study 1 gives an inconsistent result between the two dose levels, especially since the higher dose (Q2W) has a lower probability of a treatment effect than the lower dose (Q4W) (0.805 versus 0.967, respectively). Also, in are results using smaller borrowing factors (i.e., relying less on historical data as a prior) for a sensitivity analysis. The results are unchanged, indicating that the prespecified borrowing factor is not a substantial determinant of the outcome.
Fig. 2a Posterior distributions of treatment effect for every 2-week dosing (Q2W) versus placebo (PBO) and every 4-week dosing (Q4W) versus placebo for Study 1.
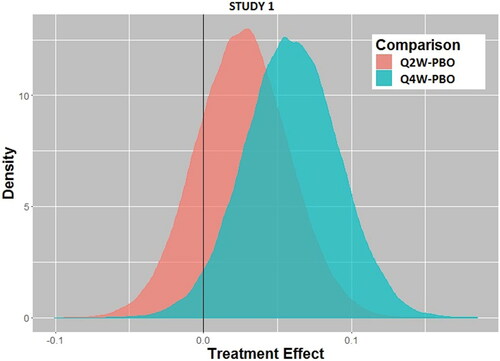
Fig. 2b Posterior distributions of treatment effect for every 2-week dosing (Q2W) versus placebo (PBO) and every 4-week dosing (Q4W) versus placebo for Study 2.
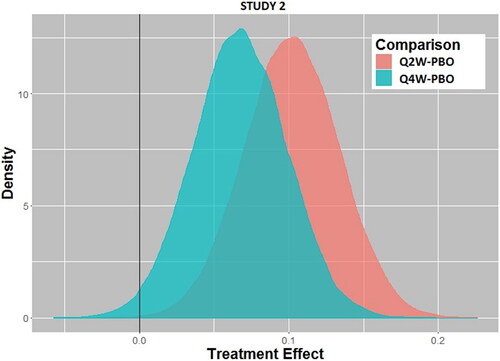
Table 2 Posterior probabilities of a positive treatment effect calculated from the posterior distributions of effect size for Study 1 and Study 2 using the prespecified borrowing factor (ε = 0.4) and sensitivity analysis using smaller borrowing factors (ε = 0.1, 0.2, 0.3).
In our quest to answer the fundamental question “What is the probability that the experimental treatment has a response different from the placebo response?” it is natural to consider the synthesis of data from both Phase 3 trials. This overall synthesis of the prior information and all Phase 3 data is quite natural in the Bayesian approach and allows for a single evaluation of the Phase 3 program and interpretation of the treatment effect that can be used for a regulatory decision. In this case, the posterior distribution from Study 1 could be used as the prior distribution for Study 2 to obtain an overall assessment of the treatment effect. If a borrowing factor of 0.9 is used for that prior distribution (consistent with the fact that Study 2 was identical to Study 1, but had a slightly different set of geographic sites), then the posterior distribution of treatment effect for each dose is shown in .
Fig. 3 Posterior distributions of treatment effect for every 2-week dosing (Q2W) and every 4-week dosing (Q4W) for Study 2 using the posterior distribution of treatment effect from Study 1 as the prior distribution for Study 2 with borrowing factor ε = 0.9.
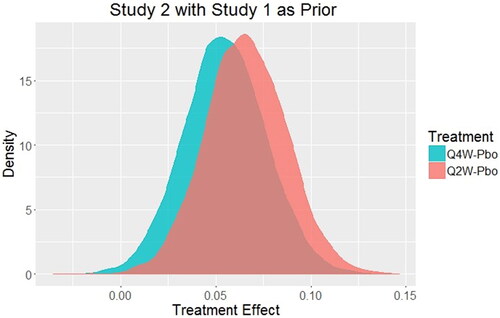
For Q4W versus placebo, the probability that there is a positive treatment effect is 0.995 while for Q2W that same probability is 0.999. Thus, it is unequivocal that both doses produce a positive treatment effect with this approach. Using the traditional NHST approach, the regulatory criteria are not officially met, and the frequentist approach struggles to have a comprehensive and coherent decision paradigm. In this real example, the sponsor decided not to spend the considerable time and effort of submitting this treatment for approval, in part, due to its low chance of clearing the regulatory hurdle. In contrast, what appeared to be confusing results from a frequentist analysis of two independent clinical studies is rendered more interpretable with the holistic Bayesian analysis [median effect (95% credible interval): Q4W – PBO = 0.0544 (0.0129, 0.0972); Q2W – PBO = 0.0656 (0.0249, 0.1080)].
It should be noted that if Study 2 was used as the prior for Study 1, with the same borrowing factor of 0.9, the posterior probabilities for the synthesized treatment effect are also greater than 0.99. There may be other approaches to the synthesis of all data/information to arrive at a single probability for the treatment effect, but we leave that to other creative thinkers involved in drug development and regulatory decision making.
There are other aspects of the treatment effect that are quantified easily in the Bayesian paradigm, once the posterior distribution of that treatment effect has been derived. For example, it is important to know the likelihood that the more frequent dose (Q2W) is more effective than the less frequent dose (Q4W). While the frequentist approach and the current regulatory paradigm assess trials separately and independently thereby giving a mixed result, using the Bayesian paradigm and the synthesized Phase 3 data, Pr(Q2W effect > Q4W effect) = 0.6532. This probability for greater effectiveness of Q2W can be weighed against increased risk of adverse events possibly seen with the high dose. Also, the probability of any chosen effect size can be calculated for clinicians to determine the likelihood of a clinically meaningful effect. shows the probabilities for a range of treatment effect sizes. From historical data on the FDA approved treatment for this disease (used in the meta-analysis previously described), the treatment effect was approximately 0.09. The results in show that this experimental treatment has a low probability of being more efficacious than the currently approved and marketed product.
Table 3 The probability of exceeding a treatment effect (E) for each dose group based on the posterior probability distribution for the combined Phase 3 trials.
Finally, in our example, some may be concerned with the disparity of the results for the Q2W dose group across the two studies, and such an observation alone may cast doubt on the credibility of the studies. The differences between Study 1 and Study 2 results for the Q2W dose were examined in great detail (e.g., all treatment groups were very well-balanced with respect to baseline demographics; drop-out patterns and missing data assumptions could not explain such a discrepancy). It is completely unclear as to why the placebo and Q4W responses were consistent across studies and the Q2W responses were not. With enough experience over many clinical trials, one will recognize that there are times when two identical studies run contemporaneously produce different results. One may be willing to accept the outcome of Study 2 as more consistent with expectations (e.g., similarity with historical data used in the network meta-analysis, consistent dose response, biologic plausibility) and, therefore, more representative of the truth. Based on that perspective, we have calculated the probability of observing an average response as small as that observed in Study 1 for the Q2W dose using the posterior distribution of effect for Q2W from Study 2. That probability is 0.0025, indicating that the Q2W response in Study 1 is very unusual and perhaps beyond the expectations of sampling variation from one study to the next.
In the authors’ views of this clinical development program, the totality of the evidence indicates with a high degree of certainty (>99%) that the experimental treatment produces a positive treatment effect. Of course, there are other considerations that are necessary for the approval of a new treatment: Is the treatment safe? Does the high dose (i.e., more frequent dosing regimen in this example) produce sufficiently more efficacy to warrant any potential increase in adverse effects that might accompany using the higher dose? However, the first question that needs to be answered is, “Does this treatment work?” or stated differently, “Does this treatment produce a response different from the placebo response?” An affirmative answer to this question opens the door for regulatory submission and review; if answered in the negative, then no such submission and review are possible. As such, obtaining the best answer to this question is very important to the sponsor and ultimately the patients who are waiting for new treatments. Lastly, sponsors must make the decision about seeking approval for a new treatment based on the treatment effect and its clinical utility. Even treatments that are shown to be highly likely to work (i.e., be different from placebo) based on rigorous clinical trials may not be worth the cost or adverse effects of the treatment in the context of clinical practice. Here again, the Bayesian paradigm can give quantitative probabilities related to a range of effect sizes as a natural interpretation of the posterior distribution of effect size ().
4 Regulatory Perspective
The acceptability of Bayesian approaches within the FDA differs across and within the various Centers. The Center for Devices and Radiologic Health (CDRH) has issued a formal guidance document (US Food and Drug Administration Citation2010) on the topic and has encouraged and engaged in numerous submissions of new products using a Bayesian approach as the definitive analysis to support decision making. The Center for Biologics Evaluation and Research (CBER) cosigned the CDRH guidance, and submissions using the Bayesian approach as the primary analysis have occurred and been accepted. CDRH regulates devices, and a strong argument can be made for accepting Bayesian approaches in that setting. If a device is approved for use, for example, then subsequent versions of that device involving engineering changes or software changes can rely heavily on the fact that the previous device worked as it was purported to do. Borrowing data/information from previous versions of a device for approval of subsequent versions of the same device is both scientifically sound and legal under the governing Federal statute and regulations (FDA 2018b), which differ somewhat from the statutes governing approval of new drugs. The use of Bayesian approaches is also used within CBER, which regulates vaccines. Approval of new vaccines may rely on well-established clinical data and repeatable manufacturing processes created from previous vaccine approvals. In fact, one might consider ignoring prior evidence when evaluating minor changes in a product—but still requiring approval—as unethical. This is not to say that Bayesian methods are used exclusively within these Centers; when novel devices or biologics are developed and submitted to FDA for approval, more traditional frequentist methods are often utilized.
The Center for Drug Evaluation and Research (CDER) has, to date, issued no guidance on Bayesian approaches, and rarely employs Bayesian inference as the definitive basis for concluding whether a drug has a positive treatment effect or not. In CDER, new therapeutic treatments for a wide variety of diseases are reviewed. Some of these treatments have biological mechanisms that are similar to others as multiple sponsors develop treatments based on their common knowledge of disease pathology. Other treatments have novel biological mechanisms of action as scientific discovery unveils new insights into disease processes. How or when to use prior information in this setting is less obvious, and decision-making criteria are more complex. Consequently, the application of Bayesian approaches has been controversial.
Space does not permit a full elaboration of specific possible uses of Bayesian approaches in clinical drug development, but we acknowledge some areas where such approaches have emerged or are emerging.
FDA has recognized the utility of Bayesian approaches in earlier phases of clinical drug development, the results of which are not directly involved in regulatory approval as with Phase 3 trials.
FDA has researched possible application in areas such as noninferiority trials (Gamalo et al. Citation2014). Noninferiority trials seek to confirm that an experimental treatment is no worse than an approved control treatment. The use of Bayesian approaches in noninferiority trials seems quite natural because the comparison of an experimental treatment versus an active control requires synthesizing data from historical trials of the active control agent. The final FDA Guidance on noninferiority trials acknowledges the potential utility of a Bayesian approach in this setting (US Food and Drug Administration Citation2016).
Bayesian methods for adaptive trials are of interest in some regulatory settings. The PREVAIL trial in Ebola provides one such example (Dodd et al. Citation2016; Proschan, Dodd and Price Citation2016). Furthermore, Bayesian trial designs are referenced in the recently released draft guidance from CDER on adaptive clinical trial designs, possibly opening the door to such methods in confirmatory trials (US Food and Drug Administration Citation2018a).
The use of Bayesian approaches in pediatric trials using adult data as a source of prior information is a logical opportunity (Goodman and Sladky Citation2005; Greenhouse and Seltman Citation2005). However, children are not merely smaller adults. When creating prior distributions of effect, one must consider not only dose adjustments due to smaller body mass, but also how children may differ in their absorption, metabolism and excretion of a treatment.
Using historical data on the natural progression of rare diseases as a source of prior information can be quite helpful since it is often difficult to recruit patients or even find sufficient numbers of patients to participate in trials of rare diseases.
Interest in Bayesian methods to inform regulatory decision making has been increasing in recent years, particularly when relevant prior data sources are available or the acquisition of new data carries difficulties, as in the situations mentioned above.
5 Discussion
The use of hypothesis testing and subsequent reliance on p-values for determining the success of a clinical trial has been engrained in the drug development and approval process for 50 years. Arguments in favor of this approach include having an objective, albeit arbitrary, criteria that create a level playing field for all sponsors seeking regulatory approval for marketing of their products. This well-worn path has created a cross-industry consistency that does streamline discussions between sponsors and regulators since it obviates the need for more complex and detailed conversations about definition of priors and a suitable posterior probability that the treatment works required for approval. Furthermore, time has taught us that the vast majority of treatments approved by FDA and other regulatory agencies around the world are effective. Indeed, the reason for withdrawal of treatments from the market are most often due to adverse events that emerge only after many thousands or even millions of patients take a new treatment. Thus, some regulators have argued that the system and inferential approach based on the frequentist paradigm has served our society well and supplanting it with a new paradigm should only be done with caution and careful study.
Such perspectives give less weight to the cost and time it takes to conduct Phase 3 trials that are treated as separate and independent entities. In an era where drug development is enormously expensive and takes many years, why would our research community throw out the body of knowledge about an experimental treatment and act as if Phase 3 trials are isolated entities unto themselves? If our society truly understood this process, would they not consider it puzzling and perhaps even wasteful? Furthermore, statisticians and others have acknowledged for decades that a p-value is not a measure of treatment effect since a large enough sample size can produce statistically significant results for arbitrarily small differences between an experimental treatment and a control. The advantage of the Bayesian approach is that it makes probability statements about the quantity of greatest interest to all members of society—the probability associated with any magnitude of the treatment effect, whether that magnitude be a difference from placebo or any agreed medically meaningful effect.
However, one needs to consider the operating characteristics of any paradigm in terms of producing not only Type 1, but also Type 2 errors—nonapproval of treatments that are indeed useful for patients—the latter being rarely a consideration in present day regulatory reviews. Balancing Type 1 and Type 2 errors presents a difficult challenge for the regulatory decision-making process. Perhaps our society would benefit from a more rigorous and formal use of a practical metric of public health value or a utility function. The utility function is the bridge between “what do I believe about the treatment effect” (expressed as a probability statement about the size of the treatment effect) and “what is the optimal decision” balancing the probability and cost of Type 1 and Type 2 errors (Müller et al. Citation2017; Ventz and Trippa Citation2015). From a regulatory approval perspective, such a utility function basis for approval decisions may be based on the societal cost of false-positive and false-negative decisions. Furthermore, it is logically dependent on the severity and burden of the disease on individual outcomes, the safety risks that patients are willing to take, and the overall social impact of the disease state. From a payer perspective (individual, insurance company or any other form of coverage), cost implications play a role as well. The probabilistic framework inherent in the Bayesian paradigm is well suited for such quantitative evaluations.
In our example, there were no Phase 2 studies of the experimental treatment that could have provided an informative prior for Phase 3 because the Sponsor chose not to do such studies influenced by cost and time considerations. This scenario is not uncommon in drug development. A sponsor may have approval for their treatment in one disease state, and for a second related disease state, the sponsor wants to proceed directly to Phase 3. Another situation is when a sponsor may be trailing a competitor in the race to the market and may assume the risk of selecting doses for Phase 3 without the benefit of Phase 2 trials to inform that selection. In such cases, sponsors routinely look to other treatments with the same mechanism of action for insights into the magnitude of the possible efficacy of the new treatment. The value of the Bayesian approach is to quantify explicitly how such information should be incorporated into a prior distribution. In doing so, we are not considering that the new treatment has the same efficacy as another treatment, but rather use the results on the other treatment as a starting point for borrowing the appropriate level of information from which we evaluate the current experimental treatment.
Some argue that there are subjective elements to the Bayesian approach, but that is one of the distinguishing positive features—it requires stating subjective assumptions clearly and quantifying them. Also, we should not be blind to the fact that there are assumptions and subjective choices related with frequentist methods as well (e.g., normal distribution, homoscedasticity, model selection, inclusion of covariates in a model as well as the arbitrary p-value itself). For those involved in clinical drug development, there is awareness of the many subjective decisions and agreements that are made with FDA or other global regulatory agencies through the numerous meetings and correspondences that happen over many years of development of an experimental treatment.
We present a practical approach that could be undertaken within the existing sponsor-regulatory interaction framework. Discussions and decisions about use of Phase 2 data, borrowing factors and external information from the evolving field of science or medicine could be thoughtfully reviewed and agreed before the initiation of a Phase 3 trial. Specifically, sponsors could propose which clinical trials of the experimental treatment or of treatments from other sponsors or even government research that may be included in a meta-analysis in order to develop a prior distributions of treatment response. The details of such meta-analysis, including statistical models and assumptions, could be agreed jointly by the sponsor and regulators. Based on the design of the Phase 3 trial (patient population, doses, duration, etc.), the similarity to previous trials could be evaluated and appropriate borrowing factors could be agreed upon for each treatment in the Phase 3 trial. Nonclinical data—from the sponsor, other pharmaceutical companies or the academic community—generated about the mechanism of action of the new drug, genetic factors or other molecular biology knowledge could be used to strengthen or weaken such borrowing factors. A different borrowing factor could be applied for placebo, active control treatment and the experimental treatment based on the strength of evidence for each. In this way, just as in current practice, statistical design and analysis methodologies for Phase 3 trials would be prespecified and levels of evidence agreed upon by all parties involved. Furthermore, prespecified sensitivity analyses using various priors, defined by the borrowing factor ε, could help evaluate the robustness of any conclusions. Thus, the current paradigm using Phases of drug development needs little overhaul, and the existing framework for regulatory interactions could remain the same, but the statistical content of such meetings would shift from frequentist to Bayesian approaches. There would be no major disruptions to existing practice, laws or regulations—merely a change in thinking, which, to date, has proven to be the most difficult of all.
Frequentist-based inference has dominated clinical trial design, conduct, analysis, and reporting since the advent of modern clinical trials in the 1940s. This paradigm has served a very useful role in bringing rigor to the evaluation of experimental treatments. Bayesian approaches offer the next generation of inferential thinking for decision making based on the probability of an effect size that synthesizes the most relevant available evidence and is calibrated by the severity of the disease state and the burden of disease on individual patients and on society as a whole. Thanks to breakthroughs in efficient computing algorithms, faster computers and more accessible software tools, Bayesian computations are now tractable (Lee and Chu Citation2012). The use of Bayesian approaches by the statistical and medical communities in the biopharmaceutical industry, medical product regulatory agencies and academia are only constrained by our history and our comfort in operating the way we have always done so. The conversion to a Bayesian paradigm is possible through meaningful dialog amongst industry and regulatory scientists within the current legal and regulatory framework of the FDA and other global regulatory agencies. We hope this article has helped to highlight the value of a Bayesian approach as well as the practical steps on a path forward.
Supplemental Material
Download ()Acknowledgments
We are thankful to the Reviewers, Associate Editor and Editor who have made substantive comments that have improved the content and the flow of the manuscript considerably.
Related Research Data
References
- Bayarri, M. J., and Berger, J.O. (2004), “The Int88erplay of Bayesian and Frequentist Analysis,” Statistical Science, 19(1), 58–80. DOI: 10.1214/088342304000000116.
- Berger, J. O. (1990), “Robust Bayesian Analysis: Sensitivity to the Prior,” Journal of Statistical Planning and Inference, 25(3), 303–328. DOI: 10.1016/0378-3758(90)90079-A.
- Christensen, R. (2005), “Testing Fisher, Neyman, Pearson, and Bayes,” The American Statistician, 59 (2), 121–126. DOI: 10.1198/000313005X20871.
- Chuang-Stein, C., and Kirby, S. (2014), “The Shrinking or Disappearing Observed Treatment Effect,” Pharmaceutical Statistics, 13 (5), 277–280. DOI: 10.1002/pst.1633.
- Dodd, L. E., Proschan, M. A., Neuhaus, J., Koopmeiners, J. S., Neaton, J., Beigel, J. D., Barrett, K., Lane, H. C., Davey, R. T., Jr. (2016), “Design of a Randomized Controlled Trial for Ebola Virus Disease Medical Countermeasures: PREVAIL II, the Ebola MCM Study,” The Journal of Infectious Diseases, 213, 1906–1913. DOI: 10.1093/infdis/jiw061.
- Drug Amendments Act of 1962, Public Law 87–781, 76 STAT 780, available at http://prescriptiondrugs.procon.org/sourcefiles/1962Amendments.pdf
- Fisher, R. A. (1925), Statistical Methods for Research Workers, Edinburgh, Scotland: Oliver & Boyd, p. 45.
- Fisher, R. A. (1926), “The Arrangement of Field Experiments,” Journal of the Ministry of Agriculture of Great Britain, 33, 503–513.
- Gamalo, M. A., Tiwari, R. C., and LaVange, L. M. (2014), “Bayesian Approach to the Design and Analysis of Non-inferiority Trials for Anti-infective Products,” Pharmaceutical Statistics, 13(1), 25–40. DOI: 10.1002/pst.1588.
- Goodman, S. N. (1999), “Toward Evidence-Based Medical Statistics. 1: The P Value Fallacy,” Annals of Internal Medicine, 130, 995–1004. DOI: 10.7326/0003-4819-130-12-199906150-00008.
- Goodman, S. N., and Sladky, J. T., (2005), “A Bayesian Approach to Randomized Controlled Trials in Children Utilizing Information From Adults: The Case in Guillian-Barré Syndrome,” Clinical Trials, 2, 305–310. DOI: 10.1191/1740774505cn102oa.
- Greco, T., Landoni, G., Biondi-Zoccai, G., D’Ascenzo, F., and Zangrillo, A. (2016), “A Bayesian Network Meta-analysis for Binary Outcome: How To Do It,” Statistical Methods in Medical Research, 25(5), 1757–1773. DOI: 10.1177/0962280213500185.
- Greenhouse, J. B., and Seltman, H. (2005), “Using Prior Distributions to Synthesize Historical Evidence: Comments on the Goodman-Sladky Case Study of IVIg in Guillian-Barré Syndrome,” Clinical Trials 2, 311–318. DOI: 10.1191/1740774505cn095oa.
- Hay, M., Thomas, D. W., Craighead, J. L., Economides. C., and Rosenthal. J. (2014). “Clinical Development Success Rates for Investigational Drugs,” Nature Biotechnology, 32(1), 40–51. DOI: 10.1038/nbt.2786.
- Ibrahim, J. G., and Chen, M. H. (2000), “Power Prior Distributions for Regression Models,” Statistical Science, 15(1), 46–60. DOI: 10.1214/ss/1009212673.
- Inoue, L.Y.T., Berry, D.A., and Parmigiani, G. (2005), “Relationship Between Bayesian and Frequentist Sample Size Determination. The American Statistician, 59 (1), 79–87. DOI: 10.1198/000313005X21069.
- Lee, J. J., and Chu, C. T. (2012), “Bayesian Clinical Trials in Action,” Statistics in Medicine, 31(25), 2955–2972. DOI: 10.1002/sim.5404.
- Morita, S., Thall, P.F., Mueller, P. (2008), “Determining the Effective Sample Size of a Parametric Prior.” Biometrics, 64, 595–602. DOI: 10.1111/j.1541-0420.2007.00888.x.
- Morris, D. E., Oakley, J. E. and Crowe, J. A. (2014), “A Web-based Tool for Eliciting Probability Distributions From Experts,” Environmental Modelling & Software, 52, 1–4. DOI: 10.1016/j.envsoft.2013.10.010.
- Müller, P., Xu, Y., and Thall, P. F. (2017), “Clinical Trial Design as a Decision Problem,” Applied Stochastic Models in Business and Industry, 33 (3), 296–301. DOI: 10.1002/asmb.2222.
- O’Hagan, A., Buck, C., Daneshkhah, A., Eiser, J., Garthwaite, P., Jenkinson, D., Oakley, J., and Rakow, T. (2006), Uncertain Judgements: Eliciting Experts’ Probabilities. West Sussex, England: Wiley.
- Proschan, M. A., Dodd, L. E., and Price, D. (2016), “Statistical Considerations for a Trial of Ebola Virus Disease Therapeutics,” Clinical Trials, 13(1), 39–48. DOI: 10.1177/1740774515620145.
- Sheiner, L. B. (1997), “Learning Versus Confirming in Clinical Drug Development,” Clinical Pharmacology and Therapeutics, 61, 275–291. DOI: 10.1016/S0009-9236(97)90160-0.
- Spiegelhalter, D. J., Abrams, K. R., Myles, J. P. (2004), Bayesian Approaches to Clinical Trials and Health-Care Evaluations, West Sussex, England:Wiley.
- US Food and Drug Administration (2010), Guidance for the Use of Bayesian Statistics in Medical Device Clinical Trials, available at http://www.fda.gov/MedicalDevices/DeviceRegulationandGuidance/GuidanceDocuments/ucm071072.htm
- US Food and Drug Administration (2016), Non-Inferiority Clinical Trials to Establish Effectiveness, available at http://www.fda.gov/Drugs/GuidanceComplianceRegulatoryInformation/Guidances/default.htm
- US Food and Drug Administration (2018a), Adaptive Designs for Clinical Trials of Drugs and Biologics, available at https://www.fda.gov/downloads/drugs/guidances/ucm201790.pdf
- US Food and Drug Administration (2018b), Labeling for Inter Fix Threaded Fusion Device, available at https://www.accessdata.fda.gov/cdrh_docs/pdf/P970015C.pdf
- Ventz, S., and Trippa, L. (2015), “Bayesian Designs and the Control of Frequentist Characteristics: A Practical Solution,” Biometrics, 71 (1), 218–226. DOI: 10.1111/biom.12226.