
Abstract
Xanthates are commonly used collectors in flotation processes but are highly toxic to the aquatic environment. However, there are few methods for reliable determination of low xanthate concentrations in water samples. In this work, a sensitive, selective, and fast method is presented for the determination of potassium ethyl xanthate (KEX). KEX was determined by high-performance liquid chromatography–inductively coupled plasma–mass spectrometry (HPLC-ICP-MS/MS) directly and as diethyl dixanthogen [(EX)2] after oxidation with triiodide. The HPLC method was optimized for (EX)2 and the separated compounds were detected by ICP-MS/MS. The ICP-MS/MS was used in mass-shift mode using O2 as the cell gas and S+ was measured as SO+ to reduce spectral interferences. Detection limits of 88 µg L−1 for KEX and 20 µg L−1 for (EX)2 calculated from the peak area were obtained using mass-shift 32S+ → 32S16O+. No significant matrix effects were present when spiking experiments of (EX)2 were done to a sample collected from the tailings of a flotation process. The developed method demonstrates the potential of the HPLC-ICP-MS/MS for the determination of ethyl xanthate. This method may be extended to analyzing other xanthates and similarly structured sulfur containing collectors.
Introduction
Xanthates (ROCS2−) are organosulfur compounds used as collectors in flotation processes of sulfide minerals (Bulatovic Citation2007). Xanthates are widely used collectors because of their high selectivity, mineral recovery, and low dosage requirements (Kemppinen et al. Citation2015). Alkali metal xanthates such as potassium ethyl xanthate (KEX), sodium isobutyl xanthate (SIBX), and potassium amyl xanthate (PAX) are commonly used due to their low cost. However, xanthates and their degradation products are toxic, especially to the aquatic environment both acutely and long-term. The environmental concern is mostly related to the formation of carbon disulfide (CS2) (Bach et al. Citation2016).
Xanthates are mostly consumed in the flotation process, but residues are left in the tailings. Recently, there has been discussion that the maximum concentrations of the xanthates and their decomposition products emitted to the environment should be reduced which demands more sensitive and reliable methods for the determination of xanthates in water samples (Bach et al. Citation2016). For example, in the United States and Canada, the recommended release limit for CS2 has been decreased from 10 to 1 ppm (Occupational Safety and Health Administration and United States Department of Labor Citation2019). In addition to environmental concerns, the residues of xanthates and their degradation products cause difficulties in the flotation process. Reusing process water is desirable because reducing freshwater intake is both sustainable and cost effective. Residues of xanthates in the recycled water weaken the selectivity of the flotation (Liu et al. Citation2015; Kemppinen et al. Citation2015; Muzinda and Schreithofer Citation2018).
Xanthates are easily decomposed in aqueous solution. Their decomposition rate and mechanism depend strongly on pH: When the pH decreases, the decomposition rate increases. In acidic or neutral conditions, the most common decomposition products of xanthates are CS2 and the corresponding alcohol (Bulatovic Citation2007). In basic solutions, decomposition rate decreases and other products, such as carbonates and sulfides, are formed (Shen et al. Citation2016). In recent studies, ultraviolet radiation, ozonation (Fu et al. Citation2020), and dissolved metal ions (Shen et al. Citation2019a; Shen et al. Citation2019b) such as Fe3+, have increased the decomposition rate. Xanthates also oxidize to dixanthogens. Dixanthogens are dimers of xanthates that have low solubility in water and are more stable than xanthates (Bulatovic Citation2007).
Traditionally, titration (Luukkanen et al. Citation2003) and spectrophotometry (Hao et al. Citation2008) have been used for the determination of xanthates. For example, xanthates were titrated with AgNO3 and a Ag-selective electrode was used to determine the end point. This method was used for on-line monitoring of the process waters which required determination of concentrations in the mg L−1 range (Luukkanen et al. Citation2003). The xanthate concentration in the tailings is typically from 0.2 to 1.2 mg L−1 but may vary (Li et al. Citation2015). For example, the residual xanthate in the Boliden Kevitsa mine varied from 1 to 9 mg L−1 depending on the temperature and the sunlight (Muzinda and Schreithofer Citation2018). Spectrophotometric methods are also typically used for process monitoring. Hao et al. (Citation2008) performed the direct online monitoring of xanthates using the absorbance maximum at 301 nm. Traditional methods have been recently improved by coupling with other techniques: Cordeiro et al. (Citation2010) added hydrochloric acid to xanthate solutions in order to decompose xanthates into CS2 that was determined by gas diffusion by its absorbance at 206 nm. The detection limits of spectrophotometric methods vary from 40 to 160 µg L−1 and their applications are usually limited because of interferences from the matrix components. These methods are also only capable of measuring the total concentration of the xanthates.
Selective determination of xanthates has previously been done by high-performance liquid chromatography (HPLC). These applications have included both normal- and reversed phase, as well as ion-pair chromatography (Zhou, Bahr, and Schwedt Citation1989; Zhou, Bahr, and Schwedt Citation1990; Weissmahr, Houghton, and Sedlak Citation1998; Hao, Silvester, and Senior Citation2000). However, there are no recent studies that apply HPLC for the determination of xanthates. Recently, capillary electrophoresis (CE) has been used for selective xanthate determination. The detection limits were as low as 10 µg L−1 (for ethyl xanthate), but the procedures were time consuming with total analysis times from 15 to 20 min (Sihvonen et al. Citation2014; Kemppinen et al. Citation2015).
In most applications, the determination of xanthates is based on molecular absorption. Inductively coupled plasma–mass spectrometry (ICP-MS) offers more sensitive and selective detection based on monitoring elemental sulfur. ICP-MS is widely used for the elemental analysis of a variety of samples. This technique is fast, sensitive, and capable of multielement analysis (Giner Martínez-Sierra et al. Citation2015).
Previously, spectral interferences for the determination of sulfur using ICP-MS have been difficult to overcome. Especially the major isotope 32S (94.99% abundance) suffers from an interference due to 16O2+ when low resolution ICP-MS is used. The spectral interferences are now resolved by high resolution ICP-MS or by tandem mass spectrometry (MS/MS). MS/MS utilizes a reaction cell between two quadrupoles. Sulfur reacts with oxygen producing SO+ ions measured at m/z 48. The first quadrupole is set to m/z 32 removing ions that cause interferences to the SO+ detection such as 48Ti and 48Ca (Giner Martínez-Sierra et al. Citation2015). Similar methods for removing interferences in the determination of sulfur-containing molecules have been used for pharmaceutical applications such as metabolite profiling (Jensen et al. Citation2004; Klencsár et al. Citation2018; Kroepfl et al. Citation2019).
In this work, a novel HPLC-ICP-MS/MS method is described for the determination of xanthates. HPLC-enabled selective separation of xanthates was employed with ICP-MS/MS as a sensitive, element selective detector. Potassium ethyl xanthate (KEX) solutions were analyzed directly and as diethyl dixanthogen after oxidation with triiodide. The HPLC-ICP-MS/MS conditions were optimized and compared to those for HPLC-UC.
Experimental
Materials and reagents
Gradient grade methanol and n-hexane were purchased from Honeywell (Seelze, Germany). Analytical grade iodine and potassium iodide were purchased from Merck (Darmstadt, Germany) and used for preparing triiodide in water. Ethyl xanthate solutions were prepared from solid potassium ethyl xanthate (≥97.0%; Alfa Aesar, Kandel, Germany) and stored in a refrigerator. A stock solution of 1000 mg L−1 KEX was prepared from the solid and working solutions were prepared from the stock. Working solutions were prepared daily and the stock solution was used for a maximum of two days. Diethyl dixanthogen (≥98.0%; MedChemExpress, NJ, USA) was used for verification and validation of the method. A stock solution of (EX)2 was prepared from the solid reagent in methanol. Analytical grade ammonium hydroxide (25%, Merck, Darmstadt, Germany) was used for pH adjustment and stabilization of KEX solutions. A sulfur standard solution (1000 µg mL−1, AccuStandard, New Haven, CT, USA) was used for preparing 50 µg L−1 S for the optimization of the ICP-MS/MS conditions. All solutions were prepared in ultra-pure 18 MΩ cm water purified by a Millipore Gradient system (Millipore, Billerica, MA, USA).
Instrumentation
A 1260 II HPLC System (Agilent Technologies, Santa Clara, CA, USA) was employed for the separation of xanthates. The HPLC consisted of a Bioinert 1260 II pump, a multicolumn thermostat, and a variable wavelength detector (VWD). Samples were introduced with a 1100 Series autosampler (Agilent Technologies). The HPLC system was equipped with a Poroshell 120 EC-C18 (2.1 × 50 mm), 2.7 µm particle size column for reversed-phase separation. The HPLC conditions were optimized to achieve suitable resolution, sensitivity, and total run time. Water-methanol (20:80, vol/vol) was used as a mobile phase with isocratic elution. The flow rate of the mobile phase was 0.4 mL min−1, the injection volume was 6 µL, and the column compartment was maintained at 20 °C.
The VWD was used for the determination of diethyl dixanthogen and ethyl xanthate at 240 and 301 nm, respectively. The stop-flow technique was used for measuring the absorption spectra of the peaks during the HPLC analysis. The blank spectrum was measured from the baseline. Next, the mobile phase flow rate was set to zero before the peak of interest to stabilize the concentration in the flow cell. The spectra were collected from 190 to 400 nm.
A 8900 triple quadrupole ICP-MS (Agilent Technologies) was used for the determination of xanthates based upon the detection of sulfur after the HPLC separation. The instrument was equipped with a concentric MicroMist nebulizer, Scott-type spray chamber (Peltier-cooled, 2 °C), quartz torch (1.5 mm id injector), and an x-lens. To prevent carbon build-up, 20% O2/80% Ar (≥99.999%) was added to the sample introduction. The ICP-MS was operated in tandem mass spectrometry mode using O2 (≥99.999%) as the reaction gas. All gases were purchased from Linde Gas (Espoo, Finland). Instrumental parameters were optimized for highest sensitivity and lowest background for the determination of 32S as 32S16O+. Typical ICP-MS operating conditions are shown in . The data acquisition was done in time resolved analysis mode (TRA) and the total acquisition time was 4 min based upon the HPLC analysis.
Table 1. Triple quadrupole ICP-MS operating conditions.
Sample preparation
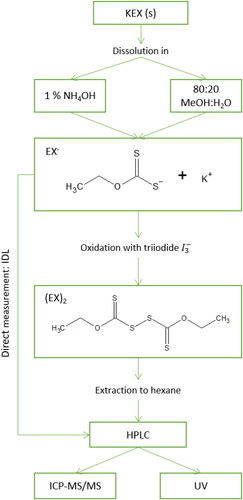
The sample pretreatment was adapted from Zhou, Bahr, and Schwedt (Citation1989, Citation1990). KEX samples were prepared by dissolving the powder into either methanol-water solution (85:15, vol/vol) or 1% (vol/vol) NH4OH. The latter was used for the direct determination of KEX. The former solution was oxidized by the dropwise addition of triiodide solution (0.010 M I2, 0.20 M KI). Triiodide solution was added until yellow color persisted in the solution. The color change indicated excess oxidant. Oxidized sample was extracted by an equal volume of n-hexane. Typically, 2.5 mL of both KEX solution and hexane were used. One milliliter of sample was pipetted to the HPLC vial from the hexane layer. Blanks were prepared and analyzed similarly to samples except without the addition of KEX. The complete method, presented in , consisted of the sample pretreatment, separation of the sample components by HPLC, and detection by ICP-MS/MS or spectrophotometry.
Figure 1. Schematic of the method for the determination of potassium ethyl xanthate (KEX). EX− is ethyl xanthate anion and (EX)2 is diethyl dixanthogen.
Validation
The HPLC performance was evaluated by the resolution between diethyl dixanthogen and the previously eluted unknown based upon the retention times (t) and peak widths (w) of the compounds by: R = 2(t(EX)2 − tx)/w(EX)2 + wx.
The linearity, sensitivity, and instrumental limits of detection (LOD) and quantitation (LOQ) were determined for KEX and (EX)2 by HPLC-UV and HPLC-ICP-MS/MS. Both peak height and area were used in the data analysis. The linearity and sensitivity were determined by analyzing standard solutions containing 0, 100, 250, 500 and 1000 µg L−1 of KEX with linear regression. For (EX)2, the same standard concentrations, also including a 50 μg L−1 standard, were used. Each standard was measured 4 times by ICP-MS/MS and 5 times by spectrophotometry. The limit of detection was calculated as 3 times the standard deviation of the calibration curve intercept divided by the slope of the calibration curve. The limit of quantification was calculated similarly to the limit of detection except using 10 as the multiplier. The standard deviation of the intercept (sa) was calculated by sa = sy/x √((Σxi2)/(nΣ(xi-x̄)2)), where sy/x is the residual standard deviation (Miller and Miller Citation2010).
Results and discussion
Identification
Xanthates and their derivatives absorb radiation in the ultraviolet. Xanthates have narrow absorption maxima at 225 and 301 nm. For dixanthogens, the absorption spectrum has less distinctive maxima giving more variation between the literature sources. These maxima are typically reported to be at 240 and from 280 to 290 nm (Pomianowski and Leja Citation1963; Jones and Woodcock Citation1986; Montalti, Fornasiero, and Ralston Citation1991; Fontenele et al. Citation2007). The absorption spectra of the xanthates are identical so the xanthates cannot be identified by this approach.
KEX and (EX)2 standard solutions (10 mg L−1) were analyzed directly by HPLC-UV in 1% NH4OH and 20:80 H2O-methanol. The KEX samples were also analyzed after the pretreatment step. The resulting chromatograms are shown in . The compounds were identified based on the absorption spectra of the corresponding chromatographic peaks: The first peak at 0.56 min with absorption maxima at 224 and 302 nm was identified to be ethyl xanthate. Diethyl dixanthogen was eluted at 2.8 min and the absorption maxima were at 238 and 286 nm. The values in this study were in agreement with the literature and verify that (EX)2 is formed in the sample pretreatment (Pomianowski and Leja Citation1963; Jones and Woodcock Citation1986; Montalti, Fornasiero, and Ralston Citation1991; Fontenele et al. Citation2007).
Figure 2. Typical chromatograms and absorption spectra for ethyl xanthate (EX−) in NH4OH, diethyl dixanthogen (EX)2 in hexane, and KEX sample after pretreatment in hexane. The initial KEX and (EX)2 concentrations were 10 mg L−1. The chromatograms employed ultraviolet-detection at 301 nm for EX− and at 240 nm for (EX)2 and the pretreated sample.
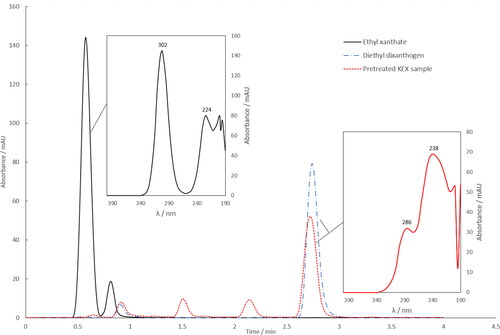
The sample pretreatment was found challenging because of the instability of xanthate solutions: In addition to diethyl dixanthogen, other compounds were also observed from the chromatograms after the oxidation reaction as shown in . The compound at a retention time of 1.5 min is suspected to be xanthic acid due to its absorption spectrum which had a maximum at 272 nm. However, these compounds were not studied further. It is also not clear which of these products are caused by the degradation of the solid or dissolved KEX, the side reactions during the oxidation step, or the degradation of dixanthogen.
Optimization of ICP-MS/MS parameters
The ICP-MS/MS conditions were first optimized with traditional sample introduction system by nebulizing sulfur standard in 20:80 H2O:methanol (vol/vol) which matched the mobile phase. Optimized parameters included flow rates of nebulizer, cell, and optional gas, as well as the sampling depth and integration time/mass. The intensities of blank and 50 µg L−1 S standard were monitored and all parameters were optimized one at a time. The sensitivities and background equivalent concentrations (BEC) were calculated from the intensities and the parameter values were chosen so that high sensitivity and low BECs were achieved.
Sampling depths from 8 to 13 mm were studied and the sensitivity increased with decreasing sampling depth. However, lower BEC values were obtained with higher sampling depths. Lower sampling depths produced less stable signals. Therefore, 10 mm was determined to be the optimal sampling depth. For nebulizer flow rate, values from 0.3 to 0.6 mL min−1 were studied, and 0.52 mL min−1 was selected due to the distinct sensitivity maximum. The BEC was not as significantly affected as the sensitivity, but its minimum was at 0.5 mL min−1.
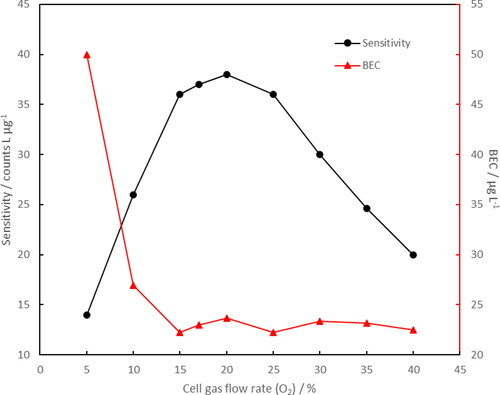
The optimization results for the cell gas (O2) are shown in . If the cell gas flow rate was lower than 10% (maximum value 1.5 mL min−1), the BEC increased while the sensitivity significantly decreased because the reduced kinetic energy and the quantity of O2 in the reaction cell, which degraded the efficiency of SO+ formation. Higher cell gas flow rates did not affect the BEC. Fifteen percent was selected to be the cell gas flow rate because higher values produced only minor improvement in the sensitivity. Changing the optional gas flow rate had similar effects as the cell flow rate. The BEC remained relatively stable from 10% to 30% (maximum value 1 L min−1). The flow rate was set to 20% due to the favorable sensitivity. The optional gas flow rate was also relatively high in order to reduce carbon build up on the cones.
Figure 3. Optimization of ICP-MS/MS cell gas (O2) flow rate. The flow rate is provided as percentage of its maximum value of 1.5 mL min−1. A 50 µg L−1 S standard in 80:20 methanol:H2O (vol/vol) was used for optimization.
Integration time per m/z was studied from 0.1 to 0.5 s. Increasing the integration time improved the sensitivity because of the longer time used for ion counting by the detector. However, the influence on the BEC was insignificant. When optimizing the integration time, the HPLC run was also considered. Increasing the integration time decreased the number of data points across the chromatographic peak. Therefore, 0.4 s was selected as a compromise for sensitivity and peak shape.
Optimization of separation
The HPLC method was optimized for the determination of diethyl dixanthogen on the bases of mobile phase composition, flow rate, and injection volume. The optimized HPLC conditions were employed with both detectors.
The mobile phase consisted of ultra-pure water and methanol. The water composition was varied from 10 to 30% (vol/vol) and flow rate from 0.30 to 0.45 mL min−1. shows decreasing the water composition reduced the retention time and increased the peak height for (EX)2. However, this decrease also lowered the resolution between dixanthogen and the interfering peaks. Similar but less significant effects were observed when varying the mobile phase flow. The best resolution was obtained with 0.40 mL min−1 and 70:30 methanol-H2O. However, these conditions resulted in significant loss in peak height. The lowest retention time and highest peak were obtained with a 0.32 mL min−1 flow rate and 90:10 methanol-H2O which also resulted in poor resolution.
Table 2. Influence of mobile phase flow rate and composition on the retention time, resolution, and peak height of diethyl dixanthogen (EX)2.
The eluent composition and flow rate were also compromised by the ICP-MS/MS coupling. Coupling the HPLC to the ICP-MS/MS required longer tubing which lowered the resolution of the peaks. Hence, the water composition is higher and flow rate lower than when ultraviolet detection was used. Therefore, 20:80 H2O:methanol (vol/vol) was chosen to be the mobile phase composition and 0.4 mL min−1 the flow rate. The compromise conditions resulted in total analysis time of 4 min.
Injection volumes between 4 to 12 µL were tested. Increasing the volume enhanced the peak height and area which improved the sensitivity of the measurement. However, when the volume was varied from 4 to 12 µL, the peak area increased 200% while peak height increased by 59%. This was due flattened and wide peaks, so 6 µL was selected to be the optimum injection volume.
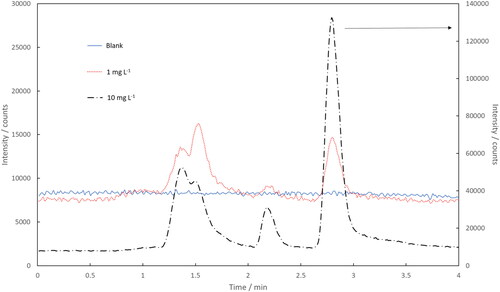
The optimized HPLC method was coupled with ICP-MS/MS using the optimized conditions. shows the optimized HPLC-ICP-MS/MS chromatograms for a blank and samples pretreated with initial KEX concentrations of 1 and 10 mg L−1 (m/z 32 → 48). Both 32S16O+ and 34S16O+ were measured and both sulfur isotopes resulted in identically shaped chromatograms. Signal intensity was significantly lower using 34S which was expected due to its low natural abundance (4.25%).
Figure 4. Chromatograms of blank, 1 and 10 mg L−1 ethyl xanthate after pretreatment by HPLC-ICP-MS/MS. Intensities of blank and 1 mg L−1 samples are shown in the left y-axis and 10 mg L−1 in the right y-axis. The chromatograms were obtained in the MS/MS-mode using the mass-shift 32 → 48.
Comparison of HPLC-UV and -ICP-MS/MS
Instrumental detection limits were determined for both KEX and (EX)2 with direct measurements of standards without sample pretreatment. The limits of detection were obtained for 1% NH4OH for KEX and from 20:80 water-methanol for (EX)2. Basic conditions stabilized KEX giving more reproducible results. However, these conditions are compromised by co-eluting impurities. Ethyl xanthate elutes early with sulfate and possibly other small, ionic sulfur containing species which caused higher blanks for ICP-MS/MS. Other solvents such as methanol and acetone were free of these impurities, but resulted in rapid decomposition of KEX. Additional signals due to impurities were not observed in the (EX)2 solution.
The limits of detection for (EX)2 and KEX were 20 (peak area) and 38 µg L−1 (peak height) by ICP-MS/MS, respectively. Corresponding values using UV-detection were 7.8 and 52 µg L−1. The detection limits and the calibration relationships of ICP-MS/MS and UV methods are shown in . The calibration relationships were linear for both compounds and detection methods. The (EX)2 measurements gave excellent R2 values (> 0.999). The HPLC method was developed for the determination of (EX)2 and not for KEX, which most likely explains these results. Additionally, peak area is preferably used for quantitation because of the lower (EX)2 detection limits but slightly increases in the KEX values.
Table 3. Analytical figures of merit for the determination of potassium ethyl xanthate (KEX) and diethyl dixanthogen ((EX)2).
The detection limits were compared to those obtained in previous studies in . The detection limits are comparable with other selective methods, including capillary electrophoresis (CE) and anion interaction chromatography (Hao, Silvester, and Senior Citation2000; Sihvonen et al. Citation2014). These methods, however, did not achieve comparable detection limits as headspace gas chromatography with electron capture detector (HS-GC-EDC). Nonselective HS-GC-EDC was employed to determine butyl xanthate in surface and drinking water (Li et al. Citation2015).
Table 4. Comparison of detection limits for xanthates.
ICP-MS/MS and UV are suitable detectors for the determination of xanthates after HPLC separation and resulted in similar detection limits. When the lowest ICP-MS/MS detection limits for KEX and (EX)2 were calculated for elemental sulfur, they were very similar, 15 and 10 μg L−1, respectively. This was expected because the elemental response is compound independent if there are no differences in their sample introduction or ionization. This phenomenon also enables compound independent calibration (CIC).
ICP-MS/MS is versatile and capable of multielement analysis. The coupling with HPLC enables the development of more selective methods: HPLC-ICP-MS/MS allows selective determination of co-eluting compounds if they contain different elements. The elemental selectivity is the most important advantage of ICP-MS/MS compared to spectrophotometry. This advantage may be applied for studying the reaction mechanisms of xanthates. Reactions in complex process water matrices include the formation of metal-xanthate complexes. The complexes and other reaction products of xanthates may be studied simultaneously by HPLC-ICP-MS/MS.
However, the ICP-MS/MS instrument and operating costs are high and requires an experienced operator. Therefore, ICP-MS/MS is more suitable for selected applications where high sensitivity and selectivity are required. Ultraviolet detector is a better choice for routine analysis.
Analysis of real samples
The HPLC-ICP-MS/MS method was used for the determination of KEX in wastewater collected from the Oulu Mining School (OMS) Minipilot. The minipilot is based on the Pyhäsalmi mine concentrator at a scale of 1:2500 (Peltoniemi et al. Citation2020). The sample was collected from a tailings tank containing the wastewater formed in a flotation process. The pH of the sample was 6.7 that was filtered before the sample pretreatment.
Initially, (EX)2 was not detected from the sample after the pretreatment and hence did not contain detectable quantities of KEX. Therefore, standard additions of 100, 500, and 1000 μg L−1 (EX)2 were made to the sample to study the matrix effects. These results were compared to standards prepared in ultra-pure water. Samples and standards were treated with the described sample pretreatment but triiodide solution was not added. Chromatograms of a 500 µg L−1 (EX)2 standard and a spiked sample are shown in . Additional peaks were found in the tailings samples compared to the (EX)2 standard but eluted earlier and did not affect the (EX)2 determination. The matrix effects were evaluated by comparing the calibration curve slopes and intercepts (Gosetti et al. Citation2010). shows no statistically significant matrix effects were observed in the samples. Therefore, the developed method was suitable for the analysis of tailings formed during the flotation process.
Figure 5. Chromatograms of 500 µg L−1 diethyl dixanthogen (EX)2 and a tailings sample with a 500 µg L−1 (EX)2 spike by HPLC-ICP-MS/MS (mass-shift 32 → 48) following sample pretreatment.
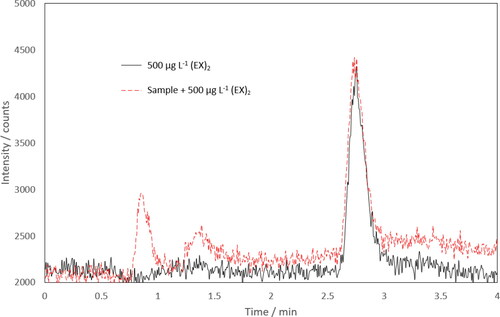
Table 5. Linear equations and their confidence intervals (α = 0.05) for standard addition determination of (EX)2 in ultra-pure water and a tailings sample by HPLC-ICP-MS/MS using peak area.
Conclusions
The developed method shows the potential of the HPLC-ICP-MS/MS as a sensitive and selective method for xanthates as dixanthogens. This approach is based on the detection of sulfur in the compounds separated by HPLC. The method is also fast with a total analysis time of 4 min. Instrumental detection limits for HPLC-ICP-MS/MS were estimated for potassium ethyl xanthate (88 µg L−1) and diethyl dixanthogen (20 μg L−1) and compared favorably with previous studies. The method was applied to a sample collected from the tailings of a flotation process by standard additions of (EX)2 and no significant matrix effects were observed.
The accurate determination of xanthates is hindered by its low stability and therefore absence of certified reference materials. The sample preparation will be studied in detail to achieve more efficient oxidation that requires the optimization of the pretreatment conditions. In the future, this method will be used for determination of different xanthates and their mixtures from environmental and process water samples. Additionally, HPLC-ICP-MS/MS may be utilized for the determination of other sulfur containing compounds with similar structures such as dithiophosphates or thionocarbamates.
Declaration of interest statement
The authors report there are no competing interests to declare.
Acknowledgement
The first author is grateful for the funding provided by the Technology and Natural Sciences Doctoral Programme.
References
- Bach, L., R. D. Norregaard, V. Hansen, and K. Gustavson. 2016. Review on environmental risk assesment of mining chemicals used for mineral separation in the mineral resources industry and recommendations for greenland. Report No 203, Danish Centre for Environment and Energy, Aarhus University, Denmark, 1–32.
- Bulatovic, S. M. 2007. Handbook of flotation reagents chemistry, theory and practice: Flotation of sulfide ores. New York, NY: Elsevier Science.
- Cordeiro, T. G., P. Hidalgo, I. G. R. Gutz, and J. J. Pedrotti. 2010. Flow injection analysis of ethyl xanthate by gas diffusion and UV detection as CS2 for process monitoring of sulfide ore flotation. Talanta 82 (2):790–5. doi:https://doi.org/10.1016/j.talanta.2010.05.055.
- Fontenele, R. S., P. Hidalgo, I. G. R. Gutz, and J. J. Pedrotti. 2007. Flow injection analysis of ethyl xanthate by in-line dialysis and UV spectrophotometric detection. Talanta 72 (3):1017–22. doi:https://doi.org/10.1016/j.talanta.2006.12.027.
- Fu, P., L. Wang, Y. Ma, and Z. Hou. 2020. A comparative study on the degradation of ethyl xanthate collector by O3, UV254nm, UV185 + 254nm, O3/UV254nm and O3/UV185 + 254nm processes. Journal of Environmental Chemical Engineering 8 (1):103628. doi:https://doi.org/10.1016/j.jece.2019.103628.
- Giner Martínez-Sierra, J., O. Galilea San Blas, J. M. Marchante Gayón, and J. I. García Alonso. 2015. Sulfur analysis by inductively coupled plasma-mass spectrometry: A review. Spectrochimica Acta Part B: Atomic Spectroscopy 108:35–52. doi:https://doi.org/10.1016/j.sab.2015.03.016.
- Gosetti, F., E. Mazzucco, D. Zampieri, and M. C. Gennaro. 2010. Signal suppression/enhancement in high-performance liquid chromatography tandem mass spectrometry. Journal of Chromatography. A 1217 (25):3929–37. doi:https://doi.org/10.1016/j.chroma.2009.11.060.
- Hao, F., K. J. Davey, W. J. Bruckard, and J. T. Woodcock. 2008. Online analysis for xanthate in laboratory flotation pulps with a UV monitor. International Journal of Mineral Processing 89 (1–4):71–5. doi:https://doi.org/10.1016/j.minpro.2008.07.004.
- Hao, F. P., E. Silvester, and G. D. Senior. 2000. Spectroscopic characterization of ethyl xanthate oxidation products and analysis by ion interaction chromatography. Analytical Chemistry 72 (20):4836–45. doi:https://doi.org/10.1021/ac991277o.
- Jensen, B. P., C. Smith, I. D. Wilson, and L. Weidolf. 2004. Sensitive sulphur-specific detection of omeprazole metabolites in rat urine by high-performance liquid chromatography/inductively coupled plasma mass spectrometry. Rapid Communications in Mass Spectrometry: RCM 18 (2):181–3. doi:https://doi.org/10.1002/rcm.1312.
- Jones, M. H., and J. T. Woodcock. 1986. Dixanthogen determination in flotation liquors by solvent extraction and ultraviolet spectrometry. Analytical Chemistry 58 (3):588–91. doi:https://doi.org/10.1021/ac00294a022.
- Kemppinen, J., A. Aaltonen, T. Sihvonen, J. Leppinen, and H. Sirén. 2015. Xanthate degradation occurring in flotation process waters of a gold concentrator plant. Minerals Engineering 80:1–7. doi:https://doi.org/10.1016/j.mineng.2015.05.014.
- Klencsár, B., S. Li, L. Balcaen, and F. Vanhaecke. 2018. High-performance liquid chromatography coupled to inductively coupled plasma–mass spectrometry (HPLC-ICP-MS) for quantitative metabolite profiling of non-metal drugs. TrAC - Trends in Analytical Chemistry 104:118–34. doi:https://doi.org/10.1016/j.trac.2017.09.020.
- Kroepfl, N., K. A. Francesconi, T. Schwerdtle, and D. Kuehnelt. 2019. Selenoneine and ergothioneine in human blood cells determined simultaneously by HPLC/ICP-QQQ-MS. Journal of Analytical Atomic Spectrometry 34 (1):127–34. doi:https://doi.org/10.1039/C8JA00276B.
- Li, N., Y. Chen, C. Zhang, W. Zhou, M. Y. Fu, W. L. Chen, and S. Wang. 2015. Highly sensitive determination of butyl xanthate in surface and drinking water by headspace gas chromatography with electron capture detector. Chromatographia 78 (19–20):1305–10. doi:https://doi.org/10.1007/s10337-015-2940-9.
- Liu, R., W. Sun, K. Ouyang, L. Zhang, and Y. Hu. 2015. Decomposition of sodium butyl xanthate (SBX) in aqueous solution by means of OCF: Ozonator combined with flotator. Minerals Engineering 70:222–7. doi:https://doi.org/10.1016/j.mineng.2014.09.020.
- Luukkanen, S., P. Parvinen, M. Miettinen, P. Stén, S. Lähteenmäki, and A. Tuikka. 2003. Monitoring the composition of water of flotation slurries with an on-line analyser. Minerals Engineering 16 (11):1075–9. doi:https://doi.org/10.1016/j.mineng.2003.06.006.
- Miller, J. N., and J. C. Miller. 2010. Statistics and chemometrics for analytical chemistry. 6th ed. Harlow, UK: Pearson Education Limited.
- Montalti, M., D. Fornasiero, and J. Ralston. 1991. Ultraviolet-visible spectroscopic study of the kinetics of adsorption of ethyl xanthate on pyrite. Journal of Colloid and Interface Science 143 (2):440–50. doi:https://doi.org/10.1016/0021-9797(91)90278-G.
- Muzinda, I., and N. Schreithofer. 2018. Water quality effects on flotation: impacts and control on residual xanthates. Minerals Engineering 125:34–41. doi:https://doi.org/10.1016/j.mineng.2018.03.032.
- Peltoniemi, M., R. Kallio, A. Tanhua, S. Luukkanen, and P. Perämäki. 2020. Mineralogical and surface chemical characterization of flotation feed and products after wet and dry grinding. Minerals Engineering 156:106500. doi:https://doi.org/10.1016/j.mineng.2020.106500.
- Pomianowski, A., and J. Leja. 1963. Spectrophotometric study of xanthate and dixanthogen solutions. Canadian Journal of Chemistry 41 (9):2219–30. doi:https://doi.org/10.1139/v63-322.
- Shen, Y., D. R. Nagaraj, R. Farinato, P. Somasundaran, and S. Tong. 2019a. Decomposition of flotation reagents in solutions containing metal ions. Part I: Gaseous compounds from xanthate decomposition. Minerals Engineering 139:105893. doi:https://doi.org/10.1016/j.mineng.2019.105893.
- Shen, Y., D. R. Nagaraj, R. Farinato, P. Somasundaran, and S. Tong. 2019b. Decomposition of flotation reagents in solutions containing metal ions. Part II: Interactions between xanthate and metal ions in solutions. Minerals Engineering 139:105832. doi:https://doi.org/10.1016/j.mineng.2019.105832.
- Shen, Y., D. R. Nagaraj, R. Farinato, and P. Somasundaran. 2016. Study of xanthate decomposition in aqueous solutions. Minerals Engineering 93:10–5. doi:https://doi.org/10.1016/j.mineng.2016.04.004.
- Sihvonen, T., A. Aaltonen, J. Leppinen, S. Hiltunen, and H. Sirén. 2014. A novel capillary electrophoresis method with pressure assisted field amplified sample injection in determination of thiol collectors in flotation process waters. Journal of Chromatography. A 1325:234–40. doi:https://doi.org/10.1016/j.chroma.2013.12.036.
- Occupational Safety and Health Administration, United States Department of Labor. 2019. Permissible exposure limits–annotated OSHA Z-2 Table. https://www.osha.gov/annotated-pels/table-z-2#notes. Accessed January 1, 2022.
- Weissmahr, K. W., C. L. Houghton, and D. L. Sedlak. 1998. Analysis of the dithiocarbamate fungicides ziram, maneb, and zineb and the flotation agent ethylxanthogenate by ion-pair reversed-phase HPLC. Analytical Chemistry 70 (22):4800–4. doi:https://doi.org/10.1021/ac980626w.
- Zhou, C., A. Bahr, and G. Schwedt. 1989. Studies on the HPLC determination of xanthates via copper(I) xanthates and dixanthogens. Fresenius’ Zeitschrift für Analytische Chemie 334 (6):527–33. doi:https://doi.org/10.1007/BF00483571.
- Zhou, C., A. Bahr, and G. Schwedt. 1990. Separation and determination of xanthates in mixtures as dixanthogens by normal-phase HPLC on a diol-phase. Fresenius’ Journal of Analytical Chemistry 338 (8):908–11. doi:https://doi.org/10.1007/BF00322031.