
ABSTRACT
Capsule: Observations of individually marked females of three diving duck species showed that the stage of breeding season and census month most affected their resighting probability in the breeding season.
Aims: To evaluate the efficiency of a diving duck census in the breeding season based on an analysis of the resighting probability of individually marked female ducks.
Methods: We used monitoring data from 2004 to 2015 of individually marked females of Common Pochard Aythya ferina, Tufted Duck Aythya fuligula and Red-crested Pochard Netta rufina in South Bohemia, Czech Republic. Using a model selection approach, the resighting probabilities of females were modelled incorporating covariate parameters, such as stage of breeding, census month, year, numbers of counted individuals, individual species, water surface area and proportion of emergent vegetation.
Results: We demonstrated the significant effect of the stage of breeding, year and census month on the resighting probability of females, while the number of individuals, water surface area and proportion of emergent vegetation did not contribute to the best models. Moreover, the three investigated species with different local population sizes did not differ in resighting probabilities. The incubation period of the females (i.e. June) corresponded to the lowest detection probability in the study area.
Conclusions: Our approach of using individually marked females contributed to modelling to show census accuracy for diving ducks was substantially enhanced by avoiding counting females during the incubation period. Ultimately, these findings are crucial to increase the accuracy of their breeding population size estimation.
Managing populations requires an understanding of population size and growth rate, especially for species of nature conservation significance (Bibby et al. Citation2000, Sutherland et al. Citation2004, Brennan & Kuvlesky Citation2005). Much of the emphasis on tracking changes in flyway population abundance of common duck species at the continental level has concentrated on using mid-winter counts to generate trends in population sizes (Gilissen et al. Citation2002, Wetlands International Citation2006). By comparison, a few countries, such as Finland and the Czech Republic, have specific programmes that monitor breeding population size and annual recruitment (Elmberg et al. Citation2006). Even so, few attempts have been made to evaluate detection probability of breeding individuals and to assess the most effective means of monitoring such species on the breeding grounds.
The accuracy of monitoring breeding waterbirds is heavily affected by detection probability (Defos du Rau et al. Citation2003). Studies show that detection probability is related to range of factors, such as survey duration, total brood abundance, survey date, brood size (Pagano & Arnold Citation2009a, Pagano et al. Citation2014), body mass (Fletcher et al. Citation2006), wind speed, temperature and cloud cover, while being negatively related to wetland area and vegetation cover (Pagano & Arnold Citation2009a). Detectability can also differ among duck species (Vrtiska & Powell Citation2011). Various methods have been used for determining the detectability of breeding waterfowl. The most generally used, the double-observer method, has been developed to estimate detection probability from avian point count data (Nichols et al. Citation2000). It is based on a double-observer approach that was designed to estimate detection probabilities from aerial surveys (Cook & Jacobson Citation1979). This method is useful in homogenous habitats (Nichols et al. Citation2000) and the most widely used method for defining the detection probability of breeding waterfowl (Defos du Rau et al. Citation2003, Fletcher et al. Citation2006, Vrtiska & Powell Citation2011). This method has been further developed to determine detectability in the census of breeding waterbirds along river habitats, also using double-observer methods, using two canoes with two observers on each boat monitoring birds independently (Fletcher et al. Citation2006). The capture–recapture method is less commonly used as a method designed to determine detectability of breeding waterfowl (Defos du Rau et al. Citation2003, Pagano & Arnold Citation2009a, Citation2009b).
Few European studies have focussed on individual detectability of breeding waterfowl. Despite several publications recommending methods for the census of breeding waterfowl from Poland (Cempulik Citation1985, Jantarski Citation2017), Finland (Koskimies & Pöysä Citation1989, Koskimies & Väisänen Citation1991, Pöysä & Nummi Citation1992) and the Netherlands (van Roomen & Hustings Citation1997), there are almost no multi-species studies from any European country of the individual detectability of breeding female ducks to validate such methods (but see Pöysä et al. Citation2018).
To improve the design of duck survey techniques and be able to recommend the most effective monitoring mechanisms for assessing breeding waterbird population size, we focussed on the detectability of individually marked females of three sympatric duck species: Red-crested Pochard Netta rufina, Common Pochard Aythya ferina and Tufted Duck Aythya fuligula. To explain patterns in resighting probability of females and consequently identify the best monitoring design for the three duck species, we took into account the effects of breeding stage (pre-breeding, incubation, brood-rearing, post-brood period), timing of breeding (census month), individual year, local numbers of the given species, individual species, water surface area and proportion of emergent vegetation. We predict (i) that the highest resighting probability of individually marked female ducks would be in the pre-breeding and brood-rearing periods, in contrast with a lower resighting probability during incubation due to the amount of time spent in a hidden nest site (Owen & Black Citation1990, Kear Citation2005). We also predict (ii) relatively little effect of water surface area, proportion of emergent vegetation and local numbers of counted individuals of a given duck species, which would confirm that duck census efficiency was not dependent upon local bird densities and habitat conditions.
Methods
Study area and waterfowl data
Individually marked females (see below) were resighted during regular counts of breeding waterfowl carried out nine times at 175 fishponds in the region of Třeboň, Soběslav and Jindřichův Hradec (Czech Republic, South Bohemia, 48.9685–49.2649o N, 14.6622–14.9007o E) during the breeding season (April to August) between 2004 and 2015. Birds were counted from a fixed number of points covering the entire water surface of each water body, with counters investing sufficient time to record all birds present (Pagano & Arnold Citation2009a, Citation2009b), so survey effort varied according to bird abundance, species and water body size (Bibby et al. Citation2000, Sutherland et al. Citation2004). Individually marked females were identified during and/or immediately after the census. Observations from fixed points were coordinated to avoid missing birds due to strong sunlight.
The water surface area of the fishponds varied between 0.21 and 298.00 ha (mean ± sd = 16.97 ± 39.82 ha) and proportion of cover of emergent vegetation varied between 1.03% and 90.0% (mean ± sd = 21.30 ± 16.26%). Most emergent vegetation was located along shorelines or in the shallow water centres of fishponds, and was mostly Common Reed Phragmites australis, Cattail Typha latifolia, sedges Carex spp., Great Manna Grass Glyceria maxima and willows Salix spp. (Janda et al. Citation1996).
Females of all three duck species were caught on nests in late incubation and individually marked with nasal saddles and colour rings on both legs (Hořák et al. Citation2002, Rodriguez et al. Citation2006, Guillemain et al. Citation2007). Each individual had one or two symbols on the nasal saddle on both sides, so it could be identified without the need for re-trapping. Colour rings were used as an additional mark, which could be helpful in identifying individuals during bouts of preening or when resting on islands. All ducks marked in the current or previous years and recorded in the current year during any stage of the breeding season were included in the analysis. Hence, only females with known laying and hatching date for the given season were included in the analysis for a given year. Presence/absence (binary data) of marked individuals on a fishpond were recorded at each of the nine visits and used for the calculation of detection probability. The resighting probability represents the probability of recording an individual female at a given time and site, as a basis for assessing duck census efficiency.
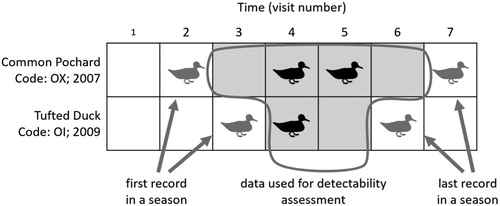
Records of individual females during each visit were noted as a positive record in the table if the individual was recorded during a given visit and a zero record if the individual was not recorded. Only the records where females were known to be present due to previous and subsequent records were retained in all statistical analyses. In total, 980 records were included in the data set (). This sampling procedure implies that only data from seven visits, namely those carried out in May, June and July, could be included.
Figure 1. Illustration of the sampling design for two female ducks. Rows correspond to individual females, columns to individual visits from May to July. Cells with a duck symbol indicate visits with a positive record of the female, empty cells indicate visits in which the female was not recorded. Grey shading shows visits where the given female was known to be present due to her previous and subsequent records; only these cells were retained in all statistical analyses. Each cell counts as one observation, giving a total of 980 observations in the data set.
We analysed the detection probability of individually marked females from 3 diving duck species as a measure of duck census efficiency based on 47 positive records (78 records in total, including counts when the presence of birds was expected according to previous and subsequent records) of 11 marked female Red-crested Pochards, 272 positive records (462 records in total) of 85 marked female Common Pochards, and 226 positive records (440 records in total) of 119 marked female Tufted Ducks. The Red-crested Pochards was recorded on 20 fishponds, Common Pochards on 43 fishponds and Tufted Ducks on 68 fishponds among 175 investigated fishponds. The species differ in their timing of breeding, with Red-crested Pochards and Common Pochards starting earlier than the Tufted Ducks ().
Table 1. Timing of breeding season of individual females of Red-crested Pochard, Common Pochard and Tufted Duck in South Bohemia (Czech Republic) in 2004–2016.
Explanatory variables
To explain patterns in detection probability, we defined seven variables: (1) Stage of breeding (pre-breeding, incubation, brood-rearing, post-brood period) for each marked female based on her last egg laying date (i.e. start of incubation period) and hatching date (i.e. start of post-hatching or brood-rearing period) based on our nest surveys or age of ducklings (using techniques of Gollop & Marshall (Citation1954) for aging of North American ducklings). In the post-brood period, we also assigned female breeding stage according to whether they reared ducklings, or were never recoded with ducklings. Additionally, we used (2) month and (3) year (temporal variables); (4) species investigated and site variables (5) water surface area and (6) proportion of emergent vegetation for each of the fishponds (based on analysis of aerial pictures) as well as (7) local numbers of a given species at every count on each individual fishpond when detection probability was sampled.
Statistical analysis
Covariate effects on resighting probability were assessed using mixed-effects logistic regression, with a 0/1 indicator of detection as the explanatory variable. As different records of the same individual duck cannot be assumed to be independent, we included an individual-specific random effect in the regression model. In general, there was little correlation among the covariates, allowing their simultaneous use in a regression model. An exception was the relationship between stage of breeding and census month (Spearman’s rank correlation ρ = 0.64); nevertheless, there turned out to be enough individual variation in these variables to produce significant individual effects in both cases (see below).
To compare the explanatory power of our covariates, we applied information-theoretic criteria, namely the Akaike information criterion corrected for small-sample bias, AICc. We considered a set of candidate models comprising all possible subsets of the seven explanatory variables (127 different model specifications in total). For each model, we calculated the Akaike weight (Burnham & Anderson Citation2002) and then obtained relative variable importance (RVI) for each covariate by summing the Akaike weights across all models that included the given covariate (Arnold Citation2010). Next, we used Arnold’s (Citation2010) procedure for discarding models with uninformative parameters: we discarded all models that were outperformed (based on AICc) by an alternative with a subset of covariates. This procedure helped identify a reasonable-sized set of the most parsimonious models. All statistical analyses were carried out in Stata 15 (StataCorp, TX).
Results
The mean (± se) resighting probability of individually marked females was 0.603 ± 0.055 (n = 78) in Red-crested Pochard, 0.589 ± 0.023 (n = 462) in Common Pochard and 0.514 ± 0.024 (n = 440) in Tufted Duck. Our analysis of how the overall resighting probability varied with our explanatory variables yielded remarkably clear-cut results. Three variables were identified as important by the criterion of relative variable importance (): stage of breeding season, month and year all scored an RVI above 0.99 and were the only variables included in the model with the lowest AICc (henceforth referred to as the AIC-best model). All other variables (local numbers of given species, proportion of emergent vegetation, water surface area, species) lagged behind by a wide margin, scoring an RVI of 0.31 or less. After the elimination of models with uninformative parameters, only 15 candidate models were retained from the complete set of 127; lists these models in an ascending order of AICc. Model 1 (with the lowest AICc) scored an Akaike weight of 0.985, and the evidence ratio between Model 1 and Model 2 exceeded 100; this implies that Model 1 substantially outperformed all other models in the candidate set.
Figure 2. Relative importance of explanatory variables (sum of Akaike weights, based on all 127 candidate models).
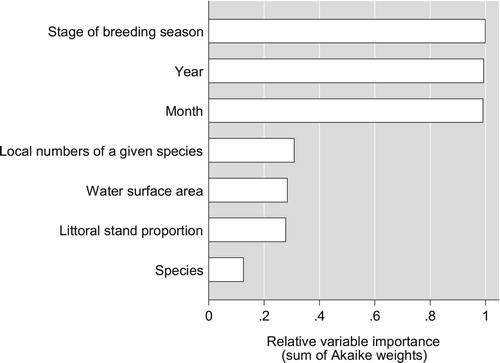
Table 2. Candidate models of detection probability retained after the elimination of models with uninformative parameters.
Among the three covariates flagged up as important by the AICc procedure, stage of breeding season seemed to have the largest explanatory power. Not only did it have the largest RVI of the three, but it also dominates the rest in terms of explained variance. If stage of breeding is kept as the only explanatory variable (Model 4), the (adjusted) R2 is 0.356, almost the same as the 0.366 of the Model 1 (). For models that only include either month or year, the R2s were 0.083 and 0.027 (, Models 8 and 11).
For practical purposes, it was important to investigate the effects of stage of breeding and month in more detail, as these variables are straightforward to (i) ascertain during a census and (ii) manipulate by adjusting the timing of the census. present the estimated resighting probabilities for all three species at different categories of the stage of breeding and month.
Table 3. Resighting probability (ratio of positive records to expected records when presence of the duck female was expected according to previous and subsequent possitive records) in various stages of the breeding season.
Table 4. Resighting probability (ratio of positive records to expected records when presence of the duck female was expected according to previous and subsequent possitive records) in individual census months.
Table 5. Summary of resighting probability (ratio of positive records to expected records when presence of duck female was expected according to previous and subsequent records) and census results. Results are presented as estimate ± se (sample size in parentheses).
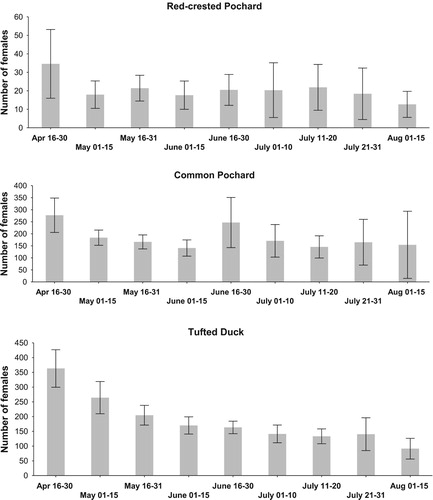
The highest probability of recording a marked female was in the pre-breeding, brood-rearing and post-brood periods (stage of breeding; ), i.e. in May and July (timing of breeding season; ). Therefore, we focussed on resighting probability of females in the period after hatching date, where we used data from females recorded in the pre-breeding season of a given year and data from females recorded in the pre-breeding season and/or during the incubation period (). Total numbers of both marked and unmarked females recorded in May, i.e. at the start of the breeding season, varied between 16 and 47 (mean ± sd = 28.31 ± 10.59) in Red-crested Pochard, between 118 and 284 (177.46. ± 50.08) in Common Pochard, and between 101 and 350 (232.92 ± 70.11) in Tufted Duck, in the study area between 2004 and 2015. Later in July, numbers of females were lower than numbers recorded in May, constituting a mean (± se) of between 63.0 ± 6.7% and 87.7 ± 14.4% in different species of the numbers recorded in May (, ).
Figure 3. Seasonal variation in the numbers of female duck recorded in the study area (bars show means ± 0.95 confidence intervals).
Discussion
Based on marked individuals, our results indicate that the stage of breeding, year and month had the greatest influence on the resighting probability of female diving ducks. Other temporal and habitat parameters did not contribute explanatory effects to selected models. Specifically, resighting probability was highest in the pre-breeding, brood-rearing and post-brood periods, i.e. in May and later in July.
Census errors, the difference between the true value of the estimate and the real one, can be minimized by recognizing the sources of such errors (Bibby et al. Citation2000). We found a significant effect of the census month on resighting probability (P = 0.0018 in the model with the lowest AICc), which corresponded to breeding phenology and forms the main source of bias in breeding population size (i.e. number of females) estimates. In southern Bohemia, the three studied diving duck species most often incubate their clutch in June, and at this time we obviously recorded reduced resighting probability. Detection probability was low during incubation because female ducks spent most of the time incubating their clutch (Owen & Black Citation1990, Kear Citation2005, Chambert et al. Citation2012). By contrast, females were easy to detect at the beginning of the breeding season, i.e. in the period between their arrival at the breeding site and start of clutch incubation. Furthermore, resighting probability increased again in the post-hatching and brood-rearing periods, when females with ducklings fed in open water and moved between habitats searching for optimal foraging and roosting sites. High resighting probability also occurred in the post-brood period when ducklings were almost or fully fledged and able to care for themselves. Females stayed on the breeding site before flying to their post-breeding, moulting or later wintering areas, where they are relatively easy to observe. We found no significant differences in resighting probability between the three studied species. Resighting probability seems unaffected by population size, since the Red-crested Pochard is a much less abundant species in contrast to the more abundant Common Pochard and Tufted Duck. The overlap in the timing of breeding among different diving duck species favours timing of census periods which are similar to those used for local monitoring of breeding diving duck populations in central Europe (Ranoszek Citation1983, Cempulik Citation1985, Fiala Citation2008). Most of the studies attempted to resolve problems caused by the overlap of spring migration and the start of the breeding season (Jantarski Citation2017), when low detectability of females during clutch incubation underestimated numbers present. We expected duck densities to affect census accuracy since detection probability is generally expected to decrease with lower densities of ducks (Koneff et al. Citation2008, Vrtiska & Powell Citation2011). However, our result shows that the resighting probability of marked females, and consequently census efficiency, was unaffected by local fishpond densities, in contrast to Fletcher et al. (Citation2006). A potential explanation for this result lies in our survey methodology: we used multiple census point-counts for each fishpond, ensuring adequate coverage of the entire waterbody under all light conditions. Typically, water bodies in the study area were relatively small, surrounded by restricted emergent vegetation and could be viewed from elevated vantage points, such as raised banks or dams. This likely contributed to the fact that resighting probability was consistent, showing little influence of duck numbers.
Generally, habitat type affects waterbird detection probability (Bibby et al. Citation2000, Defos du Rau et al. Citation2003, Sutherland et al. Citation2004, Pagano & Arnold Citation2009a, Gayet et al. Citation2011). Southern Bohemia fishponds are often surrounded by reed beds, but our results showed that these did not adversely affect resighting probability of the three studied species. This could be due to the fact that we are able to check all open water areas from the observation points in contrast to the more complex habitat of the Dombes (eastern France) which affected even Mute Swan Cygnus olor detection probability (Gayet et al. Citation2011). None of the three studied diving duck species spend much time in reed beds (excluding the incubation period) unlike species such as Coot Fulica atra and Little Grebe Tachybaptus ruficollis. Diving ducks usually swim in open water under normal still weather conditions (van Roomen & Hustings Citation1997). Dabbling ducks such as Blue-winged Teal Spatula discors, Mallard Anas platyrhynchos, Gadwall Mareca strepera (Sauder et al. Citation1971) and Mute Swan (Gayet et al. Citation2011) are more prone to use emergent vegetation, which affects their detectability. In a study from Finland, higher estimates of the number of ducklings of Eurasian Teal Anas crecca were detected using aerial drone counts compared with ground-based point counts because of the emergent vegetation, but there were no differences in the estimates of the number of ducklings of Mallard and Common Goldeneye Bucephala clangula using these two methods (Pöysä et al. Citation2018).
We contest that this method is suitable for rare and less abundant species such as the Red-crested Pochard, contrary to the approach of Nichols et al. (Citation2000) which underestimated less abundant Red-crested Pochard in the Camargue (Defos du Rau et al. Citation2003, Citation2005). A higher resighting probability in brood-rearing females was found among diving ducks (P = 0.706–0.745) compared to detection probability in other studies (e.g. diving ducks broods P = 0.571, Pagano & Arnold Citation2009a; Red-crested Pochard broods P = 0.545, Defos du Rau et al. Citation2003).
We found 63.3–78.3% of females recorded in the pre-breeding season were later recorded in the post-hatching period in the same season. Similarly, 71.1–76.5% of females recorded in the pre-breeding and/or incubation period were later recorded in the post-hatching period in the same season. Among those, 87.5% (n = 16) of Red-crested Pochard females, 77.6% (n = 116) of Common Pochard females and 57.2% (n = 145) of Tufted Duck females, which were recorded in the pre-breeding and/or the incubation period, were later recorded with ducklings in the same breeding season.
The lowest resighting probability of females in post-hatching period was found in Tufted Ducks, which is the latest breeding species and therefore the species with the lowest resighting probability in July. The same pattern was reflected in the ratio between the numbers of females recorded in July and those in May. Nevertheless, we can recommend both May and July surveys to estimate female abundance. July counts can also be used for the assessment of breeding success, when successful females can be recorded rearing ducklings as well as unsuccessful females without ducklings. Nevertheless, this conclusion is based on a study site without larger concentrations of moulting females of the investigated species, which are known from other sites in Central Europe such as the Ramsar Site Ismaninger Speichersee mit Fischteichen in Germany (Köhler & Köhler Citation1998). We found a significant year effect, which could be explained by weather conditions affecting the proportion of non-breeders and breeding success, timing of breeding season and consequently the numbers of females rearing ducklings. Nevertheless, an analysis of the variation in population structure and individual reproductive success lies outside the aims and framework of this paper, yet it could open up areas for further research and analyses in future studies.
Conclusion
Monitoring programs need to provide error and bias free assessments of breeding population size and production if they are to be useful for informing conservation actions and management policies (Pullin Citation2002, Sutherland et al. Citation2004). Breeding duck populations are often difficult to assess accurately due to variation in stage of breeding, phenology, habitat and bird density (Bibby et al. Citation2000). In this study of three diving duck species in southern Bohemia, we show that stage of breeding season and survey timing were key factors of affecting resighting probability of nesting females. Avoiding the incubation period significantly increases the accuracy and efficiency of the monitoring design. Overall, resighting probability of marked females was the highest in the pre-breeding season and in the post-hatching period. Generally, we recommend both surveys of these species in May during the pre-breeding period and in July during the post breeding period.
Acknowledgements
We are very grateful to all co-workers involved in the breeding waterfowl counts in South Bohemia in 1981–2015. Among many others, we thank Tomáš Albrecht, Milan Haas, David Hořák, Tereza Kejzlarová, Petr Klvaňa, Pavlína Kočicová, Blanka Kuklíková, Anna Langrová, Hana Malíková, Michaela Nachtigalová and Šárka Neužilová for their help in the field. We are also grateful to Steve Ridgill, Anthony D. Fox and Adéla Šenkýřová for language improvement and Matthieu Guillemain and Anthony D. Fox for useful comments on the design of this paper.
Additional information
Funding
References
- Arnold, T.W. 2010. Uninformative parameters and model selection using Akaikés information criterion. J Wildl. Manag. 74: 1175–1178. doi: 10.1111/j.1937-2817.2010.tb01236.x
- Bibby, C.J., Burgess, N.D. & Hill, D.A. 2000. Bird Census Techniques. Academic Press, London.
- Brennan, L.A. & Kuvlesky, W.P. 2005. North American grassland birds. An unfolding conservation crisis? J. Wildl. Manag. 69: 1–13. doi: 10.2193/0022-541X(2005)069<0001:NAGBAU>2.0.CO;2
- Burnham, K.P. & Anderson, D.R. 2002. Model Selection and Multimodel Inference: a Practical Information – Theoretic Approach. Springer-Verlag, New York.
- Cempulik, P. 1985. Wodno-błotne Non-Passeriformes na stawach rybnych Wielikąt (górny Śląsk). Acta orn. 21: 115–134 (in Polish, with English summary).
- Chambert, T., Pardo, D., Choquet, R., Staszewski, V., McCoy, K., Tveraa, T. & Boulinier, T. 2012. Heterogeneity in detection probability along the breeding season in black-legged kittiwakes: implications for sampling design. J. Ornithol. 152: 371–380. doi: 10.1007/s10336-010-0542-8
- Cook, R.D. & Jacobson, J.O. 1979. A design for estimating visibility bias in aerial surveys. Biometrics. 35: 735–742. doi: 10.2307/2530104
- Defos du Rau, P., Barbraud, C. & Mondain-Monval, J. 2003. Estimating breeding population size of the Red-crested Pochard (Netta rufina) in the Camargue (southern France), taking into account detection probability implications for conservation. Anim. Conserv. 6: 379–385. doi: 10.1017/S1367943003003457
- Defos du Rau, P., Barbraud, C. & Mondain-Mon-val, J.Y. 2005. Incorporating uncertainty into analyses of Red-crested Pochard habitat selection. Biol. Conserv. 125: 355–367. doi: 10.1016/j.biocon.2005.04.006
- Elmberg, J., Nummi, P., Pöysä, H., Sjöberg, K., Gunnarsson, G., Clausen, P., Guillemain, M., Rodrigues, D. & Väänänen, V.M. 2006. The scientific basis for new and sustainable management of migratory European ducks. Wildl. Biol. 12: 121–127. doi: 10.2981/0909-6396(2006)12[121:TSBFNA]2.0.CO;2
- Fiala, V. 2008. Náměšťské rybníky a jejich ptactvo 1885–2008. Pobočka ČSO na Vysočině, Jihlava (in Czech, with English summary).
- Fletcher, R.J., Hutto, R.L. & Haukos, D.A. 2006. Estimating detection probabilities of river birds using double surveys. Auk 123: 695–707. doi: 10.1093/auk/123.3.695
- Gayet, G., Eraud, C., Benmergui, M., Broyer, J., Mesleard, F., Fritz, H. & Guillemain, M. 2011. Breeding mute swan habitat selection when accounting for detectability: a plastic behaviour consistent with rapidly expanding populations. Eur. J. Wildl. Res. 57: 1051–1056. doi: 10.1007/s10344-011-0518-x
- Gilissen, N., Haanstra, L., Delany, S., Boere, G. & Hagemeijer, W. 2002. Numbers and Distribution of Wintering Waterbirds in the Western Palearctic and Southwest Asia in 1997, 1998 and 1999. Results From the International Waterbird Census. Wetlands International Global Series, Wageningen, the Netherlands.
- Gollop, J.B. & Marshall, W.H. 1954. A Guide for Aging Duck Broods in the Field. Flyway Council Technical Section, Mississippi.
- Guillemain, M., Poisbleau, M., Denonfoux, L., Lepley, M., Moreau, C., Massez, G., Leray, G., Caizergues, A., Arzel, C., Rodrigues, D. & Fritz, H. 2007. Multiple tests of the effect of nasal saddles on dabbling ducks: combining field and aviary approaches. Bird Study 54: 35–45. doi: 10.1080/00063650709461454
- Hořák, D., Albrecht, T. & Musil, P. 2002. Vliv nosních značek na chování samic potápivých kachen rodu Aythya. Sylvia. 38: 91–96 (in Czech, with English summary).
- Janda, J., Pechar, L., Musil, P., Pecharová, E. & Plesník, J. 1996. Sustainable use of Fishponds in the Třeboňsko Protected Landscape Area and Biosphere Reserve. Czech Centre of IUCN Praha a IUCN Gland, Switzerland.
- Jantarski, M. 2017. Metody oceny liczebności lęgowych grążyc Aythyini. Ornis Polonica. 58: 117–139 (in Polish, with English summary).
- Kear, J. 2005. Bird Families of the World: Ducks, Geese and Swans. Oxford University Press, Oxford.
- Köhler, P. & Köhler, U. 1998. Saisonale Dynamik und Bestandetwicklung von mausernden Wasservögel (Anatidae, Podicipedidae, Rallidae) am “ismaninger Speichersee mit Fischteichen”. Anz. Ornithol. Ges. Bayern. 48: 205–240 (in German, with English summary).
- Koneff, M.D., Royle, J.A., Otto, M.C., Wortham, J.S. & Bidwell, J.K. 2008. A double-observer method to estimate detection rate during aerial waterfowl surveys. J. Wildl. Manag. 72: 1641–1649.
- Koskimies, P. & Pöysä, H. 1989. Waterfowl censusing in environmental monitoring: a comparison between point and round counts. Ann. Zool. Fenn. 26: 201–206.
- Koskimies, P. & Väisänen, R.A. 1991. Monitoring Bird Populations. Zoological Museum, Finnish Museum of Natural History, Helsinki.
- Nichols, J.D., Hines, J.E., Sauer, J.R., Fallon, F.W., Fallon, J.E. & Heglund, P.J. 2000. A double-observer approach for estimating detection probability and abundance from point counts. Auk 117: 393–408. doi: 10.1093/auk/117.2.393
- Owen, M. & Black, J.M. 1990. Waterfowl Ecology. Blackie, Glasgow and London.
- Pagano, A.M. & Arnold, T.W. 2009a. Estimating detection probabilities of waterfowl broods from ground-based surveys. J. Wildl. Manag. 73: 686–694. doi: 10.2193/2007-524
- Pagano, A.M. & Arnold, T.W. 2009b. Detection probabilities for ground-based breeding waterfowl surveys. J. Wildl. Manag. 73: 392–398. doi: 10.2193/2007-411
- Pagano, A.M., Amundson, C.L., Pieron, M.R., Arnold, T.W. & Kimmel, T.C. 2014. Using sightability-adjusted brood-pair ratios to estimate waterfowl productivity. Wildl. Soc. Bull. 38: 566–573. doi: 10.1002/wsb.422
- Pöysä, H., Kotilainen, J., Väänänen, V.M. & Kunnasrant, M. 2018. Estimating production in ducks: a comparison between ground surveys and unmanned aircraft surveys. Eur. J. Wild. Res. 64: 74. DOI: 10.1007/s10344-018-1238-2.
- Pöysä, H. & Nummi, P. 1992. Comparing two methods of data collection in waterfowl habitat use studies. Bird Study 39: 124–131. doi: 10.1080/00063659209477109
- Pullin, A.S. 2002. Conservation Biology. Cambridge University Press, Cambridge.
- Ranoszek, E. 1983. Weryfikacja metod oceny liczebności lęgowych ptaków wodnych w warunkach stawów milickich. Not. orn. 24: 177–201. (in Polish, with German summary).
- Rodrigues, D., Figueiredo, M., Fabião, A. & Tenreiro, P. 2006. Ten years of waterfowl marking in Portugal. main results and future perspectives. In G. C. Boere, C. A. Galbraith & D. A. Stroud. (ed) Waterbirds Around the World, 474–475. The Stationary Office, Edinburgh.
- Sauder, D.W., Linder, R.L., Dahlgren, R.B. & Tucker, W.L. 1971. An evaluation of the roadside technique for censusing breeding waterfowl. J. Wildl. Manag. 35: 539–543. doi: 10.2307/3799709
- Sutherland, W.J., Newton, I. & Green, R. 2004. Bird Ecology and Conservation. Oxford University Press, Oxford.
- van Roomen, M.W.J. & Hustings, F. 1997. Manual Waterbird Projects SOVON (English Edition). SOVON Vogelonderzoek Nederland, Beek-Ubbergen.
- Vrtiska, M.P. & Powell, L.A. 2011. Estimates of duck breeding populations in the Nebraska Sandhills using double observer methodology. Waterbirds 34: 96–101. doi: 10.1675/063.034.0112
- Wetlands International. 2006. Waterbird Population Estimates - Fourth Edition. Wetlands International, Wageningen.