
Abstract
This paper examines the effects of participatory budgeting on local government service delivery in the district of Sumedang, West Java, using synthetic control methods. I use four indicators to measure the local government’s service delivery performance: household access to safe sanitation and water, and the net junior and senior secondary school enrolment rates. The findings indicate that participatory budgeting improved the net junior secondary enrolment rate for the overall population compared to the counterfactual, but not that it improved the access of the poor to any of the areas investigated. I argue that this is due to the dominance of local elites in agenda setting, a lack of strategies to target poverty and the low levels of participation of the poor in participatory budgeting processes.
Tulisan ini menelaah mengenai efek penganggaran partisipatif pada pelayanan publik di Kabupaten Sumedang, Jawa Barat, dengan menggunakan metode kendali sintetis (synthetic control methods). Penulis menggunakan empat indikator untuk mengukur kinerja pelayanan publik pemerintah kabupaten: akses rumah tangga kepada sanitasi aman dan air, dan pendaftaran siswa SLTP dan SMA. Temuan-temuan mengindikasikan bahwa penganggaran partisipatif meningkatkan penerimaan siswa SLTP di semua populasi jika dibandingkan dengan kontra faktual, namun tidak menaikkan akses orang miskin ke area-area yang menjadi sasaran investigasi. Penulis berargumen bahwa hal ini terjadi karena dominasi elit lokal dalam penentuan agenda, kekurangan strategi untuk menyasar kemiskinan, dan rendahnya partisipasi orang miskin dalam proses penganggaran partisipatif.
INTRODUCTION
One of the main purposes of participatory institutions is to produce policies that are more responsive to community needs (Ackerman Citation2004; Shah Citation2007; Speer Citation2012). This is because participatory institutions allow information to flow directly from the community to the government (Faguet Citation2014; Gonçalves Citation2014). Ideally, therefore, the decisions made by participants through participatory processes would be accommodated in government decisions on service provision (Brinkerhoff and Azfar Citation2006; Fung and Wright Citation2003; Sheely Citation2015; Speer Citation2012).
Several studies have investigated the effects of participatory budgeting on local government budgets and service delivery, including Baiocchi et al. (Citation2006), Boulding and Wampler (Citation2010), Gonçalves (Citation2014) and Touchton and Wampler (Citation2014). One limitation of such studies is that they tend to generalise across all participatory budgeting experiments, even though such schemes range from merely consultative to actually providing a certain amount of funds to be allocated by citizens (Baiocchi, Heller and Silva Citation2011; Cabannes Citation2004; Wampler Citation2007). As Pateman (Citation2012, 14) noted, the experiments on participatory budgeting worldwide often ‘do not involve the municipal or local budget’.
This article aims to contribute to understanding of the effects of participatory budgeting on service delivery. Participatory planning and budgeting processes in decentralised Indonesia provide a unique opportunity for this, because it is mandatory for local governments to involve citizens in decision-making—even though the institutional design of such schemes, and hence the degree to which authority for decision-making and the allocation of funds is vested in the citizens, differs widely across localities. Participation is achieved through village- to district-level forums called Musyawarah Perencanaan Pembangunan (Musrenbang), or Development Planning Consultations.
Since 2001, Indonesia has been transformed from a highly centralised to a highly decentralised nation. Indonesia’s ‘big bang’ decentralisation involved a rapid and simultaneous transfer of political, administrative and fiscal powers to the provincial and district levels of government (Hofman and Kaiser Citation2004). Decentralisation is expected to improve service delivery by bringing government closer to the people. Local governments are better placed than the national government to understand local needs, allowing them to develop policies that match citizens’ preferences, and to provide greater transparency and accountability.
The findings of recent studies on service delivery in decentralised Indonesia, however, are mixed. Some studies suggest that the decentralisation of democratic processes, particularly the direct election of district heads, did not improve capital spending or local government responsiveness (Kis-Katos and Sjahrir Citation2017) and may have led to increased local government corruption (Valsecchi Citation2013). However, others argue that direct elections are associated with increased health expenditure (Skoufias et al. Citation2014), and that directly elected district heads are more efficient (Lewis Citation2018) and less corrupt (Lewis Citation2017) than those elected by local parliaments.
Following Abadie and Gardeazabal (Citation2003) and Abadie, Diamond and Hainmueller (Citation2010, 2015), this study employs synthetic control methods to investigate the causal effects of participatory budgeting on service delivery in the district of Sumedang, West Java. The findings indicate that participatory budgeting improved the net junior secondary school enrolment rate for the overall population compared to the counterfactual. However, there is no significant evidence that it improved the access of the poor to any of the services investigated.
REVIEW OF THE IMPACT OF PARTICIPATORY INSTITUTIONS ON SERVICE DELIVERY
Participatory institutions enable the community to participate in decision-making processes and in this way to influence government decisions that affect their lives (Fung and Wright Citation2003). Such institutions are expected to increase local government spending in areas that are necessary to improve development outcomes, such as health, education, housing and infrastructure (Boulding and Wampler Citation2010; Touchton and Wampler Citation2014). Several studies have investigated the impact of participatory budgeting on municipal spending on health and sanitation in Brazil (Baiocchi et al. Citation2006; Boulding and Wampler Citation2010; Gonçalves Citation2014; Touchton and Wampler Citation2014). These studies found that the municipalities that adopted participatory budgeting allocated a higher proportion of their budgets to health and sanitation than the municipalities that did not. The increase in spending ranged from 2% (Gonçalves Citation2014) to 5%–6% (Boulding and Wampler Citation2010; Baiocchi et al. Citation2006; Touchton and Wampler Citation2014). In India, meanwhile, Besley, Pande and Rao (Citation2005) found that the participatory mechanism of Gram Sabha was effective in lifting the share of public resources allocated to vulnerable groups through social welfare programs.
Studies on the impact of participatory budgeting on education and housing expenditure have yielded mixed results. Boulding and Wampler (Citation2010) showed that municipalities in Brazil with participatory budgeting had significantly higher spending on education. On the other hand, Gonçalves (Citation2014) found that an increase in health and sanitation expenditure was offset by a decrease in education expenditure, implying a trade-off between budgetary priorities. In Russia, Beuermann and Amelina (Citation2014) found that the implementation of participatory budgeting had increased the share of revenue allocated to housing and utilities. Similarly, Donaghy (Citation2011) observed that municipalities in Brazil that had established housing councils had a higher number of social housing programs than municipalities that had not. Boulding and Wampler (Citation2010), however, found no significant difference in housing sector expenditure between municipalities in Brazil that had, and had not, adopted participatory budgeting.
Turning to development outcomes, Boulding and Wampler (Citation2010) found no significant evidence that participatory budgeting had positive effects on infant mortality or social well-being in Brazil. Similarly, Jaramillo and Alcázar (Citation2013) found no correlation between participatory budgeting and the coverage and quality of water and sanitation in Peru. However, Gonçalves (Citation2014) and Touchton and Wampler (Citation2014) concluded that participatory budgeting did indeed succeed in reducing infant mortality in Brazil. In their study of the agricultural sector in Peru, Jaramillo and Wright (Citation2015) observed that participatory forums increased the number of agricultural services provided by local governments.
Some studies found that citizens’ demands were not reflected in government decision-making, despite this being an expected outcome of participatory practices. For instance, a study by Hossain et al. (2014) concluded that participatory budgeting did not contribute to local government policymaking in Bangladesh. Evidence from Kenya also suggested that mobilising the community to take part in participatory planning did not increase the number of citizen-proposed projects that were adopted by the local government (Sheely Citation2015).
PARTICIPATORY BUDGETING AND SERVICE DELIVERY PERFORMANCE IN INDONESIA
Under Law 32/2004 on Regional Government (the decentralisation law) and Government Regulation 38/2007 on the Division of Responsibilities between the National, Provincial and District Governments, the central government retained authority for foreign affairs, defence, security, the judiciary, national monetary and fiscal policy, and religious affairs, while regional governments became responsible for the remaining areas of authority, including basic services. The central government funds and sets minimum service standards for basic services, but local governments can introduce their own innovations to meet the service standards based on the local context.
Overview of Participatory Planning and Budgeting in Indonesia
Held annually, Musrenbang forums provide a means for the community to set development priorities in each local area. The purpose of the forums is to build consensus between the community and the district government on the development priorities that will be funded by the local budget—in other words, to align and synchronise the preferences of the district government and non-state local stakeholders. In each district, the Musrenbang process starts at the village level, then progresses to the subdistrict, specific-sector and district levels.Footnote1
The purpose of the village-level Musrenbang is to reach a consensus on the development priorities to be funded by local budgets (APBD), village grants and other grants, and to select delegates to represent the village at the subdistrict Musrenbang. At this stage, decisions on the projects to be funded by village grants are finalised. The purpose of the subdistrict Musrenbang is to discuss these villagelevel development priorities, to reach agreement on the programs and activities to be elevated to the next stage and to select delegates to represent the subdistrict in the subsequent (third and fourth) stages. The thematic forums (Forum SKPD) deal with specific areas, such as education, health, infrastructure and agriculture. Their purpose is to enable local agencies working in these sectors to align their programs and activities with the community’s priorities. The results of the thematic forums are then discussed at the district-level Musrenbang in order to reach agreement on the annual Local Government Work Plan (RKPD). This work plan is the main document used to formulate the government’s general budget policies and provisional budget ceiling (KUA-PPAS). Once the KUA-PPAS has been approved by the local parliament (DPRD), local agencies draw on it to compile their own work plans and budgets. The agencies’ work plans and budgets are then used to compile the draft local budget, which must be considered and approved by the local parliament.
Participatory Budgeting in Sumedang and Basic Services
Silver and Sofhani (Citation2008) note that the effort to introduce a more participatory approach to local planning and budgeting in Sumedang began in 2000 through the formation of Forum Jatinangor, which consisted of local activists and civil society organisations (CSOs). This forum was initiated by the Bandung Institute of Technology (ITB) and sponsored by USAID, the University of Illinois and the Ford Foundation. Forum Jatinangor managed to persuade the local government to adopt a participatory approach to budgeting and to provide grants to villages through a head-of-district decree (Silver and Sofhani Citation2008; Sumarto Citation2008).
However, a change in district head in 2003 hindered the reform, causing donors to lose interest in assisting Sumedang (Sumarto Citation2008). Despite this, CSOs continued to call on local leaders to embed citizen participation in planning and budgeting. They realised that a head-of-district decree was not sufficient to bind the legislature to comply with the requirement for participatory budgeting; as matters stood, many community proposals were being overlooked by the local parliament. Facing difficulties with the new district head, CSOs began to lobby reform-minded local MPs to propose legislation that would provide a channel to accommodate the community’s demands to participate in budgetary decision-making (Muluk and Suherman Citation2011).
As a result of their efforts, in 2007 the local government enacted Local Regulation (Perda) 1/2007 on Planning and Budgeting Procedures, which is considered best practice for planning and budgeting across local governments in Indonesia. The regulation introduced two innovative features. First, it integrated planning and budgeting through an indicative funding allocation for subdistricts (PIK). PIK funding is allocated to each subdistrict in Sumedang based on indicators such as population size, poverty rate, literacy rate, child mortality rate and infrastructure condition. The local parliament cannot alter or reject the projects proposed under the PIK scheme.
One of the weaknesses of participatory planning and budgeting programs in Indonesia has been the disconnect between planning and budgeting (Usui and Alisjahbana Citation2005). The PIK scheme addresses this problem by providing certainty that a community’s proposals will be funded by the local budget. Local Regulation 1/2007 separated the funding allocation for subdistricts (PIK) from the funding allocation for local government agencies (PI-SKPD). The allocation of PI-SKPD is determined through a technocratic approach, based on local agencies’ strategic plans. PI-SKPD can also accommodate community proposals from Musrenbang that match the local agencies’ strategic plans. Projects proposed for PIK and PI-SKPD funding make up the annual Local Government Work Plan (RKPD). The amounts of PIK and PI-SKPD funding are discussed by the executive and the legislature, and are stipulated in a memorandum of understanding (MoU) on the indicative funding ceilings that will be available prior to the subdistrict-level Musrenbang. The amount of funds allocated to PIK in Sumedang has increased over the years, from Rp 25 billion in 2008 to Rp 50 billion in 2016.Footnote2
The second innovative feature of Local Regulation 1/2007 was to establish the Musrenbang Delegates Forum (FDM). According to District Head Decree 10/2008 on the Recruitment and Implementation of the FDM, the purpose of this forum is to monitor planning processes as well as the formulation and implementation of local budgets. Therefore, the forum is technically involved in all stages of local government planning and budgeting, in addition to monitoring project implementation. The members of the FDM are selected from subdistrict delegates and participants in Forum SKPD (that is, the thematic meetings).Footnote3
These two innovative features of Local Regulation 1/2007—PIK and the FDM— were expected to revive community interest in participating in Musrenbang and to create binding decisions that had to be implemented by the local government.
The PIK funding scheme and the FDM provide accountability mechanisms to ensure that both public officials and private contractors execute projects as prescribed. Thus, the conditions exist for Local Regulation 1/2007 to improve basic services. I therefore hypothesise that the implementation of Local Regulation 1/2007 has enhanced service delivery performance in Sumedang—because the community can propose and decide on the allocation of budgets for basic services through the PIK scheme, and monitor the implementation of such projects through the FDM.
METHOD AND DATA
Synthetic Control Methods
To investigate the effects of the implementation of the PIK and FDM mechanisms in Local Regulation 1/2007 on access to basic services, I employ synthetic control methods. The synthetic control method estimates the causal effect of an intervention by constructing a counterfactual from a weighted average of other districts, as a comparison to the district that implements the intervention.
Following Abadie and Gardeazabal (Citation2003) and Abadie, Diamond and Hainmueller (Citation2010, 2015), suppose we observe J + 1 districts, indexed by i = 1, … , J + 1 over T periods, t = 1, 2, … , T in the sample. Only one district (Sumedang), i = 1, has implemented the PIK and FDM schemes, and the rest of the districts, J, are potential control districts or the ‘donor pool’. The districts are observed over a number of periods before (T0) and after (T1) the implementation of Local Regulation 1/2007, so that T0 + T1 = T.
The causal effect of Local Regulation 1/2007 for unit i at time t is given by
![]()
where ![]() is access to a basic service when district i (Sumedang) implemented the reform and
is access to a basic service when district i (Sumedang) implemented the reform and ![]() is the access to the service without the reform. Since
is the access to the service without the reform. Since ![]() is not observed after the intervention period, we need to estimate (τ1T0 +1 , … , τ1T). The synthetic control method aims to construct the missing counterfactual outcome
is not observed after the intervention period, we need to estimate (τ1T0 +1 , … , τ1T). The synthetic control method aims to construct the missing counterfactual outcome ![]() from a weighted average of the districts in the donor pool that did not implement the same reform. Let W = (w2 , … , wJ+1)’ be a (J × 1) vector of weights such that 0≤ w for j = 2, … , J + 1 and
from a weighted average of the districts in the donor pool that did not implement the same reform. Let W = (w2 , … , wJ+1)’ be a (J × 1) vector of weights such that 0≤ w for j = 2, … , J + 1 and ![]() , where each value of W denotes a potential synthetic control for district i (Sumedang). Further, define
, where each value of W denotes a potential synthetic control for district i (Sumedang). Further, define ![]() as a linear combination of pre-implementation access to the basic service. Abadie, Diamond and Hainmueller (2010) demonstrate that if one can choose W* such that the following conditions hold or hold approximately,
as a linear combination of pre-implementation access to the basic service. Abadie, Diamond and Hainmueller (2010) demonstrate that if one can choose W* such that the following conditions hold or hold approximately,

then

would provide an unbiased estimator of τ1t.
Let X1 be a vector of pre-implementation characteristics for Sumedang and let X0 contain similar variables for the other districts in the sample. The vector W* is chosen to minimise ![]() , where V is a (k × k) symmetric and positive semi-definite matrix. V is chosen to minimise the mean square prediction error (MSPE) of the outcome variable in the pre-implementation period. V reflects the relative predictive power of the predictor variables on the outcome. In this study, V is chosen through a data-driven procedure.Footnote4
, where V is a (k × k) symmetric and positive semi-definite matrix. V is chosen to minimise the mean square prediction error (MSPE) of the outcome variable in the pre-implementation period. V reflects the relative predictive power of the predictor variables on the outcome. In this study, V is chosen through a data-driven procedure.Footnote4
I also conducted interviews and collected documents to gain an insight into how the local government had allocated resources. The interviews aimed to elicit informants’ opinions on the processes and results of participatory planning and budgeting.
Data and Variables of Interest
In this paper, I use four of the six indicators recommended by Lewis, McCulloch and Sacks (Citation2016) to measure local government service delivery performance in Indonesia. The four indicators are household access to safe water and sanitation and the net junior and senior secondary school enrolment rates.Footnote5 Data on the outcome variables were sourced from the annual National Socio-Economic Survey (Susenas) conducted by the central statistics agency (BPS).Footnote6
Data on the outcome variables for the district level used in this study cover the period 1996–2013. Thus, the data cover the 12-year period before Local Regulation 1/2007 came into effect (1996–2007) and the six-year period after it was implemented (2008–13), except for household access to safe sanitation, where data for 2005 were not available.
To construct synthetic Sumedang, I use a set of predictors that have been used in other studies to evaluate access to basic services. Like Jaramillo and Alcázar (Citation2013), who investigated the effect of participatory budgeting on water and sanitation coverage in Peru, and Patunru (Citation2015), who analysed access to safe water and sanitation in Indonesia, I include several population characteristics: total population, share of urban population, poverty rate and per capita expenditure. It is also considered essential in the literature to consider the availability of resources, particularly in determining the success of institutions in achieving their goals (Goldfrank Citation2007, Citation2011; Touchton and Wampler Citation2014). Therefore, following Lewis (Citation2014), who assesses intergovernmental performance grants in the water sector in Indonesia, I include the financial capacity of local governments, specifically General Purpose Fund (DAU) grants, Specific Purpose Fund (DAK) grants, own-source revenue (PAD) and total gross regional domestic product (GRDP) including oil and gas (in constant prices).
Data for the predictor variables were obtained from the Indonesia Database for Policy and Economic Research (INDO-DAPOER) (World Bank Citation2019), except for per capita expenditure, which I estimated directly from Susenas data.Footnote7 The values of the outcome variables in the four years before Local Regulation 1/2007 took effect (that is, in 2004, 2005, 2006 and 2007 for access to safe water and for the junior and senior secondary school enrolment rates, and in 2003, 2004, 2006 and 2007 for access to safe sanitation) were added to the list of predictors, as it is important to obtain a good fit of the last years before treatment occurred (Kaul et al. Citation2018).Footnote8
I chose 2013 as the end year because several districts in West Java province have begun to implement the PIK scheme since 2014, including Sukabumi, Bandung and Ciamis. I chose 2007 as T0 because Local Regulation 1/2007 was enacted in January 2007 before the village-level Musrenbang was held, and reports suggest that it was implemented immediately (Muluk and Djohani Citation2007; Muluk and Suherman Citation2011). The results of 2007 planning were implemented in the 2008 financial year; thus, 2008 is the first year in which the effects of the regulation on service delivery can be evaluated.
I chose districts in West Java province as the donor pool in order to control for interventions that may have been undertaken by other provincial governments, which could have affected service delivery performance. During the period under investigation, several districts in West Java were subdivided to create new districts.Footnote9 To maintain the consistency of the panel data, the new districts were re-amalgamated back into their original boundaries for the entire period. This provided 19 control districts to construct synthetic Sumedang. Although some of these districts are Sumedang’s neighbours, there are not likely to be substantial spillover effects between them and Sumedang. This is because, under the Indonesian decentralisation system, local planning and budgeting reforms must be provided with a legal framework through either a local regulation or a district head decree, and none of Sumedang’s neighbours had adopted reforms similar to Sumedang’s during the period under investigation. Furthermore, although a joint ministerial decree issued in 2007 required all districts to implement the Musrenbang system,Footnote10 it did not require them to implement the PIK, FDM or other reforms legislated in Sumedang.
RESULTS AND INFERENCES
Household Access to Safe Sanitation
In this section, I present only the district weights and predictor means of synthetic Sumedang for the effect of Local Regulation 1/2007 on household access to safe sanitation for the whole population. The district weights and predictor means of synthetic Sumedang for each per capita expenditure quintile of the population and the remaining services are presented in the online appendices.
Recall that synthetic Sumedang was constructed using the weighted average of districts from the donor pool. presents the weight of each district that makes up synthetic Sumedang for the effect of Local Regulation 1/2007 on household access to safe sanitation for the whole population. Synthetic Sumedang is best produced by a combination of six districts and municipalities: the districts of Indramayu (0.132), Subang (0.253), Purwakarta (0.369) and Bekasi (0.027) plus the municipalities of Bogor (0.163) and Cirebon (0.056).
Table 1. Access to Safe Sanitation: District Weights for Synthetic Sumedang (overall population)
reports the gaps between Sumedang and its synthetic version for the four lagged outcome variables and the other predictor means in the pre-implementation period for household access to safe sanitation for the whole population. The gaps between Sumedang and its synthetic version are quite small compared to the gaps between Sumedang and the sample mean, particularly for the variables that have larger predictive power, V. This suggests that the synthetic control method is able to approximate the pre-intervention characteristics of Sumedang. Thus, it provides a better approximation than simply using the sample mean.
Table 2. Access to Safe Sanitation: Predictor Means (overall population)
shows the trajectories of household access to safe sanitation in Sumedang and synthetic Sumedang for the overall population, and for each per capita expenditure quintile of the population. The figure shows that the synthetic control methods have succeeded in producing synthetic versions of Sumedang that have similar trajectories to Sumedang’s during the pre-implementation period. (T0, the year 2007, is marked by a vertical dotted line.) As shows, in general, after the implementation of Local Regulation 1/2007, household access to safe sanitation for the whole population and for all expenditure quintiles was higher than the counterfactual synthetics. The estimated treatment effect of the intervention for the whole population in 2007–13 was, on average, 5.28 percentage points per year; the treatment effect for the first, second, third, fourth and fifth quintiles was 7.65, 9.02, 12.42, 5.26 and 2.94 percentage points per year, respectively.
FIGURE 1 Trends in Household Access to Safe Sanitation: Sumedang vs Synthetic Sumedang and Placebo Gaps (excludes districts with pre-intervention MSPE five times higher than Sumedang’s)
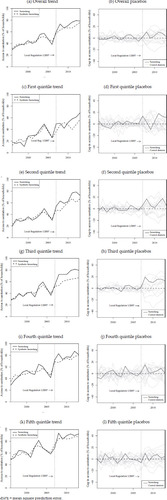
To assess the significance of the results, as suggested by Abadie, Diamond and Hainmueller (Citation2010, 2015), I conducted placebo studies by iteratively estimating the placebo effects for each district in the donor pool as if the districts had implemented a reform similar to Local Regulation 1/2007 during the period under investigation. If the placebo studies produce magnitudes similar to or greater than the treated district, then one can conclude that there is no significant evidence of positive effects of Local Regulation 1/2007 on household access to safe sanitation. In contrast, if the placebo tests show that the treatment effect is substantially larger than the placebo effects, then one can conclude that the treatment effect is significant.
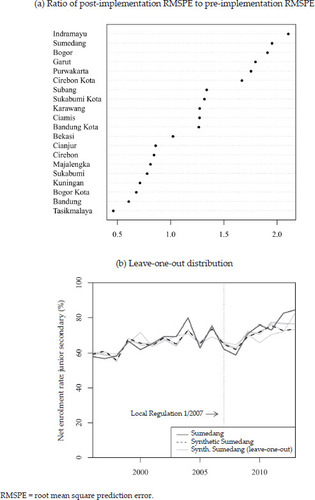
The placebo tests in show that most of the Sumedang gap lines fall inside the distribution of the placebo gaps of the control districts. This suggests that there is no significant evidence of a positive effect of Local Regulation 1/2007 on household access to safe sanitation. In this study, the placebo gaps exclude districts with a pre-treatment MSPE five times higher than Sumedang’s. However, for the third quintile, the Sumedang gap line is higher than most of the placebo lines, as depicted in h. As mentioned, the analysis suggests that from 2007 to 2013, access to safe sanitation for the third quintile increased by an average of 12.42 percentage points per annum, or 22.73% of the 2007 baseline level. Nevertheless, the distribution of the post- to pre-implementation ratio (a) shows that Sumedang has the fourth-highest ratio. The probability of randomly obtaining a post- to pre-implementation ratio from the sample is 4/20 = 0.20. This suggests that the effect is somehow insignificant, as some placebo gaps are larger than the real intervention effect.Footnote11
FIGURE 2 Household Access to Safe Sanitation for the Third Quintile: Ratio of Post-Implementation RMSPE to Pre-Implementation RMSPE and Leave-One-Out Distribution, Sumedang and Control Districts
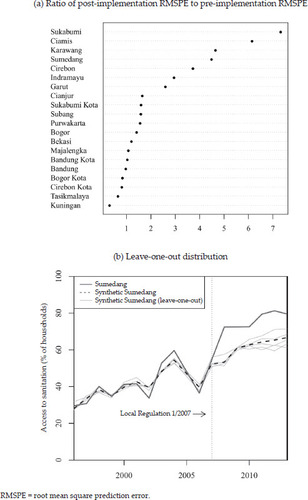
To further investigate the effect of Local Regulation 1/2007 on household access to safe sanitation for the third quintile, I conducted a robustness test using leaveone-out to assess the sensitivity of the analysis to changes in district weight W*. b shows that the trend produced for the third quintile in the previous analysis is quite robust to district exclusion. Hence, the results tentatively suggest that the third quintile may have benefited from the reform. The post- to pre-implementation ratios for each outcome and each quintile group are presented in the online appendices.
Household Access to Safe Water
depicts the trends in household access to safe water. It shows that, in general, household access to safe water declined after Local Regulation 1/2007 was implemented. On average, the decrease for the whole population and the first, second, third, fourth and fifth quintiles was 0.99, 1.35, 0.81, 1.32, 2.68 and 3.26 percentage points per year, respectively. However, the placebo tests () show that the Sumedang gap lines fall inside the permutation lines. This indicates that the effects of PIK funding on household access to safe water for the overall population and for each per capita expenditure quintile are not significant.
FIGURE 3 Trends in Household Access to Safe Water: Sumedang vs Synthetic Sumedang and Placebo Gaps (excludes districts with pre-intervention MSPE five times higher than Sumedang’s)
Net Junior Secondary School Enrolment Rate
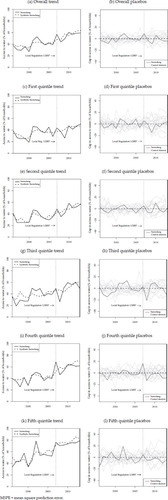
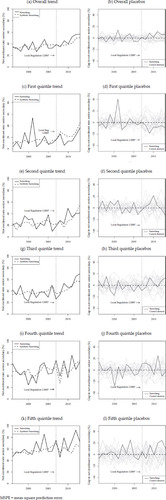
depicts the trends in the net junior secondary school enrolment rate for Sumedang and its synthetic versions. It suggests that, after several years of implementation, Local Regulation 1/2007 improved the net junior secondary school enrolment rate for the overall population compared to the synthetic version, as shown in a. The reform appears to take effect in 2012 and 2013. The net junior secondary school enrolment rate increased by an average of 2.51 percentage points per year during 2007–13, equivalent to around 4.03% of the 2007 baseline level.
FIGURE 4 Trends in Net Junior Secondary School Enrolment Rate: Sumedang vs Synthetic Sumedang and Placebo Gaps (excludes districts with pre-intervention MSPE five times higher than Sumedang’s)
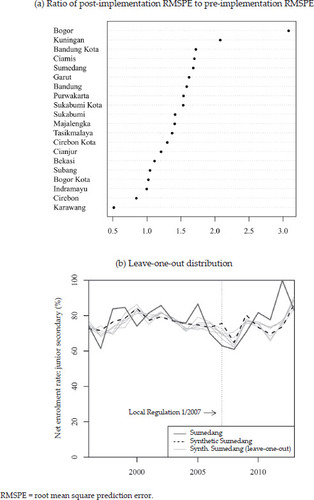
The placebo tests displayed in b show that the Sumedang gap line is higher than most of the placebo lines during 2012–13. The leave-one-out dis tributions depicted in b, which assess the sensitivity of the analysis to changes in district weight, confirm that the result is fairly robust. The post- to pre-implementation ratio for the net junior secondary school enrolment rate for the overall population (a) shows that Sumedang has the second-highest ratio among the districts. The probability of randomly obtaining the ratio from the data is 2/20 = 0.10, which indicates that the effect is significant at the 10% level. The analysis therefore provides some evidence that the reform increased the net junior secondary school enrolment rate for the overall population.
FIGURE 5 Net Junior Secondary School Enrolment Rate for the Whole Population: Ratio of Post-Implementation RMSPE to Pre-Implementation RMSPE and Leave-One-Out Distribution, Sumedang and Control Districts
The net enrolment rate for the first quintile follows a similar trend to the one for the overall population, with the effect of the reform becoming apparent from 2010 (c). The average increase in the treatment effect for the first quintile was 5.54 percentage points per year. However, the post- to pre-implementation ratio suggests that the effect is not significant (see figure A3b in the online appendices). This may be due to the poor pre-implementation fit, as the pre-intervention line fluctuated markedly.
e shows that the net junior secondary school enrolment rate for the second quintile fluctuated during the post-intervention period. The post- to pre-implementation ratio for the second quintile (see figure A3c in the online appendices) shows that Sumedang has the second-highest ratio; the probability of randomly obtaining Sumedang’s ratio from the data is 2/20 = 0.10, which is significant at the 10% level. However, the placebo tests, depicted in f, suggest that the gap line also fluctuated greatly, making the significance of the result unclear. Nevertheless, it appears that, on average, the net enrolment rate for the second quintile decreased by 3.83 percentage points per year. This decrease is equivalent to around 7.14% of the 2007 baseline level. Compared to its counterfactual, the net enrolment rate for the group declined sharply by 23.44 percentage points in 2008 before rising by 18.78 percentage points in 2010. It then dropped by 25.27 percentage points in 2011 before rising by around 5 percentage points in 2012 and 2013.
For the third and fourth quintiles, the average increase per year in the net enrolment rate was 5.48 and 1.10 percentage points, respectively, but these effects are insignificant. Meanwhile, the net enrolment rate for the fifth quintile seemed to rise in 2010, as displayed in k. During the period after the intervention, the net enrolment rate for this group increased by an average of 1.76 percentage points per annum. The placebo studies in l show that the Sumedang gap line is higher than most of the placebo lines during 2010–12 before declining in 2013. The leave-one-out distribution depicted in b suggests that the result of the analysis is fairly robust to changes in district weight. Nevertheless, the probability of randomly obtaining Sumedang’s ratio from the data for the fifth quintile is 5/20 = 0.25, as depicted in the post- to pre-implementation ratio (a), which indicates that the effect is somehow insignificant. Analysis of the net enrolment rates for the overall population and the first quintile suggests that it may take time for participatory budgeting to have positive effects on the net enrolment rate.
FIGURE 6 Net Junior Secondary School Enrolment Rate for the Fifth Quintile: Ratio of Post-Implementation RMSPE to Pre-Implementation RMSPE and Leave-One-Out Distribution, Sumedang and Control Districts
Net Senior Secondary School Enrolment Rate
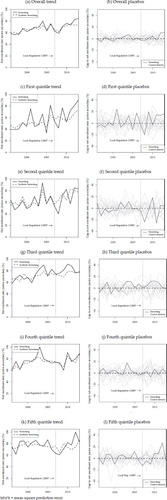
shows that the net senior secondary school enrolment rate increased after the implementation of Local Regulation 1/2007, except for the first quintile. The rates for the whole population and the second and fifth quintiles were mostly above the synthetic lines, while those for the third and fourth quintiles fluctuated around the synthetic lines. The average increase per annum in the net enrolment rate for the whole population and for the second, third, fourth and fifth quintiles was 4.57, 2.29, 3.33, 5.09 and 9.77 percentage points, respectively. On the other hand, the net enrolment rate for the first quintile declined by an average of 7.53 percentage points per year.
FIGURE 7 Trends in Net Senior Secondary School Enrolment Rate: Sumedang vs Synthetic Sumedang and Placebo Gaps (excludes districts with pre-intervention MSPE five times higher than Sumedang’s)
The placebo tests for the whole population and all quintiles (), as well as the post- to pre-implementation ratios (see figure A4 in the online appendices), suggest that these effects are not significant, as most of the Sumedang gap lines fall inside the permutation lines. Furthermore, the pre-treatment fits are quite poor due to the significant fluctuations during the pre-treatment period. This may have affected the analysis.
DISCUSSION
Focus on Road and Bridge Projects
Overall, the results suggest that the implementation of Local Regulation 1/2007 in Sumedang improved the net junior secondary school enrolment rate for the overall population; it may also have improved household access to safe sanitation for the third quintile, as well as the net junior secondary school enrolment rate for the fifth quintile. However, it did not improve the other services evaluated here, and it also does not appear to have improved the access of the poorest two quintiles of the population to services. This suggests that participatory budgeting in Sumedang was not pro-poor.
One way to investigate why participatory budgeting produced such results is to examine how PIK funding was allocated. I therefore looked at how PIK was allocated in the Local Government Work Plans (RKPD) for Sumedang district from 2009 to 2013.Footnote12 It would of course have been better to start from 2007, but unfortunately data were only available for 2009–13, having been obtained during fieldwork.
My analysis of the work plans for 2009–13 showed that a large proportion of PIK funding (26%–53%) was allocated to the public works sector (figure B1 in the online appendices). A closer look at the PIK funding managed by Sumedang’s Public Works Agency showed that road and bridge projects accounted for about 40%–70% of PIK, followed by irrigation schemes, accounting for 17%–20% (figure B2). A high proportion of PIK funding, approximately 20%, was allocated to clean water in 2009, but this declined to around 4% in the ensuing years.
In the education sector, early childhood education received the majority of PIK funding during the period (figure B3). Small amounts were allocated to support the nine-year compulsory education program, covering students in primary and junior secondary school. Some of this funding was used to assist students who were at risk of leaving school early and to provide stationery for poor students, but the amounts were very limited. PIK funding for non-formal (out-of-school) education was mostly targeted towards the Package B program (equivalent to junior secondary school) and the Package C program (equivalent to senior secondary school), but the proportion of such funding declined during the period.
The nine-year compulsory education program did, however, receive a considerable amount of PI-SKPD funding during 2009–13. Nonetheless, according to an analysis by Seknas FITRA (2011, 50), direct expenditure on this area of education accounted for only 25% of the budget of the Sumedang Education Agency in 2007–10—the third lowest among the 31 districts and municipalities included in the analysis—with most of it (90%) being used to fund infrastructure (p. 51). In 2013, the Sumedang Education Agency allocated 42% of its direct expenditure to the compulsory education program. This corresponded with an improvement in the net junior secondary school enrolment rate during 2012–13. In the public works sector, meanwhile, the PI-SKPD allocations were very similar to the PIK allocations, with the majority being used to support road and bridge projects.
In the health sector, PIK spending was dominated by community health infrastructure, as well as the health promotion and community empowerment program (figure B4). The proportion of PIK allocated to the health promotion and community empowerment program (including activities to increase awareness of maternal health) was relatively high in 2009–11, reaching 65%, but dropped sharply in 2012–13 to around 6%. The proportion allocated to the pregnancy and children’s health program was minimal throughout the period.
These resource allocations provide insights into how PIK was allocated, and may explain the insignificant effect of participatory budgeting on the services evaluated here. Many studies have observed that there is a trade-off between services under participatory budgeting as a consequence of limited resources (see, for example, Gonçalves Citation2014). PIK may have effected improvements in other sectors, such as road quality or early childhood education, but a lack of data prevents an evaluation of these indicators.
The projects managed by the Sumedang Public Works Agency ranged from small to mid-sized infrastructure projects. The necessity to choose between focusing on small-scale infrastructure—infrastructure that meets the immediate needs of the community—and pursuing strategic government goals is one of the trade-offs in participatory institutions. A focus on fulfilling immediate needs may deliver what the community requires and legitimate participatory processes, but this often comes at the expense of accomplishing the broader government agenda (Wampler and Touchton Citation2017). In the case of Sumedang, the lack of effect on the services evaluated was not caused by the focus on small and localised infrastructure, but rather by the strategy of focusing on road and irrigation projects that consumed a high proportion of resources. Since these projects were proposed and endorsed by the community, it is fair to assume that they met the community’s immediate needs. This does not mean, however, that they met the immediate needs of the poor.
Elite Control
The synthetic control methods show that Local Regulation 1/2007 did not improve access to basic services for citizens in the poorest (first and second) expenditure quintiles in Sumedang. Responsiveness towards the poor can only be achieved if they are included in local decision-making (Jaramillo and Alcázar Citation2013, 3). Therefore, a potential explanation for the lack of effect on the poor is that they were not involved in Musrenbang and consequently did not have a channel to voice their demands. Musrenbang procedures in Sumedang did not require representation of the poor, and participants in the village-level Musrenbang tended to be people in positions of authority—village elites—who had been invited to attend. Although any eligible resident could register in order to participate, studies suggest that the opportunity cost of participation is high for the poorest sections of the community, preventing them from participating (World Bank Citation2008). Without sufficient incentives, such as a commitment by local government to prioritise the projects they propose, poor people are likely to remain under-represented in participatory institutions.
Most villages and wards in Sumedang provided a community consultation period during which neighbourhoods could formulate their proposals prior to the formal village Musrenbang being held. It is not clear whether marginalised groups were consulted during this phase, but it is evident that they were largely excluded from formal Musrenbang processes and, as a result, did not have sufficient influence—or ‘voice’—to sway decision-making in favour of projects that would benefit them. A study by Grillos (Citation2017) similarly concluded that the projects funded by block grants to urban villages (kelurahan) in Surakarta municipality, Central Java, did not target the poor because poorer citizens were excluded from decision-making processes.
As discussed previously, PIK funding in Sumedang was dominated by road and irrigation projects—that is, by projects that targeted a broad set of beneficiaries. Even though the PIK allocation criteria were biased in favour of less advantaged subdistricts, this did not translate into projects that targeted the poor. This is not to argue that road and other infrastructure projects are not important to reduce poverty. However, improving the accessibility and affordability of basic services for citizens who otherwise could not afford them would be of greater benefit to the poor (Ross Citation2006, 870). The lack of effect of Local Regulation 1/2007 on the indicators studied in this paper suggests that PIK funding did not reach the poor.
The dominance of local elites in participatory processes has shaped agenda setting (Fung and Wright Citation2003). As village elites and CSOs in Sumedang favoured projects with a broad set of beneficiaries, road and irrigation projects became dominant in PIK funding. It is important to note that the PIK allocations were expected to comply with the local government’s mid-term plans. Since roads and irrigation systems were the priorities in local government infrastructure and economic policy, they received large proportions of PIK funding during the period of study (see figure B2 in the online appendices). This further embedded elite control in PIK allocation processes.
It is evident that elite control in agenda setting has been very influential in determining whether resource allocation is pro-poor or targets a broader set of beneficiaries. However, as discussed below, Sumedang seems largely to have avoided elite capture—in the form of local bureaucrats ignoring or altering community decisions (Fung and Wright Citation2003)—perhaps because the proposals were aligned with the government’s priorities, which were in any case made public at the village-level Musrenbang.
The consensus-based nature of Musrenbang decision-making may also have contributed to less pro-poor decision-making in Sumedang. Wampler and Touchton (Citation2017, 11) argue that consensus-based decision-making in participatory budgeting is more susceptible to elite capture than voting-based decision-making because it allows local elites to dominate the proceedings. They also observe that it has become less common for participatory budgeting programs to mandate representation of, and projects targeting, the poor. But even if marginalised communities are involved in the deliberations, they may not possess the skills required to advocate for their needs (Fung and Wright Citation2003).
As noted above, there is no evidence of elite capture—that is, of elites maximising the potential benefits to them from participatory processes—in the Sumedang case. The analysis using synthetic control methods provides some evidence of improvement in household access to safe sanitation for the third quintile, and in the net junior secondary school enrolment rate for the fifth quintile. This suggests that participatory planning and budgeting in Sumedang may have benefited these groups, but the third and other upper quintiles did not dominate across the other outcomes. The dominance of local elites advocating for projects with a broad set of beneficiaries combined with the consensual nature of Musrenbang decisionmaking may have contributed to the lack of poverty targeting in Sumedang. As a result, the effect of participatory budgeting on service delivery performance remained limited.
Without efforts by the local leadership to specifically address the costs and promote the benefits of participating in Musrenbang, the poor are likely to remain left behind. To be effective, poverty targeting in participatory institutions requires cooperation between the bureaucracy and CSOs, clear criteria on beneficiaries and willingness by the community to prioritise the needs of marginalised groups. Interventions by the bureaucracy to increase the participation of the poor are essential; as Abers (Citation2000) has noted, one of the factors contributing to the success of participatory budgeting in Porto Alegre, Brazil, was that the government’s community organisers actively encouraged neighbourhood dwellers to participate in order to obtain public works in their area.
Studies on elite capture often suggest distinguishing between elite capture and elite control (Rao and Ibáñez Citation2005; Dasgupta and Beard Citation2007; Fritzen Citation2007), arguing that elite control may lead to more pro-poor targeting, or ‘benevolent capture’ (Rao and Ibáñez Citation2005). However, elite control in Sumedang has not produced pro-poor policy, as the findings of the synthetic control methods show. Studies on poverty alleviation programs in Indonesia suggest that such programs are more effective if they specifically target the poor (Fritzen Citation2007, 1371), and if the beneficiaries are determined by government criteria (Alatas et al. Citation2012). A recent study by Harun et al. (Citation2021, 343) on the national government’s Village Funds (Dana Desa) scheme also recommends channelling the grants ‘to provide direct aid for the poorest groups of people at the village level’.
CONCLUDING REMARKS
Even though Local Regulation 1/2007 in Sumedang integrates participatory planning with budgetary processes, and provides for community monitoring, it has had only limited effects on the local government’s service delivery performance. It is important to note that the community’s priorities have been funded through the PIK scheme unless they failed to meet technical requirements. This may mean that the needs of those who participated in the Musrenbang process were actually met.
PIK funding in Sumedang was allocated with a bias towards poorer subdistricts—as per the PIK distribution criteria—but the projects funded by PIK did not explicitly target the poor. Ross (Citation2006) suggests that unless services can be directed effectively to reach the poor, it is unlikely that access to those services will improve, because the upper quintiles can afford basic services without assistance from the government. From the start, CSOs have lobbied for mid-sized infrastructure projects rather than projects that specifically target poverty. Some of the funding has been used to directly assist the poor, including schemes to improve sanitation in poor areas and direct assistance to keep poor students in school. Most of the time, however, the funds have been allocated to road and irrigation projects. Infrastructure projects may help to reduce poverty, and Sumedang residents may indeed need better transportation infrastructure. In fact, road-related projects are apparently the most frequently built projects under participatory budgeting schemes around the world (Cabannes Citation2015).
Nevertheless, this study’s findings suggest that PIK funding should focus more on projects that target the poor, leaving medium-sized and large infrastructure projects to be funded by PI-SKPD. The absence of pro-poor PIK allocations in Sumedang may also be explained by the lack of incentives for marginalised groups to participate, and by the opportunity costs of participation, factors that may reinforce one another. It is therefore essential to ensure that the voice of the poor is accommodated by allocating a higher proportion of PIK funding to projects that specifically address their needs.
Considering the small proportion of the local budget allocated to PIK, it may not be fair to expect a sudden improvement in public services. Planning and budgeting processes remain highly political, as they must be considered and approved by the executive and legislative branches of government. Moreover, it is difficult for the community to directly influence the other, non-PIK proportion of the local budget—that is, PI-SKPD. There may be budget implementation issues that affect the quality of service delivery in Sumedang, or it may take a long time for participatory institutions to affect service delivery outcomes, as Fox (Citation2015) suggests. For example, using a smaller number of observations and a shorter time period, Boulding and Wampler (Citation2010) found that participatory budgeting did not affect infant mortality rates in Brazil; but based on a larger number of observations and a longer time period, both Touchton and Wampler (Citation2014) and Gonçalves (Citation2014) concluded that participatory budgeting did indeed reduce infant mortality rates in Brazil.
Supplemental Material
Download MS Word (23.6 KB)Supplemental Material
Download MS Word (9.9 MB)ACKNOWLEDGMENTS
This article is part of a PhD thesis at the Australian National University. I thank Katherine Daniell, Blane Lewis and Patrick Guinness for their support and helpful comments during the research for this article. I am also grateful for the comments on earlier versions of this manuscript by several anonymous reviewers. This research was funded by the Indonesian Endowment Fund for Education (LPDP) and supported by the Australian National University.
Notes
1 Based on Joint Ministerial Decree of the Ministry of Home Affairs and the National Development Planning Agency (Bappenas) No. 050/264A/SJ and No. 0008/M.PPN/01/2007 on Technical Guidance for the Implementation of Musrenbang.
2 The realised amount of PIK in 2008 (Rp 5 billion) differed from the allocated amount (Rp 25 billion) because some of the proposed projects did not comply with government regulatory and technical standards (Muluk and Suherman Citation2011). The amount of PIK was Rp 18.75 billion in 2009, Rp 15 billion in 2010 and 2011, Rp 25 billion in 2012, Rp 35 billion in 2013, Rp 45 billion in 2015 and Rp 50 billion in 2016.
3 The recruitment of FDM members was initially undertaken by CSOs (Muluk and Djohani Citation2007) but is now carried out by the Regional Development Planning Agency (Bappeda) after the district-level Musrenbang has been held.
4 The data-driven procedure was implemented in R version 3.6.1 using Synth package version 1.1-5 (Abadie, Diamond and Hainmueller Citation2011). The routine for quadratic optimisation was specified to be Low Rank Quadratic Programming using LowRankQP version 1.0.3; see Ormerod and Wand (Citation2018).
5 The two other indicators suggested by Lewis, McCulloch and Sacks (Citation2016) are the percentage of births assisted by skilled health staff and the immunisation rate for children under five years of age.
6 The Susenas data were mainly obtained from the Australian Data Archive. I have used BPS’s definitions of services as the basis for my estimates. Household access to safe sanitation is defined as households that have access to personal or shared S-bend toilets with a septic tank as the final disposal location. Household access to safe water is defined as households that have access to metered piped water, to retailed piped rainwater or to protected/covered wells or protected springs or artesian wells/pumps located at least 10 metres from a septic tank. I also include refilled water and branded bottled water, which were used by Patunru (Citation2015) in a study on water and sanitation in Indonesia. The net junior secondary school enrolment rate is the percentage of students aged 13–15 attending junior secondary school/special needs junior secondary school, Islamic junior secondary school (madrasah tsanawiya) or a package B (out-of-school) program. The net senior secondary school enrolment rate is the percentage of students aged 16–18 attending senior secondary school/special needs senior secondary school, Islamic senior secondary school (madrasah aliyah), senior vocational secondary school or a package C (out-of-school) program. The estimations were undertaken in R version 3.6.0 using Survey package version 3.36 (see Lumley Citation2010, Citation2019).
7 Data from INDO-DAPOER were last updated on 7 May 2019. The data used in this study were retrieved on 14 May 2019.
8 Several studies have investigated the use of lagged outcomes as additional predictors, although they are not conclusive; see, for example, Ferman, Pinto and Possebom (Citation2018) and Kaul et al. (Citation2018, 29).
9 These included Bekasi municipality (which split from Bekasi district in 1996), Depok municipality (which split from Bogor district in 1999), Tasikmalaya municipality (which split from Tasikmalaya district in 2001), Cimahi municipality (which split from Bandung district in 2001), Banjar municipality (which split from Ciamis district in 2002), West Bandung district (which split from Bandung district in 2007) and Pangandaran district (which split from Ciamis district in 2012).
10 Joint Ministerial Decree of the Ministry of Home Affairs and the National Development Planning Agency (Bappenas) No. 050/264A/SJ and No. 0008/M.PPN/01/2007 on Technical Guidance for the Implementation of Musrenbang.
11 Abadie, Diamond and Hainmueller (Citation2015) suggest an alternative way to conduct placebo tests, which is to shift the intervention event to an earlier year before the real intervention. I do not do this in this study because synthetic control methods require a relatively long preintervention period to construct a credible counterfactual, and the pre-intervention period in this study is relatively short (Abadie, Diamond and Hainmueller Citation2010, 2015).
12 The total amount of PIK in the work plans was Rp 25 billion in 2009, Rp 15 billion in 2010, Rp 15 billion in 2011, Rp 21.5 billion in 2012 and Rp 25 billion in 2013.
REFERENCES
- Abadie, Alberto, Alexis Diamond and Jens Hainmueller. 2010. ‘Synthetic Control Methods for Comparative Case Studies: Estimating the Effect of California’s Tobacco Control Program’. Journal of the American Statistical Association 105 (490): 493–505. https://doi.org/10.1198/jasa.2009.ap08746
- Abadie, Alberto, Alexis Diamond and Jens Hainmueller. 2011. ‘Synth: An R Package for Synthetic Control Methods in Comparative Case Studies’. Journal of Statistical Software 42 (13): 1–17. https://doi.org/10.18637/jss.v042.i13
- Abadie, Alberto, Alexis Diamond and Jens Hainmueller. 2015. ‘Comparative Politics and the Synthetic Control Method’. American Journal of Political Science 59 (2): 495–510. https://doi.org/10.1111/ajps.12116
- Abadie, Alberto and Javier Gardeazabal. 2003. ‘The Economic Costs of Conflict: A Case Study of the Basque Country’. American Economic Review 93 (1): 113–32. https://doi.org/10.1257/000282803321455188
- Abers, Rebecca Neaera. 2000. Inventing Local Democracy: Grassroots Politics in Brazil. Boulder, CO: Lynne Rienner Publishers.
- Ackerman, John. 2004. ‘Co-governance for Accountability: Beyond “Exit” and “Voice”‘. World Development 32 (3): 447–63. https://doi.org/10.1016/j.worlddev.2003.06.015
- Alatas, Vivi, Abhijit Banerjee, Rema Hanna, Benjamin A. Olken and Julia Tobias. 2012. ‘Targeting the Poor: Evidence from a Field Experiment in Indonesia’. American Economic Review 102 (4): 1206–40. https://doi.org/10.1257/aer.102.4.1206
- Baiocchi, Gianpaolo, Patrick Heller, Shubham Chaudhuri and Marcelo Kunrath Silva. 2006. ‘Evaluating Empowerment: Participatory Budgeting in Brazilian Municipalities’. In Empowerment in Practice: From Analysis to Implementation, edited by Ruth Alsop, Mette Bertelsen and Jeremy Holland, 95–124. Washington, DC: World Bank. https://doi.org/10.1596/978-0-8213-6450-5
- Baiocchi, Gianpaolo, Patrick Heller and Marcelo Kunrath Silva. 2011. Bootstrapping Democracy: Transforming Local Governance and Civil Society in Brazil. Stanford, CA: Stanford University Press.
- Besley, Timothy, Rohini Pande and Vijayendra Rao. 2005. ‘Participatory Democracy in Action: Survey Evidence from South India’. Journal of the European Economic Association 3 (2–3): 648–57. https://doi.org/10.1162/jeea.2005.3.2-3.648
- Beuermann, Diether W. and Maria Amelina. 2014. ‘Does Participatory Budgeting Improve Decentralized Public Service Delivery?’ IDB Working Paper Series 547. Washington DC: Inter-American Development Bank. https://publications.iadb.org/handle/11319/6699
- Boulding, Carew and Brian Wampler. 2010. ‘Voice, Votes, and Resources: Evaluating the Effect of Participatory Democracy on Well-being’. World Development 38 (1): 125–35. https://doi.org/10.1016/j.worlddev.2009.05.002
- Brinkerhoff, Derick W. and Omar Azfar. 2006. ‘Decentralization and Community Empowerment: Does Community Empowerment Deepen Democracy and Improve Service Delivery?’ Paper prepared for US Agency for International Development Office of Democracy and Governance. Washington, DC: RTI International. http://pdf.usaid.gov/pdf_docs/Pnadh325.pdf
- Cabannes, Yves. 2004. ‘Participatory Budgeting: A Significant Contribution to Participatory Democracy’. Environment and Urbanization 16 (1): 27–46. https://doi.org/10.1177/095624780401600104
- Cabannes, Yves. 2015. ‘The Impact of Participatory Budgeting on Basic Services: Municipal Practices and Evidence from the Field’. Environment and Urbanization 27 (1): 257–84. https://doi.org/10.1177/0956247815572297
- Dasgupta, Aniruddha and Victoria A. Beard. 2007. ‘Community Driven Development, Collective Action and Elite Capture in Indonesia’. Development and Change 38 (2): 229–49. https://doi.org/10.1111/j.1467-7660.2007.00410.x
- Donaghy, Maureen M. 2011. ‘Do Participatory Governance Institutions Matter? Municipal Councils and Social Housing Programs in Brazil’. Comparative Politics 44 (1): 83–102. https://doi.org/10.5129/001041510X13815229366606
- Faguet, Jean-Paul. 2014. ‘Decentralization and Governance’. World Development 53 (2): 2–13. https://doi.org/10.1016/j.worlddev.2013.01.002
- Ferman, Bruno, Cristine Pinto and Vitor Possebom. 2018. ‘Cherry Picking with Synthetic Controls’. MPRA Paper No. 85138. Sao Paulo School of Economics (FGV EESP). https://mpra.ub.uni-muenchen.de/85138/
- Fox, Jonathan A. 2015. ‘Social Accountability: What Does the Evidence Really Say?’ World Development 72: 346–61. https://doi.org/10.1016/j.worlddev.2015.03.011
- Fritzen, Scott A. 2007. ‘Can the Design of Community-Driven Development Reduce the Risk of Elite Capture? Evidence from Indonesia’. World Development 35 (8): 1359–75. https://doi.org/10.1016/j.worlddev.2007.05.001
- Fung, Archon and Erik Olin Wright. 2003. ‘Thinking about Empowered Participatory Governance’. In Deepening Democracy: Institutional Innovations in Empowered Participatory Governance, edited by Archon Fung and Erik Olin Wright, 3–42. London: Verso.
- Goldfrank, Benjamin. 2007. ‘Lessons from Latin America’s Experience with Participatory Budgeting’. In Participatory Budgeting, edited by Anwar Shah, 91–126. Washington, DC: World Bank. http://hdl.handle.net/10986/6640
- Goldfrank, Benjamin. 2011. Deepening Local Democracy in Latin America: Participation, Decentralization and the Left. Pennsylvania, PA: Penn State University Press.
- Gonçalves, Sónia. 2014. ‘The Effects of Participatory Budgeting on Municipal Expenditures and Infant Mortality in Brazil’. World Development 53: 94–110. https://doi.org/10.1016/j.worlddev.2013.01.009
- Grillos, Tara. 2017. ‘Participatory Budgeting and the Poor: Tracing Bias in a Multi-staged Process in Solo, Indonesia’. World Development 96: 343–58. https://doi.org/10.1016/j.worlddev.2017.03.019
- Harun, Harun, Peter Graham, Haryono P. Kamase and Monir Mir. 2021. ‘A Critical Analysis of the Impacts of Financial Literacy and NPM on Village Funds Initiative in Indonesia’. International Journal of Public Administration 44 (4): 336–45. https://doi.org/10.1080/01900692.2020.1722165
- Hofman, Bert and Kai Kaiser. 2004. ‘The Making of the “Big Bang” and Its Aftermath: A Political Economy Perspective’. In Reforming Intergovernmental Fiscal Relations and the Rebuilding of Indonesia: The ‘Big Bang’ Program and Its Economic Consequences, edited by James Alm, Jorge Martinez-Vazquez and Sri Mulyani Indrawati, 15–46. Cheltenham: Edward Elgar. https://doi.org/10.4337/9781845421656.00007
- Hossain, A. N. M. Zakir, Anwara Begum, Muhammad Shafiul Alam and Md. Shahidul Islam. 2014. ‘Participatory Budgeting in Bangladesh Local Government Context’. Public Administration Research 3 (2): 28–43. https://doi.org/10.5539/par.v3n2p28
- Jaramillo, Miguel and Lorena Alcázar. 2013. ‘Does Participatory Budgeting Have an Effect on the Quality of Public Services? The Case of Peru’s Water and Sanitation Sector’. IDB Working Paper Series 386. Washington, DC: Water and Sanitation Division, InterAmerican Development Bank. https://publications.iadb.org/handle/11319/4235
- Jaramillo, Miguel and Glenn Daniel Wright. 2015. ‘Participatory Democracy and Effective Policy: Is There a Link? Evidence from Rural Peru’. World Development 66: 280–92. https://doi.org/10.1016/j.worlddev.2014.08.011
- Kaul, Ashok, Stefan Klößner, Gregor Pfeifer and Manuel Schieler. 2018. ‘Synthetic Control Methods: Never Use All Pre-intervention Outcomes together with Covariates’. Working paper. Saarland University and University of Hohenheim. http://www.oekonometrie.uni-saarland.de/papers/SCM_Predictors.pdf
- Kis-Katos, Krisztina and Bambang Suharnoko Sjahrir. 2017. ‘The Impact of Fiscal and Political Decentralization on Local Public Investment in Indonesia’. Journal of Comparative Economics 45 (2): 344–65. https://doi.org/10.1016/j.jce.2017.03.003
- Lewis, Blane D. 2014. ‘Indonesian Intergovernmental Performance Grants: An Empirical Assessment of Impact’. Bulletin of Indonesian Economic Studies 50 (3): 415–33. https://doi.org/10.1080/00074918.2014.980378
- Lewis, Blane D. 2017. ‘Local Government Spending and Service Delivery in Indonesia: The Perverse Effects of Substantial Fiscal Resources’. Regional Studies 51 (11): 1695–707. https://doi.org/10.1080/00343404.2016.1216957
- Lewis, Blane D. 2018. ‘Local Government Form in Indonesia: Tax, Expenditure, and Efficiency Effects’. Studies in Comparative International Development 53 (1): 25–46. https://doi.org/10.1007/s12116-017-9236-z
- Lewis, Blane D., Neil McCulloch and Audrey Sacks. 2016. ‘Measuring Local Government Service Delivery Performance: Challenges and (Partial) Solutions in Indonesia’. Journal of International Development 28 (5): 808–17. https://doi.org/10.1002/jid.3106
- Lumley, Thomas. 2010. Complex Surveys: A Guide to Analysis Using R. Hoboken, NJ: John Wiley & Sons.
- Lumley, Thomas. 2019. ‘Survey: Analysis of Complex Survey Samples’. Last modified: 27 April 2019. https://CRAN.R-project.org/package=survey
- Muluk, Saeful and Ria R. Djohani. 2007. ‘Praktik Musyawarah Perencanaan Pembangunan di Kabupaten Sumedang: Inovasi yang Memberikan Harapan’ [The Practice of Participatory Planning in Sumedang District: An Innovation that Brings Hope]. Inisiatif, Forum Pengembangan Partisipasi Masyarakat and Asia Foundation. http://inisiatif.org/wp-content/uploads/2015/12/07-Musrenbang-Kabupaten-Sumedang-Inovasi-yg-Memberikan-Harapan.pdf
- Muluk, Saeful and Nandang Suherman. 2011. ‘Institutionalization of Participation and Transparency in Local Budget: Experience of Local Regulation Advocacy on Local Planning and Budgeting in Sumedang District, West Java Province’. In Show Me the Money: Budget Advocacy in Indonesia, edited by Wahyu W. Basjir and Debbie Budlender, 89–106.
- Yogyakarta: IDEA/Inisiatif/Lakpesdam NU/PATTIRO/Seknas FITRA/International Budget Partnership. https://ssrn.com/abstract=2333816
- Ormerod, John T. and Matt P. Wand. 2018. ‘LowRankQP: Low Rank Quadratic Programming’. Last modified: 7 February 2018. https://CRAN.R-project.org/package=LowRankQP
- Pateman, Carole. 2012. ‘Participatory Democracy Revisited’. Perspectives on Politics 10 (1): 7–19. https://doi.org/10.1017/S1537592711004877
- Patunru, Arianto A. 2015. ‘Access to Safe Drinking Water and Sanitation in Indonesia’. Asia & the Pacific Policy Studies 2 (2): 234–44. https://doi.org/10.1002/app5.81
- Rao, Vijayendra and Ana María Ibáñez. 2005. ‘The Social Impact of Social Funds in Jamaica: A “Participatory Econometric” Analysis of Targeting, Collective Action, and Participation in Community-Driven Development’. Journal of Development Studies 41 (5): 788–838. https://doi.org/10.1080/00220380500145297
- Ross, Michael. 2006. ‘Is Democracy Good for the Poor?’ American Journal of Political Science 50 (4): 860–74. https://doi.org/10.1111/j.1540-5907.2006.00220.x
- Seknas FITRA. 2011. ‘Analisis Anggaran Daerah: Studi terhadap Anggaran Tahun 2007–2010 di 42 Kabupaten/Kota dan 5 Provinsi di Indonesia’ [Local Budget Analysis: A Study of Local Budgets in 42 Districts/Municipalities and 5 Provinces in Indonesia]. Jakarta: Seknas FITRA. http://seknasfitra.org/publication/kinerja-pengelolaan-anggaran-daerah-2010/
- Shah, Anwar, ed. 2007. Local Budgeting. Washington, DC: World Bank. http://hdl.handle.net/10986/6669
- Sheely, Ryan. 2015. ‘Mobilization, Participatory Planning Institutions, and Elite Capture: Evidence from a Field Experiment in Rural Kenya’. World Development 67: 251–66. https://doi.org/10.1016/j.worlddev.2014.10.024
- Silver, Christopher and Tubagus Furqon Sofhani. 2008. ‘University–Community Partnership: Institutionalizing Empowered and Participatory Planning in Indonesia’. In Planning and Decentralization: Contested Spaces for Public Action in the Global South, edited by Victoria A. Beard, Faranak Miraftab and Christopher Silver, 158–74. London: Routledge. https://doi.org/10.4324/9780203928264
- Skoufias, Emmanuel, Ambar Narayan, Basab Dasgupta and Kai Kaiser. 2014. ‘Electoral Accountability and Local Government Spending in Indonesia’. Policy Research Working Paper No. 6782. Washington, DC: World Bank. https://doi.org/10.1596/1813-9450-6782
- Speer, Johanna. 2012. ‘Participatory Governance Reform: A Good Strategy for Increasing Government Responsiveness and Improving Public Services?’ World Development 40 (12): 2379–98. https://doi.org/10.1016/j.worlddev.2012.05.034
- Sumarto, Hetifah Sj. 2008. ‘Promoting Citizen Participation in Local Governance in Indonesia: Practices, Policies, and Agenda’. Jakarta: Local Government Support Program. http://unpan1.un.org/intradoc/groups/public/documents/apcity/unpan049827.pdf
- Touchton, Michael and Brian Wampler. 2014. ‘Improving Social Well-being through New Democratic Institutions’. Comparative Political Studies 47 (10): 1442–69. https://doi.org/10.1177/0010414013512601
- Usui, Nario and Armida S. Alisjahbana. 2005. ‘Local Development Planning and Budgeting in De-centralised Indonesia: Missing Links in the Bottom-Up Approach’. Kansai University Review of Economics 7: 71–97. http://ci.nii.ac.jp/naid/110004708314
- Valsecchi, Michele. 2013. ‘Local Elections and Corruption during Democratization: Evidence from Indonesia’. Working paper. Gothenburg: University of Gothenburg. http://www.economics.handels.gu.se/digitalAssets/1457/1457696_130130_mv_corruption.pdf
- Wampler, Brian. 2007. Participatory Budgeting in Brazil: Contestation, Cooperation, and Accountability. University Park, PA: Pennsylvania State University Press.
- Wampler, Brian and Michael Touchton. 2017. ‘Participatory Budgeting: Adoption and Transformation’. Making All Voices Count Research Briefing. Brighton: Institute of Development Studies. https://opendocs.ids.ac.uk/opendocs/handle/123456789/13366
- World Bank. 2008. Brazil: Toward a More Inclusive and Effective Participatory Budget in Porto Alegre. Vol. 1. Washington, DC: World Bank. http://hdl.handle.net/10986/8042
- World Bank. 2019. Indonesia Database for Policy and Economic Research (INDO-DAPOER). Last modified: 7 May 2019. http://databank.worldbank.org/data/reports.aspx?source=1266