
 ?Mathematical formulae have been encoded as MathML and are displayed in this HTML version using MathJax in order to improve their display. Uncheck the box to turn MathJax off. This feature requires Javascript. Click on a formula to zoom.
Abstract
Statistical literacy has a large and important role in the teaching of statistics. Most mathematics and statistics courses are hierarchical, and the earlier material forms the foundation for later material. We construct a hierarchical structure for an introductory statistics course using Rasch analysis of the student scripts for the final examination. This forms the basis of a statistical literacy construct that has wider implications than just an undergraduate course. The world is overwhelmed with data from an exponentially increasing number of sources. Such data is of various types and contexts, ranging from social, commercial, scientific, survey and human. Statistical literacy has therefore assumed a larger and more important role.
1. Introduction
Statistical literacy is an important and emerging concept. It comprises Literacy skills and Statistical Knowledge Base (Gal, Citation2002b). These two components should not be viewed separately, and a combination of the two enables statistically literate behaviour. Interpretation of information from statistical analyses requires a high level of literacy skills, contextual knowledge and firm understanding of the statistical techniques and modelling assumptions. In particular, critical evaluation of the validity of conclusions of statistical analyses is based on verifying model assumptions. These elements should not stand on their own, but instead work together to form a complete and in-depth understanding of statistics (Gal, Citation2002b).
In this study we develop a statistical literacy framework for tertiary levels statistics education. We achieve this by analysing student examination scripts from a first-year business statistics unit. Student performance for parts of each question are analysed using the Rasch model (Rasch, Citation1960). This model was developed to analyse item responses in surveys and is particularly suitable for analysing student examination responses. Through this analysis we identify concepts and factors that hinder statistical understanding and construct a hierarchical framework for statistical literacy for introductory statistics courses at the tertiary level.
Introductory courses in any discipline cover fundamental and key concepts that form the basics of the discipline. This is also true of statistics. However, introductory statistic units by necessity also comprise a variety of statistical methodology and computations that can simply be learnt and mimicked. Some mathematical background is required for such units, but is often lacking or insufficient. Consequently complex ideas are deliberately oversimplified into a series of procedures that allow students to think and respond in a unistructuralist manner.
This has two consequences. Firstly, since assessments must include these methodologies, a student may perform well without understanding the fundamental concepts. So while students may grasp statistical procedures, they do not necessarily understand the subtleties involved. In particular, model assumptions are often not well understood nor appreciated. Secondly, if these methodologies are simply learnt then they are also easily forgotten. Since these students will perhaps not take any further statistics units, their knowledge of statistics is insufficient. Consequently, when presented with an unfamiliar context they struggle to apply the appropriate techniques or to determine why a certain method is incorrect. More commonly, an incorrect technique is applied, leading to incorrect conclusions.
Statistical literacy is a challenging concept (Ben-Zevi & Garfield, Citation2004). Identifying a hierarchical structure of statistical literacy will be highly beneficial in the teaching and learning of statistics. Sharma (Citation2017) gives a good survey of the literature on statistical literacy. In the area of statistics education in general, a few aspects are commonly mentioned that encapsulate criteria for statistical literacy. Increasing structural complexity and increasing statistical appropriateness are two aspects of comprehension (Watson & Callingham, Citation2003). Various hierarchical frameworks have been proposed to illustrate these two aspects. For example, Biggs and Collins (Citation2014) proposed a four level construct with increasing sophistication of basic application of statistics.
Of particular relevance to our work is the study by Watson and Callingham (Citation2003), who used the Rasch model to explore the underlying construct associated with statistical literacy from the responses of 3000 school students in year 3 to 9 (primary and lower high school) to an 80 item questionnaire. The authors concluded that statistical literacy was unidimensional with six levels as below.
Idiosyncratic: personal beliefs and experience based.
Informal: based on pattern recognition.
Inconsistent: explanation of chance is based on qualitative and not quantitative reasoning.
Consistent non-critical: some reasoning to explain variation.
Critical: similar to last level, but with higher level of mathematical skill to engage in mathematical reasoning.
Critical mathematical: quantitative reasoning to explain chance and variation.
We apply the Rasch model to a university first-year level statistics unit, so the resulting statistical literacy construct is expected to be different to that obtained by Watson and Callingham (Citation2003).
This paper is organised as follows. In Section 2 we give a brief overview of statistical literacy. In Section 3 we provide a brief description of the Rasch model. In Section 4 we describe the methodology, followed by the results of the Rasch model fit in Section 5. The construction of the statistical literacy hierarchy is presented in Section 6, followed by discussion and conclusion in Section 7.
2. The hierarchy of statistical literacy
A fundamental concept taught in foundation statistics courses is hypothesis testing. This is then applied in different statistical procedures, but the fundamentals steps taken to complete the hypothesis test are common and are outlined below.
Understand the context of the data and the statistical problem.
State the appropriate Null and alternative Hypotheses.
Calculate the test statistic.
Calculate the p-value.
Inference based on the p-value.
Interpret the result in the context of the data and the problem.
Discuss possible errors.
Verify model assumptions.
All these components are vital to fundamental understanding of statistics and its application. The steps themselves form a hierarchy. The idea that statistical literacy can be broken into components allows for the possibility that there exists a hierarchical framework which, in turn, explains how students learn and understand statistics. Such a framework for statistical literacy will not only reveal and confirm the hierarchy in statistical literacy, but also inform and guide the teaching and learning of statistics.
3. The Rasch model
A group of approaches which has increased in popularity over the past decade is the Rasch model (Rasch, Citation1960). This method belongs to a larger family known as Item Response Theory (IRT) which focuses on evaluating the probability of interaction between respondents and items. Most commonly and perhaps most effectively, Rasch modelling is applied to surveys and tests. From the Rasch model, a scale measurement for respondents and items can be constructed and expressed on a common continuum. This results in ranking- scales of item difficulty and respondent ability. Items can thus be classified as easy or difficult, depending on whether they fall within the ability of a majority of students, only a few, or none.
George Rasch modelled the probability of a dichotomously scored response as a function of the difference between student ability and item difficulty parameters (Rasch, Citation1960). Specifically, the logistic function was used to model the probability of a correct response. As such the Rasch model is a special case of the generalised linear model in statistics (Fox, Citation2015). The model quantifies item difficulty and the respondent ability, where these parameters are evaluated to determine their magnitude relative to each other and represented on the same logistic scale. Because these parameters are on the same continuum, comparison between items and respondents is facilitated. This approach allows for the use of student raw scores to produce an estimation of ability that can be expressed on a linear scale. The model accounts for unequal difficulty across test questions. Other covariates, such as demographic variables, can also be included in the model.
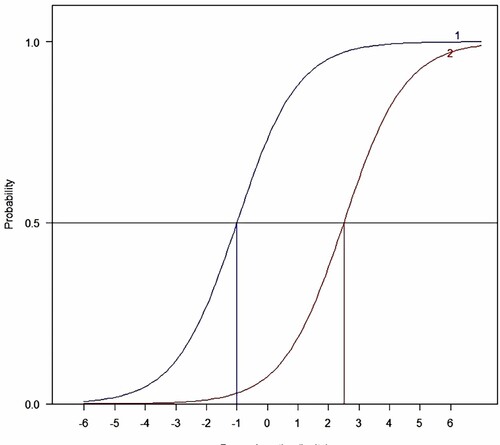
The fit of the Rasch model can be assessed visually by the Item Characteristic Curve (ICC). The x-axis represent item difficulty in a logit scale and the y-axis represents the expected score of the item. The ICC is a sigmoidal curve (see Figure ). Easier items will lie to the left of 0 and more difficult items lie to the right. The item's estimated difficulty is the value on the x-axis that corresponds to an expected score of 0.5. In Figure , item 2 has a higher difficulty score (2.5) than item 1 () and so is more difficult.
Figure 1. Item characteristic curve.
A key assumption of the Rasch model is the unidimensionality of the construct. In practical terms this means that the non-random variation in the data can be attributed to a single dimension of difficulty and ability.
More details of the Rasch model and model fitting can be found in (Andrich, Citation1988; Bond et al., Citation2021).
The Rasch techniques has previously been used for improving teaching and learning of mathematics and statistics. Craig and Cloete (Citation2015) evaluated the proficiency with the vector scalar product of students from an engineering course by a Rasch analysis of the examination scripts across two semesters. They found that problems which required the use of scalar products embedded within a context were of the highest difficulty. Abd. Razak et al. (Citation2012) used the Rasch model as a tool for assessing the quality of a mathematics test, and questions that did not fit well to the model were excluded in the construction of future assessments.
4. Methodology
4.1. Cohort
This study is based on a first level statistics unit for business students at The University XXXX. The broad unit content is given in Table . A total of 452 students were enrolled in this unit. The pre-requisites for the unit were basic algebraic manipulation, including linear, quadratic, exponential and logarithm functions. These pre-requisites are acquired either through equivalent year 12 (final year) high school units or bridging units at the university. The majority of students in this cohort are Australian citizens. Some international students also complete their high school education in State XXXX. For these two groups of students information on their past academic background was obtained from the university records. Data included the highest level of mathematics completed, their performance in it, and their Tertiary Entrance Rank (TER) which is based on their performance in internal and external assessments in the final year of schooling in State XXXX. The TER is used for entrance to the tertiary institutions in Australia. The University XXXX has a cut-off TER of 80 (or equivalent), which corresponds to the top 20% students in the state.
Table 1. Content of the Business Statistics unit.
4.2. The examination
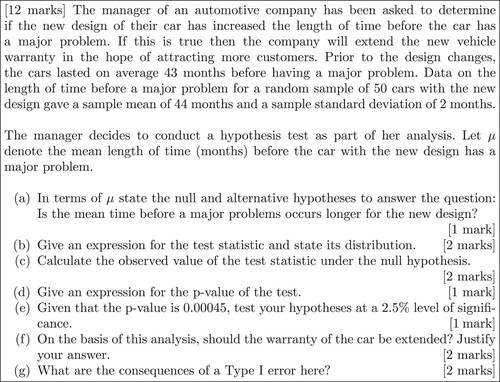
The final examination comprised 7 questions, each designed to assess a fundamental statistical modelling technique. However, the last question was more open-ended, and was omitted after consideration as it was not suitable for the Rasch Model. Each question began with a business context and description of the relevant data. A business decision or recommendation had to be made based on statistical analysis. Items within each question tested key aspects and competence was assessed by a score based on a marking key. An example of a typical question (on a one-sample t-test for population mean) is given in Figure .
Figure 2. A question from the examination.
The raw response to each question was analysed using the Rasch modelling programme RUMM2030 (RUMM2030, Citation2009). Post-estimation, both quantitative and graphical summaries of the student and item parameters can be produced.
5. Results
5.1. Fit statistics
5.1.1. Initial fit
The Person Separation Index (PSI) indicates the ability of the items to separate student performance. As such this indicates if the examination is able to separate the class into different grades. The PSI that resulted from the raw data was 0.93068, which confirms that variation amongst students is large and adequately spread across the continuum. The item fit residuals had a mean of and a standard deviation of 2.1953, while the students fit residuals had mean
and standard deviation 1.0489.
The Rasch model requires contiguous scoring of item. Consequently, of the 39 items, 26 required some adjustment of the scoring structure. Specifically, if students did not score in a category then this category was collapsed and combined with an adjacent scoring category. A summary of the new scoring structure for each item in presented in Table .
Table 2. Rescored items and new scoring structure.
For the adjusted scores, the PSI was 0.91021 indicating that variation amongst students is still large and adequately spread across the continuum. Although slightly reduced, this PSI is acceptable and the reproducibility of relative item and ability parameters can be made with confidence.
The mean and standard deviation of the item fit residuals is and 1.3462 respectively. The mean and standard deviations, across all students and all items, should be close to 0 and 1 respectively; this indicates that overall student performance is commensurate with item difficulty (Andrich, Citation1988). The adjusted scores seem to fit better as the standard deviation of the item fit residual has reduced from 2.1953 to 1.3462.
The mean and standard deviation of the fit residuals for student ability was and 0.9152 respectively. Further investigation revealed that ten students exceeded the absolute fit residual of 2.5. These student performed unexpectedly according to the Rasch model, indicating that, compared with the rest of the cohort, these students found some items too easy or too difficult (Forkmann et al., Citation2013).
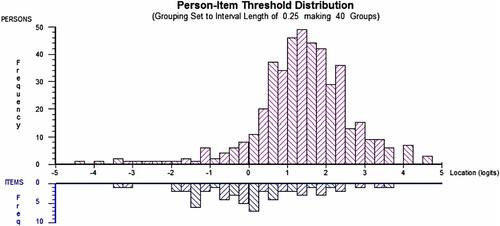
Figure shows the person-item estimates on a logit scale. The plot indicates this examination paper targets all student ability levels. Consequently the examination provides interpretable information regarding the scale of student performance and item difficulty. The majority of student and item estimates are between and 4. The width of student and item estimates are similar, disregarding the extreme student at
logits. The mean (and mode) ability is at 1.348 logits above the mean of the item estimates, which suggests that as a cohort students found this examination fairly easy. However, very few students scored above 4, indicating there were some difficult elements in the examination. The standard deviations for student and item locations are 1.3362 and 1.4438 respectively, indicating a wider spread for item estimates than student estimates.
Figure 3. Person and item estimates distributions.
Each of the six questions examined a particular statistical procedure. In the following, items are subset by question number and topic, and are ordered in ascending order of difficulty estimate. This allows comparison of common concepts examined across the different procedures. We have grouped and highlighted with a common colour related concepts with similar difficulty estimates.
There is an obvious hierarchical structure within each question. While differences in overall difficulty between the different questions are apparent, there exist common concepts that students find consistently more difficult than others.
A principal components analysis of the residual correlation matrix from the Rasch model showed a similar proportion of variation corresponding to each component. Based on this analysis, a unidimensional construct for this examination is confirmed (Linacre, Citation1998). Through this construct, interpretable information can be inferred confidently regarding the hierarchical nature of concepts that would otherwise be hidden in the item scores. A hierarchical framework can be constructed by locating the changes in difficulty estimates, specifically those which correspond to common cognitive demands, as indicated by the colour scheme in Tables –. Displayed in each table is the item (as labelled in Table ) and the corresponding category, and statistical concept and estimated difficulty (logit), in increasing order (from the simple to the more difficult).
Table 3. Concepts and corresponding estimated difficulty for subset 1.
Table 4. Concepts and corresponding estimated difficulty for subset 2.
Table 5. Concepts and corresponding estimated difficulty for subset 3.
Table 6. Concepts and corresponding estimated difficulty for subset 4.
Table 7. Concepts and corresponding estimated difficulty for subset 5.
Table 8. Concepts and corresponding estimated difficulty for subset 6.
In each subset, the bands are determined by identifying clear separation in the difficulty scores of the items. For example, Subset 1 contains one item with a large negative socre. This is in the easiest band. The band contains only negative score, while the last bad are small positive scores. Similarly for the other subsets. Note that in some subests an item could be allocated to an adjacent band, and the choice is based on the similarity of the item to other items in its allocated band. However, reallocating items at the edge of bands does not affect the hierarchical structure that is obtained. Note also that the allocation of items to bands is based entirely on the difficulty scores obtained from the Rasch analysis of the student examination scripts, and the examination inherently reflects the unit curriculum.
The concepts that students find difficult and that hinder under statistical understanding can be identified from these tables. Subsets 1 (one-sample test for population mean), 3 (one-sample test for population proportion) and 4 (two independent samples t-test) contains the easiest questions. In subset 2 the difficult parts were on stating and verifying model assumptions, and identifying Type I and Type II errors. Subset 5 (ANOVA) had several difficult parts. In both subsets 5 (ANOVA) and 6 (multiple linear regression) the difficult parts involved the more subtle aspects of statistical inference. In particular, model validation for both ANOVA and multiple linear regression were poorly done. Further, in ANOVA students had difficulty interpreting the results of the analysis. Similarly, in multiple linear regression, students had difficulty in computing predictions based on the problem context and the model.
6. Construction of the hierarchy
In the previous section we identifies six subsets of items that summarise the entire content of the first-year statistics unit. These six can be grouped into three concepts, based on common sub-items. The first concept is based on the first two subsets, both of which involve single sample hypothesis tests. Subsets 3 and 4 both involve two-sample hypothesis tests for a difference of population means, and form the second concept. Finally subsets 5 and 6 deal with ANOVA and linear regression, which are equivalent, since ANOVA can be expressed as a regression model. These form the third concept.
Figure illustrates the corresponding hierarchical framework for statistical literacy and learning based on the three concepts. The three levels of the hierarchy are described below.
Figure 4. Proposed Hierarchy for Statistical Literacy.
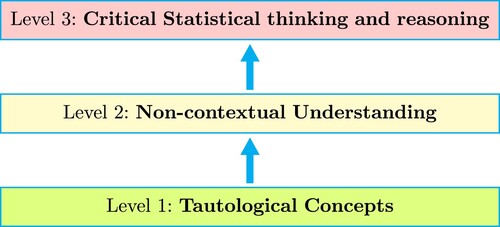
Level 1 – Tautological Concepts Items at this level require students to state null and alternate hypothess using mathematical notation given the same in words, compare a given p-value against a significance level and make simple inferences. These items are assessed repeatedly in this examination in the context of different models. The concepts at this level do not require any contextual understanding, and it is therefore possible for students to respond correctly in an algorithmic manner without understanding the applications of these concepts. Correct responses to these items therefore do not necessarily correspond to competence in statistical understanding. A tautology is defined as the restatement or repetition of the same using different words with no difference in clarity. In this sense the nature of these items are quintessential of a tautology.
Level 2 – Non-contextual Understanding This level represents technical skills. Quantitative aspects of fundamental statistics are the focus of this level, requiring details of statistical techniques. Concepts at this level require understanding of aspects in relation to the calculation of p-values, confidence intervals and discussing model assumptions. However, justifications of specific statistical contexts are absent at this level. Concepts at this level are present in different statistical techniques, and therefore have varying degrees of tautological characteristics. However, it is apparent that these quantitative concepts are more specific to the particular statistical procedure and the context of the question, and therefore require a higher cognitive understanding. Students who score correctly on these items exhibit some competence. Nonetheless these items simply require the elementary use of formulae, and students are only required to identify appropriate formulae followed by substitution of the appropriate numerical values. The model assumptions can also be simply learnt.
Level 3 – Critical Statistical thinking and reasoning Items and concepts in this level are an extension of those in level 2. However, they are generally structured in an irregular manner where predetermined responses will not suffice. For correct responses in this level, in-depth conceptual understanding of statistical concepts is required. The questions in this level are dependent on both the contextual information and an appropriate use or explanation of statistical methodology in the particular context. As such, students who answer correctly to these items will exhibit a high order of statistical thinking and reasoning. This level places a higher cognitive demand on students relative to lower levels. Items at this level involve validation of model assumptions, justifying conclusions made through the use of appropriate statistical reasoning, understanding the mathematical construction of the statistical procedures, and effects of changing the values of model variables. In addition, effects of Type I and Type II errors in the specific context requires clear understanding of these concepts. Mathematical competency compliments inferential statistics at this level of statistical literacy. As such, these concepts are the closest representations of the underlying purpose of statistics as a discipline. That is, gathering and assessing quantitative information, but most importantly communicating and validating inferences.
7. Discussion and conclusion
We have proposed a hierarchical construct for statistical literacy based on the Rasch analysis of examination scripts for a first-year Business Statistics unit. Besides the business context, the material for this unit is common to most first-level statistics units. As such this construct is relevant for any first-level statistics unit. The three levels of statistical literacy coincide with levels of (modified) Bloom's Taxonomy (Bloom, Citation1965). In particular Level 1 corresponds to Knowledge. This level simply tests recall of practiced concepts. Level 2 corresponds to Comprehension and Analysis. Here application of knowledge and techniques in specific contexts is tested, and simple recall is not sufficient. Finally, Level 3 corresponds to Analysis, Synthesis and Evaluation. At this level in-depth understanding of more advanced concepts is required, along with application in specific contexts. Interpretation of results, the nuances of data collection, and evaluation of and effect of model assumptions are required; these are the most difficult aspects, as judged from the Rasch scores for these items (see Tables and ).
Tacit in the construct at Level 3 in particular is that the results and interpretation of statistical analysis need to be written clearly, concisely and unambiguously in terms of the specific context and application. As such, writing skills are a part of statistical literacy.
Our construct differs from that of Watson and Callingham (Citation2003). Their construct contains six levels, compared with three in ours. The six levels could in principle be collasped pairwise into three, since the pairs reflect similar levels of sophistication. The last two levels in Watson and Callingham (Citation2003) do correspond to the highest level in our construct. Nonetheless, the differences are not unexpected, since Watson and Callingham (Citation2003) developed a construct for the school statistics curriculum, while ours is for a first-year university statistics curriculum.
Professional statisticians would agree that the most important aspect of statistical literacy are the items in Level 3 of the construct (Gal, Citation2002a). The construct indicates that the area that students find most difficult is also the area that are most important for statistical literacy. However, most statistics units focus on technique, and do not find time or space for these Level 3 concepts. Students are thus not adequately prepared for the demands of higher scientific research. Khan (Citation2016) provides several examples of incorrect statistical procedures in PhD theses in Science and Medicine from universities in Australia and New Zealand. These include fitting linear regression models in situations where the models are not linear, or when the response variable is a count.
The statistical construct developed in this paper is intended to guide and inform statistics curricula and the teaching of statistics, and encourage focusing on the most important aspects of statistical literacy at Level 3 of the construct. As such, the construct will contribute to improved statistical literacy for all who need statistics and data analytics.
Disclosure statement
No potential conflict of interest was reported by the authors.
References
- Abd. Razak, N., Khairani, A. Z., & Thien, L. M. (2012). Examining quality of mathemtics test items using Rasch model: Preminarily analysis. Procedia-Social and Behavioral Sciences, 69, 2205–2214. https://doi.org/10.1016/j.sbspro.2012.12.187
- Andrich, D. (1988). Rasch models for measurement. Sage.
- Ben-Zevi, Danni, & Garfield, Joan B. (2004). Statistical literacy, reasoning, and thinking: Goals, definitions, and challenges. (3–15). Springer.
- Biggs, John B., & Collins, Kevin F. (2014). Evaluating the quality of learning: The SOLO taxonomy (structure of the observed learning outcome). Elsevier Science.
- Bloom, B. S. (1965). Taxonomy of educational objectives. Longman.
- Bond, T. G., Yan, Z., & Henne, M. (2021). Applying the Rasch model: Fundamental measurement in the human sciences. Routledge.
- Craig, Tracy S., & Cloete, Trevor J. (2015). Simple rule, hidden meaning: The scalar product in engineering mathematics. In Proceedings of the Tenth Southern Hemisphere Conference on the Teaching and Learning of Undergraduate Mathematics and Statistics (Elephant Delta), Port Elizabeth, (pp. 18–42).
- Forkmann, T., Gauggel, S., Spangenberg, L., Brähler, E., & Glaesmer, H. (2013). Dimensional assessment of depressive severity in the elderly general population: Psychometric evaluation of the phq-9 using Rasch analysis. Journal of Affective Disorders, 148(2–3), 323–330. https://doi.org/10.1016/j.jad.2012.12.019
- Fox, J. (2015). Applied regression analysis and generalised linear models. (3rd ed.). Sage.
- Gal, I. (2002a). Statistical literacy: Conceptual and instructional issues. Perspectives on adults learning mathematics: Research and practice (pp. 135–150).
- Gal, I. (2002b). Adults' statistical literacy: Meanings, components, responsibilities. International Statistical Review, 70(1), 1–25. https://doi.org/10.1111/insr.2002.70.issue-1
- Khan, R. N. (2016). Who needs statistics? In Proceedings of the Ninth Australian Conference on Teaching Statistics (pp. 105–110). Canberra, Australia.
- Linacre, J. M. (1998). Detecting multidimensionality: Which residual data-type works best?. Journal of Outcome Measurement, 2, 266–283.
- Rasch, G. (1960). Studies in mathematical psychology: I. Probabilistic models for some intelligence and attainment tests. Nielsen and Lydiche.
- RUMM2030 (2009). Interpreting RUMM2030 – Part I: Dichotomous items.
- Sharma, S. (2017). Definitions and models of statistical literacy: A literature review. Open Review of Educational Research, 4(1), 118–133. https://doi.org/10.1080/23265507.2017.1354313
- Watson, J., & Callingham, R. (2003). Statistical literacy: A complex hierarchical construct. Statistics Education Research Journal, 2(2), 3–46. https://doi.org/10.52041/serj.v2i2