
 ?Mathematical formulae have been encoded as MathML and are displayed in this HTML version using MathJax in order to improve their display. Uncheck the box to turn MathJax off. This feature requires Javascript. Click on a formula to zoom.
Abstract
The need for more energy storage in the transition to a renewable energy system leads to increasing interest in upgrading existing hydropower plants to pumped storage plants. Such upgrades result in stronger hydraulic transients in the tunnel system, including increased mass oscillation amplitudes. In this study, a generalized tunnel system with multiple brook intakes/surge tanks is analysed to assess the influence of the brook intakes on the mass oscillation stability. The variables that are assessed are the number of brook intakes, cross section area, the amount of inflow, and throttling of the brook intakes/surge tanks. The study is carried out using frequency-response analysis, where the excitation is the oscillation of the guide vane position, and the response is the product of the measured head and discharge (equivalent to the hydraulic power). The results show that brook intakes are generally beneficial for the stability of the mass oscillations. Existing hydropower plants with brook intakes may have sufficient stability margins to allow upgrade and reconstruction without the need for upgrading of the surge tank with regard to mass oscillation stability.
1 Introduction
The worlds energy systems are in transition towards more renewable energy sources. As a result, the demand for energy storage and balancing power is increasing. Furthermore, hydropower is a mature technology and many old hydropower plants (HPPs) are due for major refurbishment. These trends result in increasing interest in upgrading the installed capacity and/or reconstruction to pumped storage plants (PSPs). Such upgrades result in more start-stop operations, more frequent and adverse hydraulic transients, and reduced stability margins, which may require mitigating measures.
The topic of this paper is mass oscillation stability in hydropower plants with brook intakes (BIs), also referred to as secondary intakes (). BIs have the role of collecting water from brooks and transporting it to the main tunnel through an intake and a shaft. From a hydraulic point of view, BIs also function as surge tanks with inflow, usually unregulated inflow. If the BI can be placed in a beneficial location, it can be used as the primary surge tank in the system. The design of the brook intake in these cases needs to account for the inflow, to ensure the mass oscillation stability during operation at different inflow levels.
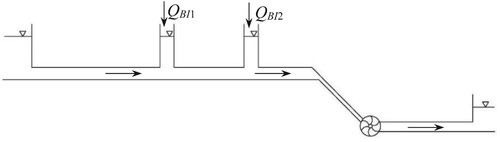
Figure 1 Schematic presentation of the model
For surge tanks and hydraulic transients in hydropower plants, four different aspects are studied separately: (i) mass oscillation amplitude, (ii) mass oscillation stability, (iii) water hammer amplitude and (iv) governor stability. The current study deals with the mass oscillation stability.
The problem of mass oscillation stability was introduced by Thoma (Citation1910) who described the physical process and derived an analytic equation for the minimum size of the surge tank, generally known as Thoma cross section (Ath). Owing to many simplifications and assumptions in the Thoma equation, Jaeger (Citation1960) proposed a safety factor of 1.5 to 1.8. Other mass oscillation stability analysis methods include physical modelling (Svee, Citation1970) and frequency domain analysis through Laplace transform of governing equations (Report, Citation1973; Supply, Citation1992). However, the modern approach is to analyse the stability problems with simulations in the time domain, where the simulation results can be analysed in the frequency domain. The latter approach is used in Nicolet (Citation2007) Svingen et al. (Citation2011), Walseth et al. (Citation2011) and Vereide et al. (Citation2017).
Scientific work has been done to quantify the effect of various variables on the mass oscillation stability. In his original work, Thoma (Citation1910) demonstrated that while an increasing size of the surge tank and a higher head loss have a positive effect on the stability, a longer main tunnel has a negative effect. Jaeger (Citation1960) and Escande (Citation1963) concluded that including a surge tank throttle has a positive effect on the stability. The stability of different types of upstream surge tank design has been presented by Calame and Gaden (Citation1926), Escande (Citation1952), Svee (Citation1972), Yang and Kung (Citation1992) and Yang et al. (Citation1992).
The scope of the present work is to systematically assess the effect of (i) multiple BIs, (ii) the BI cross section, (iii) BI inflow, and (iv) BI throttles on the stability of mass oscillations. The motivation of the work is to improve the design of new hydropower plants with BIs, and to assess the potential to utilize the stabilizing effect of BIs for upgrading of existing hydropower plants.
The analyses are conducted using the frequency-response method in one-dimensional (1D) numerical simulations. The numerical model is built based on the 50 MW Roskrepp HPP in Southern Norway. The selected input variables are based on realistic values from this case-study hydropower plant. The numerical model is generalized with only simple vertical shafts included as BIs and is validated against a 1:70 geometrically identical hydraulic scale model.
2 Methods and materials
The frequency-response method with simulations in the time-domain has been utilized in this work. This method enables the use of existing software with nonlinear time domain models as shown in Nicolet (Citation2007), Svingen et al. (Citation2011), Walseth et al. (Citation2011) and Vereide et al. (Citation2017).
2.1 Geometrical description of the model
The model is built based on a real hydropower plant, with some modifications of the surge tank and brook intake to make it more general. The schematic of the model is shown in , with the headrace and tailrace tunnel average cross section of 38 m2 and a penstock diameter of 4 m. Note that the term surge tank is consistently replaced in this paper with brook intake BI2 since BI2 can also have inflow. The modification compared with the real power plant is that all the brook intakes are considered as simple vertical shafts, with cross section of 17, 35 or 52 m2, equivalent to 0.5, 1.0 or 1.5 times the reference Ath, respectively. In this work, the reference Ath is defined as:
(1)
(1)
where Q is the discharge, L is the tunnel length between reservoir and surge tank, A is the tunnel cross section, hf is the friction head loss, and Hnet is the net head. For determining the reference Ath used throughout the paper, the simplest case of one BI with no inflow is used as shown in the first configuration in .
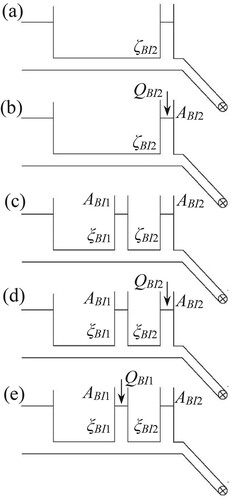
Figure 2 Tunnel configurations tested in the study and associated variables. (a) One BI acting as a surge tank with no inflow. (b) One BI acting as a surge tank with inflow. (c) Two BIs acting with no inflow. (d) Two BIs with inflow in BI2. (e) Two BIs with inflow in BI1
The gross head (92 m), the turbine BEP discharge (60 m3 s−1), the maximum inflow in the brook intake (10 m3 s−1), and the Darcy–Weisbach friction factors f (0.05 for the unlined tunnels and 0.03 for the steel lined penstock) are chosen based on real values determined in previous work from the studied power plant (Pitorac et al., Citation2022). The head loss in the tunnel hf is calculated as:
(2)
(2)
where L is the length of the tunnel, D is the tunnel diameter, v is the velocity of the water in the tunnel and g is the gravitational acceleration. Cumulated losses coefficients on each tunnel stretch are calculated as
where ξ is 9.4 from reservoir to BI1, 5.8 from BI1 to BI2, and 1.4 from BI2 to turbine. These values are determined by calibrating against field measurements presented in detail in Pitorac et al. (Citation2022). The singular loss due to BI throttling is alternated between Cv = 240, 360 and 720 m5 s−2, depending on the studied case. The physical dimensions of the throttles are not defined, only the singular loss factor. The head loss due to throttle hs is determined as:
(3)
(3)
where QBI is the discharge through the throttle.
2.2 1D Numerical modelling
The numerical model is built in LVTrans, version 2018-02.11.14, a freeware developed in LabVIEW (Svingen, Citation2005). The model consists of different modules for reservoirs, tunnels, surge tanks/brook intakes, turbine and PID governor. The grid can be modelled as a stiff interconnected grid, or as an island grid. The frequency-response tests are run with a module implemented in the PID governor of LVTrans. The timestep dt used in the simulations is 0.1 s, with the space resolution in LVTrans being automatically determined from the Method of Characteristics (MOC) where dx = c dt and c is the speed of sound and dt is adjusted as specified by Wylie and Streeter (Citation1993). The surge tank and brook intake modules account for inertia, singular loss factors, and friction factor, with the BI module including variable inflow in addition.
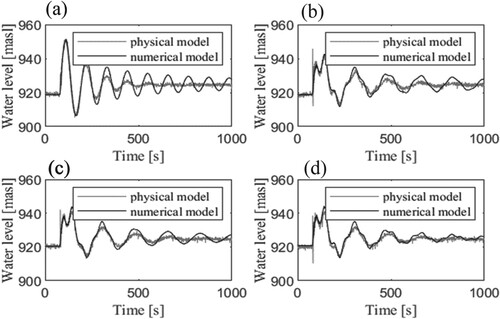
The numerical model is validated using a hydraulic scale model with the same geometry and boundary conditions. The validation case is an emergency shutdown from full load, with two different BI2 inflows, 0 and 10 m3 s−1. The results from the validation are presented in the results chapter.
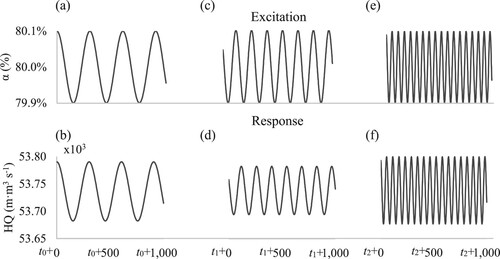
The frequency-response method is used to analyse the system stability. In the frequency-response method, an excitation of a certain frequency and amplitude produces a response with the same frequency, but with a phase-shift, and a different amplitude. In this paper, the excitation is the oscillation of the guide vane position. The guide vanes are moved according to a pre-defined time-series, without any power or frequency feedback. The response is the hydraulic power expressed as hq, acting on the turbine. All variables are made non-dimensional.
The frequency-response analysis is implemented as follows. The guide vane opening is oscillated around 80% or 110% of opening, with an amplitude of 0.001 (small amplitudes) and at different frequencies, representing the system excitation. One sample is taken for each frequency, and 200 samples are recorded in the range between 0.001–0.1 Hz. For each sample, several periods are run to stabilize the system at the excitation frequency before several periods are run to collect the sample. presents an example of the excitation and the response for three different excitation frequencies. For all simulations, the same excitation parameters are maintained, independent of the BI inflow.
Figure 3 Oscillations for excitation α and response HQ. (a) Low frequency excitation. (b) Low frequency response. (c) Medium frequency excitation. (d) Medium frequency response. (e) High frequency excitation. (f) High frequency response
Different response variables can be analysed, n/nref, n/p, and hq/y, where n is the rotational speed, nref is the reference rotational speed, p is the power, h is the head, y is the guide vane position, and q is the discharge, all non-dimensional.
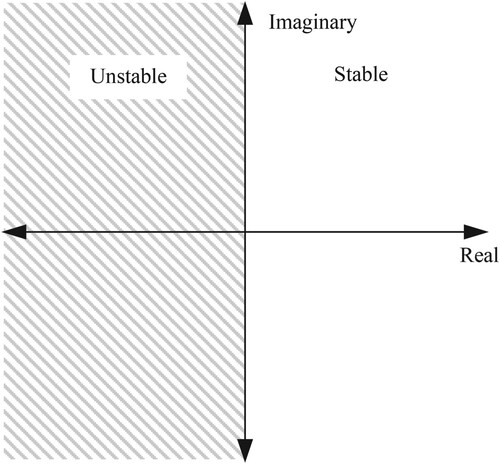
The main benefit of hq/y is that the results are not influenced by the PID governor but can be used to indirectly quantify the stability only of the hydraulic system. The result from these analyses will be the gain and phase of the non-dimensional head (h) and hydraulic power (hq) based on the guide vane oscillation. hq/y can be used to indirectly determine the limit stability of a surge tank when compared with the traditional Thoma. When the curve of hq/y crosses over to negative RE values, this corresponds to an unstable Thoma surge shaft area, as shown in , where IM and RE are the imaginary and real parts of the complex number resulted from Eq. (2). In Eq. (2), ,
and
are continuous functions of f(jω) and h, q and y are nondimensional values:
(4)
(4)
Figure 4 Real-imaginary plane for hq/y
2.3 Tested power plant configurations
The tested configurations are presented in , where a total of 45 tests are carried out by varying the number, cross section ABI, inflow QBI, and throttling ζ of the BIs. Each configuration is tested with two different steady state guide vane openings, 80% and 110% guide vane opening, where 100% opening corresponds to best point efficiency (BEP). For all configurations, two turbine discharges are verified: the current design discharge as well as an increased turbine discharge, equivalent to a hydropower plant upgrade.
3 Results
3.1 Calibration and validation of numerical model
The numerical model is calibrated against the presented hydraulic scale model for emergency shutdown case from full load, with the results seen in . In the calibration, the BI cross section is 34 m2 (Ath), with different BI inflow. The results from comparison of the physical model and numerical simulations show a good match and it is concluded that the calibration and validation of the numerical model is sufficient for the purpose of this work. As shown in the results, the most important first amplitude is the same both for physical model and for numerical model, but the damping differs. This difference is assumed to come from the different transient friction and transient singular losses in model and prototype, which are challenging and perhaps impossible to capture accurately without detailed on-site measurements of each significant head loss, as previously discussed also by Brekke (Citation1984) and by Zhou et al. (Citation2020). In terms of error sources, the 1D numerical model uses approximate methods to account for 3D effects such as singular losses, transient losses, and the effects are limited owing to small amplitude analyses. For a length to diameter ratio larger than 10, it is concluded that 1D models provides an accurate representation of the hydraulic system behaviour (Wylie, Citation1996), thus appropriate for use in this work.
Figure 5 Calibration for emergency shutdown case from full load. (a) Only one brook intake with no inflow. (b) Two BIs, with no inflow. (c) Two BIs with average inflow in BI1. (d) Two BIs with maximum inflow in BI1
3.2 Frequency-response tests
Five different comparisons are carried out, with the results presented in Figs –. For clarification, when reading a line from the graphs in Figs , consider both the line style from the legend and the line colour from figure title, in order to assess which case the respective results corresponds to. For method validation purpose, the influence of the surge tank cross section area is shown in . The value of the cross section is expressed as a multiple of the reference Ath to have an easier understanding of how the size of each case compares. As can be seen the 1Ath is already unstable, highlighting the uncertainties in the theoretical Thoma-area and the need for a safety factor.
Figure 6 Influence of the surge tank size expressed in Ath on the mass oscillation stability in a tunnel system with one brook intake
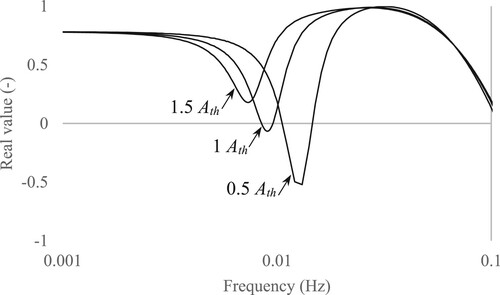
Figure 7 Influence of the throttle size and brook intake inflow for one brook intake configuration at 1Ath
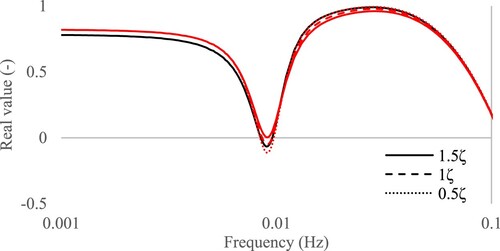
Figure 8 Influence of the throttle size and brook intake inflow for two-brook-intake configuration. (a) Full range. (b) Surge tank frequency
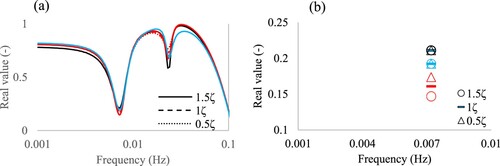
Figure 9 Influence of the throttle size and number of brook intakes on the mass oscillation stability (red: single surge tank, blue: two surge tanks)
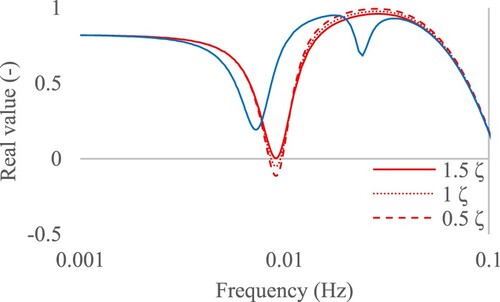
Figure 10 Influence of increased turbine discharge for one brook intake configuration
In the first test set there is a single BI acting as surge tank, with and without inflow. The real value (RE) results against the frequency for the 1Ath are shown in . RE is around 0, depending on the throttle size, which means that the stability is at the limit. For 0 m3 s−1 inflow in the surge tank, the throttle has no influence as the oscillation amplitude is small. For surge tank with inflow, it can be observed that reduced throttle head loss results in a more stable surge tank.
In the second test set, the system configuration has two BIs. The results presented in show that the throttle has no influence when there is no inflow in any of the brook intakes and when there is inflow in BI2 (red and blue marks in the figure). When there is inflow in BI1, the surge tank becomes less stable with the increase in the throttle loss (black marks in the figure). Overall, the surge tank changes from more to less stable in the following order: no inflow, inflow in BI2, inflow in BI1.
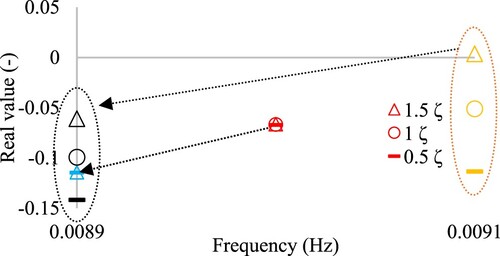
The configuration studied in the third test set is the tunnel system with two BIs with Q = 10 m3 s−1, whereof one is the main surge tank of the system. A shift in response frequencies between single BI case and two BIs case can be observed from . When a second brook intake is included in the system, the amplitude corresponding to the frequency of the main BI is reduced. This is counter intuitive, as the distance between the main BI and the closest water surface is reduced, but one possible explanation is that the two BIs have a joint influence rather than separate on the stability, which results in a reduced mass oscillations frequency in the BI acting as the main surge tank. When a second BI is included in the system, the 1Ath becomes stable (above 0 on RE axis). The results from the three presented configurations are presented in .
Table 1 Summary of eigenfrequency Fr and real value RE for all configurations, guide vane oscillation around 80% opening
The fourth test set configuration has a single BI with increased turbine flow, representing an upgrade of the existing hydropower plant, and is show in . The BI eigenfrequency slightly changes, from 9 to 8.9 Hz, for the turbine discharge increase in the case of no inflow in BI2, and from 9.1 to 8.9 Hz, for the turbine discharge increase in case of 10 m3 s−1 inflow in BI2. There is still no influence of the throttle for the no inflow case, as shown in the figures from test set 1, but the increased turbine discharge generally results in a less stable system (the RE value decreases from the regular discharge (red and magenta) to the increased discharge (blue and cyan).
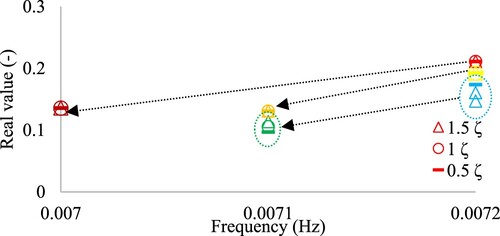
In the fifth and last test set, a configuration with multiple brook intakes in addition to the increased turbine flow of 110% of BEP representing an upgrade of the existing power plant is studied. The results are presented in and similar results as the observations in Figs and can be seen also in this case. The red, yellow and cyan marks are the same as the ones presented in . As observed, the surge tank frequency decreases in these cases also, from 7.2 to 7.1 and 7 Hz, respectively, similar to the results from the fourth test set. The increase in the turbine flow does not change the influence of the throttle, but only the frequency and the stability, i.e., the stability of the system decreases with the increase of the turbine discharge.
Figure 11 Influence of increased turbine discharge for two brook intakes configuration
4 Discussion
As expected, systems with two BIs are in sum significantly more stable than system with only one BI. Larger water table cross section of the BIs results in a more stable system independently if it is for one or several BIs. Increased turbine discharge is seen to make the system generally more unstable. This is in accordance with previous literature on the topic (Thoma, Citation1910; Xinxin & Brekke, Citation1989).
It is observed that for the cases with only one BI, inflow in the BI increases the stability of mass oscillations. A possible explanation is that for the case with one BI, the inflow reduces the water amount that must be transported from the upper reservoir, and thus the water velocity in the main tunnel. As can be seen from the Thoma-equation, the water velocity in the main tunnel is the major contributor to instability. For the case with two BIs the same will apply, but here the inflow also generates a stronger mass oscillation between the BIs so that the stabilizing effect is reduced.
For the configurations with one BI, a stronger throttling results in more stable mass oscillations when there is inflow, but a neglectable effect when there is no inflow. This is because the excitation amplitude is very small (0.001 p.u.) and around a stationary operation point. Hence the head loss generated from the throttle will be minimal.
For configurations with two BIs, increasing throttle loss in the upstream BI results in more stable mass oscillations. The reason why the throttle has an effect when there are two surge tanks, is that it influences the distribution of water inflow into the two BIs during mass oscillations. In other words, it affects the importance of each of the BIs in the system.
The results from this work are relevant both for upgrading of existing hydropower plants, but also for new hydropower plants with brook intakes. For BI2 acting as the main surge tank in the system, the design must consider the highest possible inflow in BIs, as the inflow can have destabilizing effects on the stability, especially when there are two BIs, and/or a surge tank throttle.
5 Conclusions
Brook intakes have a stabilizing effect on the mass oscillation stability in hydropower plants and should be accounted for in both design of new hydropower plants and upgrading of existing hydropower plants with brook intakes. The stabilizing effect is reduced with increasing brook intake inflow, and the design must account for the maximum inflow. For configurations with one brook intake acting as the main surge tank in the system, throttling has a positive effect on the stability. For configurations with two brook intakes, one of which is the main surge tank, the throttle has an opposite effect on the stability depending on if it is placed in the upstream- or downstream brook intake. For older existing hydropower plants with brook intakes, the stabilizing effect of the brook intakes may not have been accounted for in the original dimensioning of the system. For such cases, the stabilizing effect may allow for upgrading of the installed capacity without an expansion of the surge tank with regards to stability.
Notations
| A | = | cross-section area (m2) |
| Ath | = | Thoma cross-section area (m2) |
| BI | = | brook intake |
| c | = | sound speed (m s−1) |
| Cv | = | singular loss coefficient (–) |
| D | = | tunnel diameter (m) |
| dx | = | space resolution (m) |
| dt | = | time step (m) |
| f | = | Darcy–Weisbach friction factor (–) |
| FFT | = | Fast Fourier Transform |
| g | = | gravitational acceleration (m s−2) |
| h | = | non-dimensional head (–) |
| hf | = | friction head loss (m) |
| Hnet | = | het head (m) |
| J | = | polar moment of inertia (m4) |
| L | = | tunnel length (m) |
| MOC | = | Method of Characteristics |
| n | = | non-dimensional speed of rotation (–) |
| nref | = | non-dimensional reference speed of rotation (–) |
| p | = | non-dimensional hydraulic power (–) |
| q | = | non-dimensional discharge (–) |
| Q | = | discharge (m3 s−1) |
| RE | = | real value (–) |
| t | = | time (s) |
| y | = | non-dimensional guide vane opening (–) |
| α | = | guide vane opening (–) |
| ζ | = | head loss coefficient associated with throttling head-loss coefficient (–) |
| ξ | = | head loss coefficient (–) |
| ω | = | angular velocity (rad s−1) |
Data availability statement
All data from the current study are available on request from the authors.
Disclosure statement
No potential conflict of interest was reported by the author(s).
Additional information
Funding
References
- Brekke, H. (1984). A stability study on hydro power plant governing including the influence from a quasi nonlinear damping of oscillatory flow and from the Tuebine characteristics. The University of Trondheim, The Norwegian Institute of Technology.
- Calame, J., & Gaden, D. (1926). Théorie des chambres d'équilibre. Etude du mouvement varié de l'eau dans les conduites sous pression munies d'un réservoir à libre expansion. Suivie de renseignements complémentaires pour le calcul des chambres d'équilibre. La Concorde.
- Escande, L. (1952). Études Théoriques de la stabilité des chambres d'equilibre à étranglement. Comptes Rendus Académie des Sciences, 234(3), 299–301.
- Escande, L. (1963). The stability of throttled surge tanks operating with the electric power controlled by the hydraulic power. Journal of Hydraulic Research, 1(1), 4–13. doi:10.1080/00221686309500063
- Guo, W., & Zhu, D. (2020). Setting condition of downstream surge tank of hydropower station with sloping ceiling tailrace tunnel. Chaos, Solitons & Fractals, 134. doi:10.1016/j.chaos.2020.109698
- Hanif, C. (2014). Applied Hydraulic Transients. Springer-Verlag.
- Hanif, C., & Eugen, R. (1971). Surge tank stability by phase plane method. Journal of the Hydraulics Division, ASCE, 97(4), 765–775. doi:10.1061/JYCEAJ.0002931
- Jaeger, C. (1954). Present trends in surge tank design. Proceedings of the Institution of Mechanical Engineers, 168(1), 91–124. doi:10.1243/PIME_PROC_1954_168_015_02
- Jaeger, C. (1960). A review of surge-tank stability criteria. Journal of Basic Engineering, 82(4), 765–775. doi:10.1115/1.3662744
- Nicolet, C. (2007). Hydroacoustic modelling and numerical simulation of unsteady operation of hydroelectric systems. EPFL.
- Nilsen, T. K. (1990). Transient Characteristics of High Head Francis Turbines. Department of Hydro and Gas Dynamics, Norwegian University of Science and Technology.
- NVF. (2021). Nasjonal Veileder for Funksjonskrav i Kraftverksystemet (National Guide for Functional Requirements in the Power Plant System). Statnett.
- Pitorac, L., Vereide, K., Lia, L., Cervantes, M. J. (2022). Hydraulic scale modeling of mass oscillations in a pumped storage plant with multiple surge tanks. Journal of Hydraulic Engineering, 148(9). doi:10.1061/(ASCE)HY.1943-7900.0001990
- Report, I. C. (1973). IEEE transactions on power apparatus and systems: Dynamic models for steam and hydro turbines in power system studies. IEEE, PAS-92(6), 1904–1915. doi:10.1109/TPAS.1973.293570
- Strah, B., Kuljaca, O., & Vukic, Z. (2005). IEEE transactions on energy conversion: Speed and active power control of hydro turbine unit. IEEE, 20(2), 424–434. doi:10.1109/TEC.2004.837278
- Supply, W. G. P. M. a. E. (1992). IEEE transactions on power systems: Hydraulic turbine and turbine control models for system dynamic studies. IEEE, 7, 167–179. doi:10.1109/59.141700
- Svee, R. (1970). Untersuchungen uber die sabilitat bei wasserkraftanlagen mit idealer regelung (Studies on the stability of hydroelectric power plants with ideal control). NTH.
- Svee, R. (1972, September 6–8). Surge chamber with an enclosed, compressed air-cushion. International Conference on Pressure Surges, Canterbury, England.
- Svingen, B. (2005, October 13–14). Transient hydraulic simulations using component sub-vis in LabVIEW, SIMS 2005. Scandinavian Conference on Simulation and Modelling, NTNU, Norway.
- Svingen, B. (2016). LVTrans Manual.
- Svingen, B. (2022, November 15–18). Waterway stability analysis of hydropower plants using a nonlinear numerical method and FFT with focus on the response of hydraulic power. Pressure Surge Conference 2022, Prague, Czech Republic.
- Svingen, B., Luraas, H., & Walseth, E. C. (2011, October 26–28). Frequency response measurements and calculations with Water Column Compensation and Pressure Feedback. 4-th International Meeting on Cavitation and Dynamic Problems in Hydraulic Machinery and Systems, Belgrade, Serbia.
- Thoma, D. (1910). Zur Theorie des Wasserschlosses bei selbsttätig geregelten Turbinenanlagen (On the theory of water closure in independently controlled turbine systems). Walter De Gruyter.
- Vereide, K., Svingen, B., Nilsen, T., & Lia, L. (2017). The effect of surge tank throttling on governor stability, power control, and hydraulic transients in hydropower plants. IEEE Transactions on Energy Conversion, 32(1), 91–98. doi:10.1109/TEC.2016.2614829
- Walseth, E. C., Svingen, B., & Nielsen, T. (2011). Investigating the effect of turbine characteristics on the pressure response of a system. 4-th International Meeting on Cavitation and Dynamic Problems in Hydraulic Machinery and Systems, Belgrade, Serbia.
- Wylie, B. (1996, April 16-18). Unsteady internar flows – dimensionless numbers & time constants. In Pressure surges and fluid transients (pp. 283–288). BHR Group.
- Wylie, B., & Streeter, V. (1993). Fluid transients. McGraw-Hill.
- Xinxin, L. (1988). Hydropower system modelling by structure matrix method. NTNU.
- Xinxin, L., & Brekke, H. (1989). Large amplitude water level oscillations in throttled surge tanks. Journal of Hydraulic Research, 27(4), 537–551. doi:10.1080/00221688909499128
- Yang, J., & Kung, C. S. (1992). Nonlinear stability of differential surge chambers. Journal of Hydraulic Engineering, 118(11), 1526–1539. doi:10.1061/(ASCE)0733-9429(1992)118:11(1526)
- Yang, J., Kung, C. S., & Cederwall, K. (1992). Large-amplitude oscillations in closed surge chamber. Journal of Hydraulic Research, 30(3), 311–325. doi:10.1080/00221689209498921
- Zhou, J., Palikhe, S., Cai, F., & Liu, Y. (2020). Experimental and simulation-based investigations on throttle’s head loss coefficients of a surge tank. Energy Science & Engineering, 8(8), 2722–2733. doi:10.1002/ese3.717