
 ?Mathematical formulae have been encoded as MathML and are displayed in this HTML version using MathJax in order to improve their display. Uncheck the box to turn MathJax off. This feature requires Javascript. Click on a formula to zoom.
Abstract
Severe accident analysis for Korean OPR1000 with MELCOR 1.8.6 was performed by adapting a mitigation strategy under different entry conditions of Severe Accident Management Guidance (SAMG). The analysis was focused on the effectiveness of the mitigation strategy and its adverse effects. Four core exit temperatures (CETs) were selected as SAMG entry conditions, and Small Break Loss of Coolant Accident (SBLOCA), Station Blackout (SBO), and Total Loss of Feed Water (TLOFW) were selected as postulated scenarios that may propagate into severe accidents. In order to delay reactor pressure vessel (RPV) failure, entering the SAMG when the CET reached 923 K, 923 K, and 753 K resulted in the best results for SBLOCA, SBO, and TLOFW scenarios, respectively. This implies that using event-based diagnosis for severe accidents may be more beneficial than using symptom-based diagnosis. There is no significant difference among selected SAMG entry conditions in light of the operator's available action time before the RPV failure. Potential vulnerability of the RPV due to hydrogen generation was analyzed to investigate the foreseeable adverse effects that act against the accident mitigation strategies. For the SBLOCA cases, mitigation cases generated more hydrogen than the base case. However, the amount of hydrogen generated was similar between the base and mitigation cases for SBO and TLOFW. Hydrogen concentrations of containment were less than 5% before RPV failure for most cases.
1. Introduction
Design basis accidents (DBAs) are postulated accidents that may occur in nuclear power plants (NPPs) including various sub-systems, structures, and components under hypothesized accident conditions. To cope with DBAs, NPPs should be designed and constructed so as to withstand heavy loads during accident conditions without releasing the radioactive materials to the outside environment and the public. Without proper accident management, NPPs may experience severe accidents that lead to partial or complete meltdown of the reactor core and thereby significant release of fission products and hydrogen within and external to the containment building. In terms of hardware, NPPs should be equipped with well-designed reactor protection and safety systems associated with various engineered safety feature signals. In terms of accident management, well-established emergency operating procedures (EOPs) are critical for ensuring reactor safety and preventing severe accidents. Although very rare, if major engineering safety features such as high- and low-pressure safety injection (HPSI and LPSI) systems are unavailable, the NPP may proceed to early conditions of a severe accident, which can be manifested by detection of various safety signals of core exit temperature (CET), core water level, pressurizer pressure, coolant flow rate, reactor coolant system (RCS) vibration, and steam generator water level, to mention a few. A representative safety signal diagnosing the physical state of the accident is the CET, which is measured by the in-core instrumentation (ICI) assembly located at the top of the reactor core. If the CET reaches a certain setpoint judged as the beginning of core degradation, the EOP state is shifted to the initiation of Severe Accident Management Guidance (SAMG). shows the simplified characteristics in the regimes of the two types of accident managements. The SAMG entry conditions differ by reactor. In Korea, there are currently four major types of pressurized water reactors (PWRs) operating: Combustion Engineering Owners Group (CEOG) PWR, Westinghouse Owners Group (WOG) PWR, Framatome PWR, and Optimized Power Reactor 1000 (OPR1000), which is an evolutionary type of CEOG PWR. The SAMG entry conditions for each reactor are 753 K, 923 K, 923 K, and 973 K for CEOG PWR, WOG PWR, OPR1000, and Framatome PWR, respectively. shows the typical characteristics of various PWRs operating in Korea at the time of publication of this paper [Citation1–4].
Table 1. Typical characteristics of OPR1000 (Shin Kori units 1 and 2), CEOG PWR (Hanbit units 3 and 4), WOG PWR (Hanbit units 1 and 2), and Framatome PWR (Hanul units 1 and 2) at nominal operation.
Figure 1. Characteristics for two regimes of accident management.
In our previous study of severe accident analysis for OPR1000, the effectiveness of the severe accident mitigation strategy was investigated with the fixed SAMG entry condition of CET = 923K [Citation5]. Although OPR1000 is an evolutionary type of CEOG PWR, the SAMG entry condition from the WOG PWR was employed. Thus, the effects of different CET values of SAMG entry conditions for different reactors are of interest. This is due to the fact that each reactor retains unique thermal-hydraulic characteristics owing to diverse features of the reactor core structure and loop systems. Therefore, SAMGs are developed by owners groups such as the Nuclear Energy Agency of Organization for Economic Co-operation and Development (OECD/NEA), CEOG, and WOG. In the WOG SAMG, CET = 923 K is set as the SAMG entry point, which indicates that the reactor core state is 75% uncovered [Citation6]; therefore, core degradation is initiated by inappropriate core cooling. However, the validity of the determination logic has not been fully elucidated.
As stated earlier, OPR1000 is an evolutionary reactor of CEOG PWR, and its SAMG employs CET = 923 K, which is the SAMG entry condition of WOG PWR. In addition, applying a unified CET value as the SAMG entry condition has been considered for all severe accidents that have not undergone more systematic accident analyses. Such an approach to accident response is based on a symptom-based diagnosis, which is considered appropriate for severe accidents. In general, an event-based diagnosis is used for DBAs under very limited conditions. However, it is questionable whether applying the unified SAMG entry condition (symptom-based diagnosis) for all accident scenarios is reasonable. A general thought is that accident sequences are strongly dependent on the thermal-hydraulic conditions, which differ with type of accident. For example, Small Break Loss of Coolant Accident (SBLOCA), Station Blackout (SBO), and Total Loss of Feed Water (TLOFW) will result in different behaviors of the RCS pressure, temperature, and water level. This suggests that mitigation actions may necessitate different SAMG entry conditions to produce more effective mitigation results. Most of all, a substantial gap exists between beliefs and practical data validating these beliefs related to the validity of the SAMG entry condition. Therefore, it is imperative to perform a more detailed analysis using systematic codes of Probabilistic Safety Assessment (PSA) Level 2. Moreover, this may further suggest the feasibility of using event-based diagnosis for severe accidents with proper and detailed analyses.
Typical PSA Level 2 analysis code includes the MELCOR, SCDAP/RELAP5, and MAAP, and some analyses of the effects of mitigation strategies in case of severe accidents using these codes are reported in the literature. Carbajo investigated sensitivity studies of SBO using MELCOR for a Peach Bottom PWR [Citation7]. Park et al. analyzed several scenarios of severe accidents using MELCOR 1.8.5 for the purpose of regulation [Citation8]. In addition, Wang et al. compared the simulation results of large break loss of coolant accident (LBLOCA) and SBO using SCDAP/RELAP5, MAAP, and MELCOR for Kuosheng NPP [Citation9]. Also, Vierow et al. studied the TMLB accident at the Zion NPP with various codes of the MELCOR, MAAP4, and SCDAP/RELAP5 [Citation10]. Ahn et al. researched sensitivity analyses of the loss of coolant accident (LOCA) for APR1400 with MELCOR 1.8.4 [Citation11]. Lee et al. studied the effectiveness of mitigation strategies for OPR1000 using MAAP4 [Citation12]. Huang et al. investigated the effectiveness of the RCS bleed-and-feed strategy for Kuosheng BWR using MELCOR 1.8.5 [Citation13]. Birchley et al. analyzed the loss of RHR for a Westinghouse two-loop PWR [Citation14]. Park et al. evaluated the effectiveness of the RCS depressurization strategy of the SBLOCA and TLOFW for OPR1000 [Citation15,16] and APR1400 [Citation17]. Huh et al. studied the optimum area of the flow path of RCS depressurization for severe accident mitigation with the MELCOR for the Ulchin unit 1 PWR [Citation18]. Haste et al. analyzed the accident management of LOCA with MELCOR for a Westinghouse two-loop PWR [Citation19]. Park and Hong investigated available action time for severe accidents with the SCDAP/RELAP5 for OPR1000 [Citation20]. In Korea, there has been a growing demand for severe accident analyses using the MELCOR code, although not much research has been conducted. In particular, studies on the SAMG entry condition and its adverse effects have been extremely limited.
Therefore, this study focuses on the analysis of the effects of the CET as the SAMG entry condition on the effectiveness of severe accident management of Korean OPR1000 using the severe accident analysis code MELCOR 1.8.6. Given the important accident scenarios based on PSA Level 1 analysis, major accident scenarios could be selected to include SBLOCA, SBO, and TLOFW [Citation21]. Using these scenarios, the important objectives of this study are first to investigate the application of mitigation strategy at various SAMG entry conditions for postulated accident scenarios in view of reactor pressure vessel (RPV) failure and to analyze the effectiveness and adverse effects of the mitigation strategies. This work will provide insight into using event-based diagnosis for severe accidents because unified SAMG entry conditions might not produce the most effective results for every accident.
2. Simulation descriptions
2.1. MELCOR description and input model of OPR1000
MELCOR is the severe accident analysis code for the light water reactor NPP developed by Sandia National Laboratory for the US Nuclear Regulatory Commission. PSA Level 2 analyses, the development and validation of severe accident management strategies, are conducted using MELCOR. MELCOR can simulate thermal-hydraulic response of the primary RCS, core uncovering, fuel heat-up, cladding oxidation, fuel degradation (geometry change), heat-up of the RPV lower head by the molten core, lower plenum penetration, hydrogen production, fission product release, etc. [Citation22]. Numerous states have used MELCOR for the regulation of LWR [Citation8,Citation23,Citation24]. In particular, the Korean regulatory body has utilized MELCOR for monitoring and diagnosis of severe accidents [Citation25,26].
shows the overall nodalization of the target plant OPR1000 for the MELCOR simulation. The Korean PWR OPR1000 is an evolved design of CEOG PWR. It consists of two loops of nuclear steam supply system and has 1000 MW of electrical output. The input model consists of a core (control volume (CV) 170); a CET monitoring volume (CV 190); a downcomer (CV 130); a lower and a upper plenum (CV 150 and 260); four cold legs (CV 380, 390, 480, and 490); two hot legs (CV 310 and 410); a pressurizer (CV 500); two steam generators composed of a primary side inlet (CV 330 and 430), outlet (CV 337 and 437), and secondary sides (CV 600, 700, 610, and 710); and four safety injection tanks (SITs; CV 382, 392, 482, and 492). The dedicated upper plenum volume for collecting CET information (CV 190) is allocated to the top of the core. The SITs are activated when RCS pressure decreases to 4.3 MPa. The pressurizer has two safety depressurization system (SDS) valves and a pressure safety relief valve (PSRV) that are all connected to the containment (CV 820). The SDS is operated as a mitigation strategy under a high-pressure sequence for direct RCS depressurization. Set pressures of the PSRV are 17.24 MPa and 14.1 MPa for open and close, respectively. Each steam generator is equipped with two atmospheric dump valves (ADVs) and four condenser dump valves (CDVs). Main steam isolation valves (MSIVs) and main steam safety valves (MSSVs) are included in the secondary sides. shows the core nodalization of the OPR1000 MELCOR. The core consists of 7 radial rings and 14 axial levels. The active fuel region is from the 4th to the 13th axial level. The first to the third axial levels are dedicated to the lower plenum, and the 14th axial level is for assembly of the upper region.
Figure 2. MELCOR nodalization of OPR1000.
Figure 3. MELCOR nodalization for core.
2.2. Simulation matrix and mitigation strategy for accidents
summarizes a matrix for simulations investigated in this work. The CEOG, WOG, Framatome, and EDF PWR implement CETs of 753 K, 923 K, 973 K, and 1373 K for SAMG entry conditions, respectively. For OPR1000, transition to the SAMG is initiated when the CET reaches 923 K, which is the same entry condition adopted for the WOG PWR. Among these conditions, the CEOG, WOG, and Framatome CET values are selected. In addition, an arithmetic average CET between the standards of the CEOG PWR and OPR1000, i.e., CET = 838 K, is added to fill the gap between the CEOG and OPR1000. In order to investigate the effects of various SAMG entry conditions, three cases of initiating events are selected: SBLOCA, SBO, and TLOFW. shows initiating events that have a high probability of transition to a severe accident based on the PSA Level 1 analysis [Citation21]. For the SBLOCA, a 1.35-inch break on a cold leg is assumed, and loss of all offsite power and all secondary feed water are assumed for the SBO and TLOFW, respectively. Mitigation-02 is conducted by opening one ADV for the SBLOCA and opening one SDS for the SBO and TLOFW.
Table 2. Summary of the simulation matrix.
Table 3. Probability of transition from initiating events to severe accidents for OPR1000.
If core damage is noted, a transition in accident management from the EOP to the SAMG is implemented by the technical support center (TSC) in order to mitigate an accident based on strategies described in the SAMG. In contrast to the prediction of a preventive regime, some uncertainties in diagnosing plant status and consequences of mitigation actions may occur when predicting the mitigation regime. As such, the sequence of action based on the SAMG may result in both positive and negative effects. For these reasons, mitigation strategies with positive and negative effects should be included in the SAMG [Citation27]. Each mitigation strategy is conducted by monitoring plant safety parameters: steam generator level, RCS pressure, and CET, to mention a few. The equipment and parameter measurements needed to conduct a mitigation strategy are also implemented in the SAMG.
The SAMG of OPR1000 was developed by quantitative risk analysis through individual plant examination (IPE) and PSA analysis, based on the WOG SAMG [Citation28]. A transition from the EOP to the SAMG is introduced when the CET = 923 K. shows a flowchart of SAMG applicable for OPR1000 [Citation29]. When the SAMG is initiated by the TSC under a severe accident condition, plant safety parameters are monitored, and Mitigations-01 through 07 are performed according to the flow chart. If conditions of Monitoring-01 are satisfied, the SAMG is terminated successfully. The setpoints of monitoring parameters for conducting mitigation strategies are determined through IPE because vulnerability toward severe accidents is different for various plants [Citation28]. For instance, the judgment for hydrogen threat might be considered with hydrogen concentration of four, five, or other numbers of percentage, which depends on availability of hydrogen control instrumentation such as igniter or passive autocatalytic recombiner. For OPR1000, the mitigation strategy for hydrogen threat is conducted when the hydrogen concentration of the containment is over 5%. shows the detailed objectives and equipment for the SAMG of OPR1000. Mitigations-01 to 03 are concerned with in-vessel phenomena, and Mitigations-05 to 07 are focused on the ex-vessel scope, which aims to maintain the integrity of containment and prevent release of radionuclides. Mitigation-04 is related to both in-vessel and ex-vessel scopes.
Table 4. Severe accident mitiygation strategies of SAMG.
Figure 4. Flowchart of SAMG of OPR1000.
In order to adopt mitigation strategies according to the SAMG flow chart of OPR1000, Mitigation-02 is applied for the postulated initiating events. In the case of the SBLOCA, opening the ADV facilitates heat transfer through secondary side feed-and-bleed, which depressurizes the RCS. For the SBO and TLOFW, direct RCS depressurization by opening one SDS of the pressurizer is adopted as a proper mitigation mean. In the case of the SBO, it is assumed that emergency power (emergency diesel generators or DC power) for opening SDS is available. In addition, to be conservative, both HPSI and LPSI are assumed to be unavailable for the TLOFW. Borated water from four SITs with a capacity of 218 m3 is injected into cold legs for all three postulated initiating events if the RCS pressure decreases to 4.3 MPa. The SITs are of passive injection type and are identical to the cold leg accumulators of WOG PWR.
3. Results and discussion
Using MELCOR, severe accident sequences were simulated with the OPR1000 plant model, given the selected accident scenarios of the SBLOCA, SBO, and TLOFW while adopting various CETs as the SAMG entry condition. First, steady-state and transient calculations were performed to verify an input model, and the results are discussed in Section 3.1. Second, three base cases including SBLOCA, SBO, and TLOFW were simulated to establish references for the respective accident scenarios. These base cases refer to the simulations in which no mitigation actions were taken. Detailed accident sequences and the validity of the simulation are discussed in Section 3.2. Finally, 12 additional cases of SBLOCA, SBO, and TLOFW were simulated with introduction of the RCS depressurization strategy of Mitigation-02 embedded in the Korean SAMG. Mitigation-02 was conducted as soon as CET reached the selected SAMG entry condition. Analysis of the effectiveness and adverse effects of the mitigation strategies is discussed in detail in Section 3.2.
3.1. Verification of nodalization
Using the current MELCOR simulation, a steady-state calculation was performed to verify the suitability of the nodalization of OPR1000. Nominal operating conditions of OPR1000 are available in the final safety analysis report (FSAR) [Citation4]. shows a comparison of the operating conditions and steady-state calculation results of OPR1000. The MELCOR results are in good agreement with the nominal FSAR values, which confirms the suitability of current MELCOR nodalization.
Table 5. Design value and steady-state conditions of OPR1000.
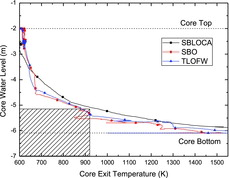
In addition, a simple transient calculation was conducted in order to verify whether nodalization was suitable in the case of transient. In the case of transient, the SAMG of OPR1000 is initiated when CET reached 923 K, which indicated the core uncovery is about 75% [Citation6]. shows the comparison between CET and core water level. Core water levels of three initiating events were near −4 m, which indicates 75% of core uncovery. Therefore, it could be stated that the nodalization of OPR1000 is suitable for transient analysis.
Figure 5. Core water level dependent on CET of base cases.
3.2. Base cases
A timeline of significant events without mitigation strategies of the base cases is summarized in . All accidents started at time = 0 s, and the reactor was tripped by receiving a signal from the pressurizer for the case of SBLOCA, a power loss signal for the SBO, and a steam generator low water level signal for the TLOFW. Also, the reactor coolant pump tripped due to cavitation for the SBLOCA and TLOFW and power loss for the SBO. For SBO, it was assumed that all offsite powers were cut and therefore reactor trip and RCP trip occurred simultaneously at 0.00 h. However, in the case of SBLOCA and TLOFW, offsite power was alive. Therefore, an RCP trip was not triggered until the pump received a trip signal, which is actuated by pump cavitation. For all three base cases, decay and oxidation heat with insufficient core cooling caused the core to be uncovered, heated, and degraded to a molten state. As the core was heated, the CET also increased with a similar rate of increase. As the insufficient cooling continued, the molten core was relocated to the lower plenum. Finally, RPV failure occurred through lower head penetration for the SBLOCA and by creep rupture for the SBO and TLOFW. The RPV failure times of each initiating event were calculated as 5.29, 3.81, and 2.40 h for the SBLOCA, SBO, and TLOFW, respectively. For the SBLOCA, SITs were activated after relocation to the lower plenum because the RCS pressure was decreased to the setpoint of the SIT injection. However, for SBO and TLOFW, injection of the SITs was not actuated because high-pressure sequences continued.
Table 6. Sequences of base cases.
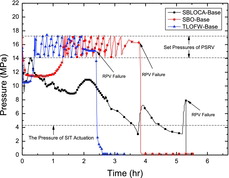
shows the RCS pressures of the base cases. For SBLOCA, the RCS pressure rapidly decreased, and the reactor trip signal transmitted at 0.04 h. After the reactor coolant pump tripped at 0.06 h, the RCS pressure reached a peak value of approximately 14 MPa due to lack of heat removal. Then, the pressure decreased because of the break flow. At approximately 1.75 h, the initiating of boiling in the core caused the RCS pressure to increase slowly. However, continuous loss of coolant from the break allowed the pressure to decrease. At 3.63 h, the SITs were injected, which increased the RCS pressure due to the vaporization of injected water from the SITs. Increased RCS pressure driven by the vaporization of core water deactivated the SIT injection. Very rapid increase of RCS pressure was hindered after vaporization because of increased discharging flow rate through the small break. This sequence was repeated several times, and then RPV failure occurred at 5.29 h. An interesting result is that not all the SIT inventory was used at the time of RPV failure. In the case of the SBO, the reactor and the RCP tripped at 0 time. The core was cooled slowly by natural circulation, and the RCS pressure was maintained at approximately 11 MPa. However, after steam generator dry-out, vaporization occurred in the core, and the RCS pressure started to increase. The PSRV opened and closed repeatedly, corresponding to set pressures of 17.24 and 14.1 MPa, respectively. Additional injection for cooling was unavailable because the high pressure sequence continued; as a result, RPV failure occurred. In the case of the TLOFW, the overall behaviors of the RCS pressure were very similar to that of SBO. However, the RCP pressure increased earlier than in the SBO case due to the delayed RCP trip. When main and auxiliary feed water were unavailable, forced convection was enacted by the RCP until the time of RCP trip, and this made it more difficult to cool the core due to acceleration of vaporization. As a result, pressure increased rather rapidly, and the PSRV opened and closed repeatedly at the set pressures. Finally, RPV failure occurred without proper depressurization or cooling injection.
Figure 6. RCS pressure of base cases.
3.3. SAMG entry condition effect on in-vessel mitigation
As observed in the simulation results of the base cases, RPV failure occurred within 6 h for all accidents not employing feasible mitigation strategies such as actuation of the SDS and ADV. However, by implementing the mitigation strategies, RPV failure time was delayed significantly compared to the base cases. In case of the SBLOCA, one ADV was opened to promote RCS cooling through the steam generator. In cases of the SBO and TLOFW, one SDS was opened to directly reduce the RCS pressure. Unless the RCS pressure decreases, the SITs, which are the only cooling source, cannot be injected for SBO and TLOFW cases. Our previous study reported general trends of the RCS pressure, water level of the core, CET, relocated debris mass, and accumulated oxidation energy during hypothesized severe accidents of the SBLOCA, SBO, and TLOFW [Citation5]. For the SBLOCA, the same mitigation strategy of opening the ADV was applied. However, the initiating SAMG with a delay time of 5 min after reaching the CET = 923 K showed a slight difference. Likewise, opening the SDS was adopted as the mitigation strategy, and a delay of 5 min was applied. In this study, since the focus is the effect of the CET setpoints and SAMG entry conditions on RPV failure time, many of the details about the accident sequences can be found in our previous study and are therefore not discussed in detail here, allowing us to focus on the effectiveness and adverse effects of the CET setpoints.
3.3.1. Effectiveness of CET setpoints as SAMG entry condition on RPV failure time
The effect of SAMG entry conditions on the RPV failure time was analyzed in terms of the operator's available action time and delayed RPV failure time. In addition, mass balance among the core water inventory, injected water, and discharged water was analyzed to investigate the effect of SIT injection on the delay of RPV failure. shows the conceptual diagrams of two types of measured time. Operator's available action time was calculated as the differential time between the time the CET reached the hypothesized SAMG entry conditions and the RPV failure time of the base cases. Delayed RPV failure time was measured as the time between the onset of RPV failure of the base case and that of mitigation cases.
Figure 7. Two types of calculated time for RPV failure.
shows the operator's available action time. There are differences in operator's available action time among the selected SAMG entry conditions, with differences as large as to 648 s. Considering the shortest operator's available action time was 1.38 h (∼5400 s), securing an additional 648 s might not be considered a significant result. Therefore, sensitivity on operator's available action time is not deemed a considerable factor affecting the effectiveness of the severe accident mitigation strategies. However, it should be noted that, if operator action is delayed for a long time, undesirable results might appear such as hydrogen generation and oxidation.
Table 7. Operator's available action time.
shows delayed RPV failure time compared to base cases. For the SBLOCA, opening one ADV as a mitigation strategy significantly delayed RPV failure time by about 24 h. This is attributed to effective cooling through secondary sides. The most delayed RPV failure time occurred when a mitigation strategy was conducted at CET = 923 K, which is the current SAMG entry condition of OPR1000. For the SBO and TLOFW, opening SDS as a mitigation strategy delayed RPV failure time by about 2.4 and 13 h, respectively. Since cooling through the secondary side was very inefficient, RPV failure time occurred relatively earlier than the SBLOCA mitigation cases. The most delayed RPV failure time took place when a mitigation strategy was conducted at CET = 923 K for the SBO and at CET = 753 K for the TLOFW. No consistent trend of the relationship between SAMG entry condition and RPV failure time was observed. In general, accident sequences of SBO and TLOFW are known to be similar to each other. However, the trip signals initiating the respective event are different. Since the TLOFW was initiated with the steam generator low-level signal, its accident sequences were progressed in a more unfavorable fashion without a mitigation action. With the delayed trip signal, earlier application of the mitigation strategy resulted in a better mitigation. Nonetheless, it should be noted that earlier operator action or current SAMG entry conditions might not always yield the best result.
Table 8. Delayed RPV failure time by mitigation strategy.
As presented in , a current, unified SAMG entry condition might not produce the most desirable result in terms of delaying RPV failure. This is because the diagnosis of a severe accident is based on the symptoms of the plant. The symptom-based diagnosis is simply conducted by monitoring plant safety parameters such as CET, pressurizer pressure, SG water level, and relevant parameters to the plant safety. Therefore, the symptom-based diagnosis bears advantages compared to an event-based diagnosis in terms of the availability of an operator's quick response. Most IAEA member states prefer to use the symptom-based diagnosis for severe accidents because severe accidents have characteristics of limited availability of monitoring parameters and accompany a dramatic and rapid change in phenomena such as core degradation, oxidation, and hydrogen generation [Citation30]. However, if symptom-based diagnosis might not produce the desirable result, it is necessary to consider use of event-based diagnosis for severe accidents. Most of all, it should be noted that MELCOR implements numerous correlations and empirical models, which tend to yield some uncertainty. Nonetheless, this study suggests that use of event-based accident management will be beneficial if early diagnosis is successful.
Mass balance analysis for RCS has been performed to investigate the effect of SIT injection on the delayed RPV failure time associated with the CET of SAMG entry points. The pressures of the pressurizer and SIT were calculated, and cumulative mass injected to and from the RCS was also calculated. For all three accident scenarios, injection to the RCS originates from the SIT, but the ejection path has multiple possibilities. For the SBLOCA, the break in the cold leg is the only path for water ejection. In the cases of the SBO and TLOFW, however, the paths for water ejection are PSRV and SDS. , and show the detailed pressure and corresponding mass balance of the SBLOCA-923K, SBO-923K, and TLOFW-753K, respectively.
Figure 8. Pressure behavior and cumulative water mass injected and ejected regarding RCS for SBLOCA-923K, the most delayed RPV failure time case.
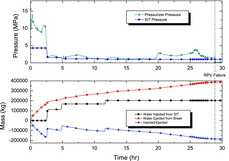
Figure 9. Pressure behavior and cumulative water mass injected and ejected regarding RCS for SBO-923K, the least delayed RPV failure time case.
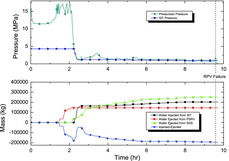
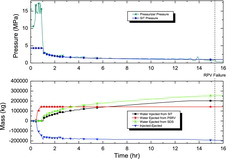
Figure 10. Pressure behavior and cumulative water mass injected and ejected regarding RCS for TLOFW-753 K, the most delayed RPV failure time case.
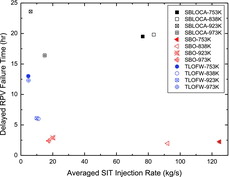
Through the analysis, it was found that SIT injection played an important role in delaying the RPV failure. Thus, the timing and duration of the SIT injection were investigated thoroughly, from which an average SIT injection rate was estimated to explain its effect on the delayed RPV failure time. The average SIT injection rate is defined as the total mass of SIT injected over the actual duration of the SIT injection and is given in Equation (1). shows the relationship between average SIT injection rate and delayed RPV failure time. The lower injection rate of the SIT under 20 kg/s of injection region resulted in a dramatic delaying of the RPV failure time. Note that the amount of borated water in the SIT inventory is fixed, and exhaust of the SITs differs with the accident scenario and is particularly dependent on the RCS pressure. Therefore, operator cannot control the injection rate of SIT. In cases of SBLOCA with the explored SAMG entry conditions, injection rate varied from approximately 5 to 80 kg/s. The SBLOCA-923K, which showed the lowest SIT injection rate, resulted in the most delayed RPV failure time. As the SIT injection rate increased, the delayed RPV failure time decreased at an injection rate of 18 kg/s and slightly increased at an injection rate of approximately 80 kg/s. In cases of the SBO with the selected CET setpoints, the best mitigation result was obtained with CET = 923 K. A corresponding SIT injection rate was evaluated to be approximately 20 kg/s. Especially, for the two cases of SBLOCA-923 K and SBLOCA-973 K, the injection rate of SIT was significantly lower than the other two cases. This was because of initiation of SIT at more severe thermal state of the core for two cases. However, it should be noticed that the initiation of SIT at the later phase of accident might not always bring better result because the RPV failure might occur before the full depletion of SIT. Interestingly, the best mitigation result for the TLOFW was obtained when the CET was set to 753 K, which is the CET used for the CEOG SAMG entry point. The corresponding SIT injection rate recorded the lowest value of 5 kg/s. It should be noted that SIT injection rate was not controlled in the current study as the main interest was the effect of the CET and the resulting influence of the SIT injection rate. Thus, the SIT injection rate was investigated to support the CET effect from the analysis. From this analysis, a general trend was observed that a lower injection rate tended to provide a more effective cooling considering the fixed borated water mass in the SIT. Also, it is important to use all the borated water mass during accident management even though the current OPR1000 does not include control of the injection rate. As shown clearly in and , SIT was injected in a stepwise fashion due to vaporization of the core.
(1)
(1)
Figure 11. Delayed RPV failure time as a function of the average SIT injection rate.
3.3.2. Adverse effect of mitigation strategy
Execution of severe accident mitigation strategies often results in adverse effects on the safety of the nuclear systems. For example, opening ADV may cause steam generator tube rupture, and RCP restart may cause an additional LOCA by breaking a seal in the RCP. The worst adverse effect may be acceleration of the oxidation of the reactor core, which generates exothermic energy and hydrogen gas. Since the current study investigates the Mitigation-02 of RCS depressurization, plausible adverse effects are the generation of hydrogen gas and oxidation energy and pressurization of the containment building. In the case of a severe hydrogen-generating accident, the TSC monitors the concentration of hydrogen in the containment because hydrogen is explosive in high concentration. In the SAMG of OPR1000, Mitigation-07 is considered for activation when hydrogen concentration is greater than 5% [Citation29].
The hydrogen generation and the concentration of hydrogen in containment for base and mitigation cases are analyzed in the current section. The calculation of concentration was conducted until the time of RPV failure for each case. Therefore, the analysis of hydrogen generation is focused on comparison of the hydrogen threat between base and mitigation cases before RPV failure.
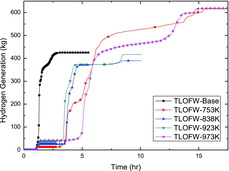
– show the hydrogen generation for all 15 cases, evaluated as a cumulative quantity until the time of the RPV failure. The amount of hydrogen generation is related to the amount of reaction between water and core materials such as zirconium, stainless steel, and uranium. For the SBLOCA, mitigation cases caused more hydrogen generation. In , it is shown that hydrogen generation was delayed significantly with the mitigation strategies. With SAMG entry at CET = 923 K, which was the best mitigation case, accumulation was delayed longer than in the other cases. For the SBO, the tendency toward hydrogen generation of the base case was similar to that in the mitigation cases. As seen in , the largest amount of hydrogen was generated for SBO-923 K. However, with adoption of CET = 838 K, accumulation of hydrogen was the lowest among the investigated cases. shows accumulation of hydrogen for TLOFW, with TLOFW-753 K and TLOFW-923 K showing comparatively large amounts of hydrogen generation compared to the other cases because of the prolonged SIT injection. The slower injection rate of SIT for TLOFW-753 K and TLOFW-923 K than the other cases might induce more chances of exothermic reactions between water and core materials, which resulted in a significant hydrogen generation.
Figure 12. Amount of hydrogen generation for SBLOCA cases.
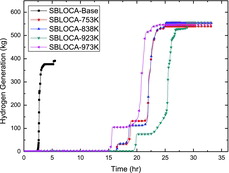
Figure 13. Amount of hydrogen generation for SBO cases.
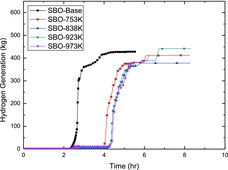
Figure 14. Amount of hydrogen generation for TLOFW cases.
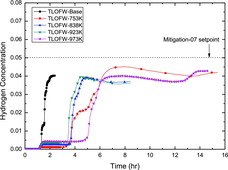
The results of hydrogen concentration in containment are shown in –. Hydrogen generation before RPV failure was mostly due to in-vessel phenomena such as the reaction between zirconium and water or oxygen during core melting. The hydrogen generation was limited, below 1000 kg, because the zirconium inventory of the core was limited. However, hydrogen generation after RPV failure was due to various ex-vessel phenomena such as direct containment heating, fuel–coolant interaction, and molten core–concrete interaction [Citation31]. For this reason, for all 15 cases, hydrogen concentration increased after RPV failure. shows the hydrogen concentration of the SBLOCA base case and mitigation cases. The start of hydrogen generation occurred in the order of SAMG entry condition of CET = 973 K, 838 K, 753 K, and 923 K. The starting time of hydrogen generation is closely related to the degree of core cooling. If the hydrogen generation started earlier, it could be a result of insufficient core cooling. For all initiating events, this insufficient core cooling was due to rapid depletion of the SIT. In the base case of the SBLOCA, the hydrogen concentration was less than 5% until the time of RPV failure, and thus Mitigation-07 was not considered. In the mitigation cases of the SBLOCA, 753 K and 838 K cases showed a hydrogen concentration greater than 5% before RPV failure, thus requiring Mitigation-07. The hydrogen concentration for SBLOCA-923 K was close to but not in excess of 5%, and the concentration for SBLOCA-973 K was approximately 4%. and show the hydrogen concentrations of all SBO and TLOFW cases, respectively. In the base case of the SBO and TLOFW, the hydrogen concentration was approximately 4%, and thus did not necessitate Mitigation-07. For SBO mitigation cases, the concentration was between about 4% and 4.5%, and, again, execution of Mitigation-07 was not required. Similarly, the TLOFW mitigation cases showed a concentration between about 3.5% and 4.5%, not requiring Mitigation-07. In addition, a decrease in the hydrogen concentration was observed in the SBLOCA-base and TLOFW mitigation cases. This was not due to the elimination of hydrogen but due to containment pressurization caused by water from the RCS break (small break of SBLOCA and opened SDS of TLOFW). The decrease in hydrogen concentration was not observed in SBO mitigation cases due to relatively early RPV failure compared to TLOFW mitigation cases.
Figure 15. Hydrogen concentration of SBLOCA cases.
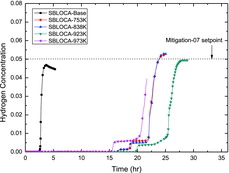
Figure 16. Hydrogen concentration of SBO cases.
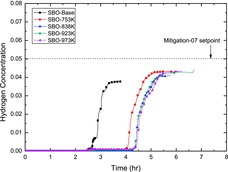
Figure 17. Hydrogen concentration of TLOFW cases.
4. Conclusion
The effectiveness of SAMG entry conditions for postulated scenarios was analyzed with the MELCOR 1.8.6. First, SBLOCA, SBO, and TLOFW with mitigation strategies were investigated in terms of delaying RPV failure. Second, the evaluation of in-vessel hydrogen generation was performed to investigate the adverse effects of mitigation strategies. Major findings can be summarized as follows:
The performance of mitigation strategies with four SAMG entry conditions (the time when CET = 753 K, 838 K, 923 K, and 973 K) was analyzed. The most delayed RPV failure time occurred with different SAMG entry conditions for different scenarios. Therefore, it is advisable to consider using event-based diagnosis for severe accidents in further detailed studies.
Lower injection rate of SIT resulted in more delayed RPV failure time. In particular, SIT injection rates lower than 20 kg/s dramatically increased the delay in RPV failure time.
Hydrogen threats when applying Mitigation-02 were investigated. For most cases, Mitigation-07 for hydrogen control was not needed until the RPV failure. The amount of hydrogen generation for the base case was generally less than those in the mitigation cases.
Additional information
Funding
References
- Korea Electric Company. Korea nuclear units 7 & 8 preliminary safety analysis report. Seoul: Korean Electric Company; 1979.
- Korea Electric Company. Korea nuclear units 9 & 10 final safety analysis report. Seoul: Korean Electric Company; 1986.
- Korea Electric Power Corporation. Yonggwang nuclear units 3 & 4 preliminary safety analysis report. Seoul: Korean Electric Company; 1988.
- Korea Hydro and Nuclear Power. Shin Kori 1 & 2 final safety analysis report. Seoul: Korea Hydro and Nuclear Power; 2008.
- Lee S, Ha KS, Kim H-Y, Kim SJ. Validation of RCS depressurization strategy and core coolability map for independent scenarios of SBLOCA, SBO, and TLOFW. J Nucl Sci Technol. 2013;51:181–195.
- OECD/NEA. Core Exit Temperature (CET) effectiveness in accident management of nuclear power reactor. Paris: OECD/NEA; 2010. (Report no. NEA/CSNI/R(2010)9).
- Carbajo JJ. MELCOR sensitivity studies for a low-pressure, short-term station blackout at the Peach Bottom plant. Nucl Eng Des. 1994;152:287–317.
- Park JH, Kim H, Lee C. Regulatory research of the PWR severe accident. Daejeon: Korea Institute of Nuclear Safety; 2000.
- Wang T-C, Wang S-J, Teng J-T. Comparison of severe accident results among SCDAP/RELAP5, MAAP, and MELCOR codes. Nucl Technol. 2005;150:145–152.
- Vierow K, Liao Y, Johnson J, Kenton M, Gauntt R. Severe accident analysis of a PWR station blackout with the MELCOR, MAAP4 and SCDAP/RELAP5 codes. Nucl Eng Des. 2004;234:129–145.
- Ahn K-I, Park S-Y, Cho S-W. MELCOR 1.8.4 sensitivity analysis of the severe accident evolution during the APR 1400 LOCA. Ann Nucl Energy. 2006;33:71–83.
- Lee BC, Jeong JH, Na MG. Effects of accident management strategy on the severe accident environmental conditions. Ann Nucl Energy. 2006;33:13–21.
- Huang IM, Ferng YM, Wang SJ. Validation of RCS Bleed-And-Feed strategy for the SAMG of the Kuosheng nuclear power plant. Nucl Technol. 2007;160:294–307.
- Birchley J, Haste T, Richner M. Accident management following loss of residual heat removal during mid-loop operation in a Westinghouse two-loop PWR. Nucl Eng Des. 2008;238:2173–2181.
- Park R-J, Kim S-B, Kim H-D. Evaluation of the RCS depressurization strategy for the high pressure sequences by using SCDAP/RELAP5. Ann Nucl Energy. 2008;35:150–157.
- Park R-J, Kim S-B, Hong S-W, Kim H-D. Detailed evaluation of coolant injection into the reactor vessel with RCS depressurization for high pressure sequences. Nucl Eng Des. 2009;239:2484–2490.
- Park R-J, Hong S-W. Detailed evaluation of RCS boundary rupture during high-pressure severe accident sequences. J Nucl Sci Technol. 2011;48:1396–1402.
- Huh C, Suh N, Park G-C. Optimum RCS depressurization strategy for effective severe accident management of station black out accident. Nucl Eng Des. 2009;239:2521–2529.
- Haste T, Birchley J, Richner M. Accident management following loss-of-coolant accidents during cooldown in a Westinghouse two-loop PWR. Nucl Eng Des. 2010;240:1599–1605.
- Park R-J, Hong S-W. Effect of SAMG entry condition on operator action time for severe accident mitigation. Nucl Eng Des. 2011;241:1807–1812.
- Park R-J, Kang K-H, Ha K-S, Cho Y-R, Koo K-M, Kim S-B, Kim H-D. Detailed analysis of a severe accident progression for an evaluation of in-vessel corium retention estimation in KSNP (Report no. KAERI/TR-2959/2005). Daejeon: Korea Atomic Energy Research Institute; 2005.
- Gauntt RO, Cole R, Hodge S, Rodriguez S, Sanders R, Smith R, Stuart D, Summers R, Young M. MELCOR computer code manuals (Report no. NUREG/CR-6119). Washington (DC): Division of Systems Technology, Office of Nuclear Regulatory Research, US Nuclear Regulatory Commission; 1998.
- Kmetyk L. MELCOR 1.8.1 assessment: ACRR source term experiments ST-1/ST-2. Albuquerque (NM): Sandia National Laboratory; 1992.
- Carbajo JJ. Severe accident source term characteristics for selected Peach Bottom sequences predicted by the MELCOR Code. Washington (DC): Nuclear Regulatory Commission; 1993.
- Ahn K-I, Park S-Y. Development of a risk-informed accident diagnosis and prognosis system to support severe accident management. Nucl Eng Des. 2009;239:2119–2133.
- Park S-Y, Ahn K-I. SAMEX: a severe accident management support expert. Ann Nucl Energy. 2010;37:1067–1075.
- IAEA. Severe accident management programmes for nuclear power plants. Vienna: International Atomic Energy Agency; 2009.
- Kim HC. Development of regulatory assessment technology for the response capability of NPPs against accidents due to extreme natural hazards. Daejeon: Korea Institute of Nuclear Safety; 2013.
- Ha JJ, Jin YH. Development of accident management guidance for Korean standard nuclear power plant (Report no. KAERI/RR-1939). Daejeon: Korea Atomic Energy Research Institute; 1998.
- IAEA. Development and review of plant specific emergency operating procedures. Vienna: International Atomic Energy Agency; 2006.
- OECD/NEA. In-vessel and ex-vessel hydrogen sources (Report no. NEA/CSNI/R(2001)15). Paris: OECD/NEA; 2001.