
 ?Mathematical formulae have been encoded as MathML and are displayed in this HTML version using MathJax in order to improve their display. Uncheck the box to turn MathJax off. This feature requires Javascript. Click on a formula to zoom.
ABSTRACT
The present paper aims to investigate the critical heat flux (CHF) characteristics of AP1000 reactor based on the experimental and numerical researches, under normal operation and loop fault conditions, respectively. The differences of flow characteristics in these conditions were analyzed. It indicated that the flow features are very complicated in three dimensions and AP1000 has better self-regulation capability to distribute coolant flow compared to conventional reactors. Under normal operation condition, coolant of two loops is distributed along circumference of the reactor annular channel symmetrically. In case that one of the loops fails suddenly and the coolant is partially lost to total loss, the core flow distribution plate and lower grid plate cannot eliminate uneven flow immediately due to loop failure, also the nonuniformity of reactor coolant flow distribution increases gradually, which leads to the heat transfer deterioration easily. In addition, the reactor core departure from nuclear boiling ratio (DNBR) and CHF does not show a certain linear relation, and the DNBR and CHF of AP1000 are greater than that of conventional reactors which not only improve the reactor thermal efficiency, but also obviously reduce the probability of CHF phenomenon appear.
1. Introduction
AP1000 is a two-loop, 3400 MW Westinghouse-designed advanced pressurized-water reactor (PWR), which has been regarded as the dominating thermal reactor power generating system for a long time due to its passive safety features and economic competitiveness in China [Citation1–Citation3]. At present, there are no mature operational experiences of AP1000 units in the world. Therefore, it is very important to accelerate the process of third-generation nuclear power technology and ensure the safe and stable operation of units.
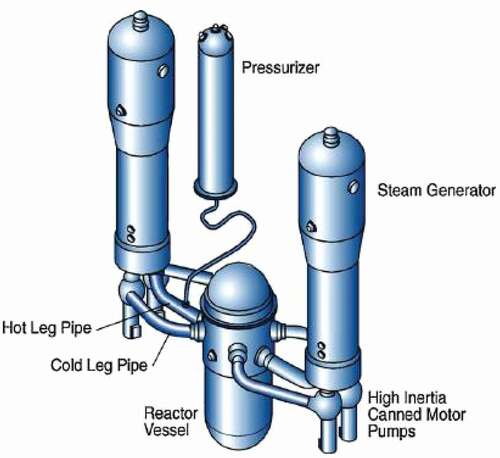
provides a general loop layout of AP1000 reactor, which consists of nuclear reactor vessel (RV), four sets of coolant pump, two sets of steam generator and a pressurizer. As can be seen from the figure, AP1000 has two symmetrical coolant loops relative to conventional three-loop nuclear power plant, thus AP1000 reactor has two outlet nozzles/hot legs instead of three and the axial flow that exits the reactor core has to turn and divide into two flow paths to outflow the reactor [Citation4]. This design change creates different flow field and thermal hydraulic characteristics potentially in AP1000 reactor core. Due to the huge workload, the change progress of flow field under hot state inside the reactor cannot be measured by industrial test. However the flow field of AP1000 reactor core can be reflected in detail using numerical simulation, which has extensively been used in industrial research [Citation5–Citation9]. Meanwhile, relevant document also have shown that, in the process of coolant flowing, properties of numerical simulation are basically similar to practical situation [Citation7,Citation10–Citation12]. For example, Tsai et al. [Citation13] used the RELAP5-3D thermal-hydraulic code to simulate the coolant flow within the water channel of the IVR (in-vessel retention) device, and the heat-removal capability of IVR device in AP1000 nuclear reactor during a core meltdown accident was researched. Giuli et al. [Citation14] modeled the (reactor coolant system (RCS), the secondary circuit and all of the (passive core cooling systems (PCCS), also simulated and analyzed the condition that 10-inch small break loss of coolant accident (LOCA) occurred in cold leg using CESAR, the thermal-hydraulic module of ASTEC. Xie [Citation15] built the numerical model of AP1000 and double-end guillotine of cold leg using SCDAP/RELAP5 4.0, and RCS and PCCS were modeled by RELAP5, and the large-break LOCA (LBLOCA) was simulated.
Figure 1. AP1000 loop layout.
About the simulation of heat transfer and nuclear reactor core, Xu D T et al. [Citation16] studied the thermal hydraulic characteristics of the coolant flowing in SCW (supercritical water), and the heat transfer in a 4-rod bundle was numerically simulated by computational fluid dynamics (CFD). Jimenez et al. [Citation17] developed a 3D model of the geometry for the whole containment building of AP1000 with the CFD code, and analyzed the thermal-hydraulic detailed behavior in building. Liu Y et al. [Citation18] adopted the results of critical heat flux (CHF) experiments in vertical narrow tube with power step to verify the CHF predictions by nonuniform heating model, and the CHF under power step was numerically calculated with the nonuniform heating model of CHF prediction.
To determine the coolant flow pattern in the region of AP1000 reactor core, including the investigation of loop accident and annular channel blocking accident, a CFD model of the flow was created, which required enough detail to capture the hydraulics and heat transfer. In order to further evaluate the safety performance and superiority of AP1000 nuclear reactor, the functional relationship between CHF and departure from nuclear boiling ratio (DNBR) was preliminarily discussed in this study. The comparison between numerical simulation results and industrial test data shows high-degree consistency intend, and hence demonstrates the accuracy of numerical simulation presented here.
2. Physical geometry and numerical models
2.1. Definition and building of the flow domain for calculation
The main aim of this study is to understand the flow features and heat transfer process in AP1000 reactor core. Thereby, the self-regulation capability of primary circuit system under loop fault and local blocking condition of annular channel during the reactor operating was simulated and calculated, and the calculation results can provide the judgment for cause of emergency shutdown and failure under reactor accident condition.
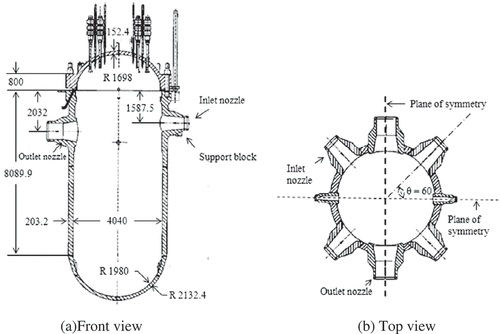
AP1000 nuclear reactor consists of the RV, core barrel, core shroud, upper plenum, downcomer, lower plenum, neutron pad, control rod drive mechanism and reactor core. The coolant flows into the RV from the cold leg, then vertically descends to the lower plenum along the downcomer (annular channel) between core barrel and pressure vessel. Then it passes through the reactor core flow distribution plate, turns at the bottom of the cylinder and reaches the reactor core through the lower grid plate. After heated by 157 group fuel assemblies surrounded by a core shroud, heated water enters the upper plenum through the holes of the upper grid plate, finally the coolant flows out of the RV. As shown in [Citation19], the AP1000 RV is a double-loop cylindrical pressure vessel with four inlet and two outlet nozzle. The central axis of the inlet nozzle is 445.5 mm higher than that of the outlet nozzle. The two safety injection nozzles are neglected in this paper.
Figure 2. Geometric parameters of AP1000 RV outer profile, mm.
2.2. Mesh generation methodologies
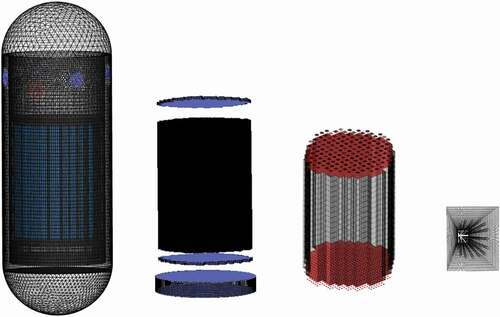
As mentioned above, the full-scale three-dimensional reactor model were established based on the AP1000 nuclear reactor design drawing, which consisted of reactor core components and whole flow passage. In consideration of the complicated geometry, the pseudo-diffusion influence and the requirements of the computer, the reactor model was meshed by several partitions separately [Citation20]. The upper part of the pressure vessel and the lower plenum were meshed with tetrahedral grid, finer meshes were distributed in the areas around the inlet and outlet nozzle. The mesh quality was greater than 0.3. Due to relatively rapid change of temperature and velocity in the reactor core region, the region were meshed with hexahedral grid dominated, which includes core fuel assemblies, the coolant channels of the grid plate at the core inlet and outlet. The mesh quality was greater than 0.6, and the aspect ratio is 1.2 ~ 10, which meets the requirement that maximum aspect ratio of three-dimensional heat transfer calculation is less than 35:1 [Citation21].
To evaluate mesh sensitivities, the distribution of coolant on the upper grid plate of the reactor core and outlet temperature were selected as research objects. And the mesh cells were getting smaller gradually, analyzing the results of each calculation. With the continuous comparison to last calculation result, as the difference of outlet temperature and outlet velocity between the two calculations were less than 5% [Citation22], the meshes would be adopted to ensure both accuracy and convergence. Total number of the divided meshes for reactor pressure vessel and reactor core is approximately 2.98 × 10⁶, sample plots of the generated meshes are presented in .
Figure 3. Views of the calculation domain mesh.
2.3. Governing equations and turbulence models
In this research, the heat generated in the reactor core was simulated by adding a region-wise distributed volumetric heat source. The average line power density of AP1000 reactor core is 187.7w/cm, and the actual axial line power density is normalized according to the cosine function and the measured axial neutron fluence rate distribution of CPR1000 reactor core which has almost the same structure as AP1000. The heating of the coolant at different positions along the axial direction of core is treated as constant heat flux density.
During the whole numerical simulation process, the flow patterns inside the RV were obtained by solving the steady state, three-dimensional Reynolds-averaged Navier–Stokes equations for incompressible flow. For the turbulent flow, CFD codes provide users with various turbulence models, such as zero-equation model, two-equation model (standard k-ε, RNG k-ε, etc.), Reynolds stress model (RSM) and the large eddy simulation model (LES). The standard k-ε model (it is indicated as k-ε in this paper) was used to model the turbulence in liquid phase. K-ε model is the most common turbulence model, which is extensively applied in numerical simulation of boundary layer flow and pipe flow, and its general formula is presented as follows [Citation21]:
where is the turbulent viscosity coefficient,
is the generating term of turbulent kinetic energy k due to the average velocity gradient and
is the generating term of turbulent kinetic energy k due to buoyancy.
,
,
,
and
are constants, as listed in .
Table 1. Constants value in k-ε model
It is assumed that the coolant flow is fully developed, as the coupled calculation about coolant on the surface of core component and inside the channel is conducted. In addition, the finite volume method and the 2nd order upwind scheme were used to discrete each control formula. With consideration of the omitted item in velocity corrected value equation in SIMPLE algorithm. The SIMPLEC algorithm was used to couple the pressure and velocities, which is one of the improved SIMPLE algorithms. In this algorithm, the obtained and corrected value p’ is suitable relatively, which can accelerate the convergence rate of iteration in the whole velocity field [Citation16].
2.4. Boundary conditions
In order to facilitate the analysis of the calculation results, the region from the reactor inlet pipe to reactor core inlet plate was defined as the inlet channel, and region from reactor core inlet plate to its upper grid plate was defined as central channel, while the region from upper grid plate to reactor outlet was defined as outlet channel. The downcomer, lower plenum and upper plenum were set as fluid domains. The reactor internals (e.g. core barrel, core shroud, RV, etc.) were set as solid domains. The boundaries between different domains were set as interface. In the steady state simulation, total amount of coolant for the reactor remained as 2 × 35,772m3/h and two loops are evenly distributed. The reactor’s four inlets were set as mass flow inlet with 3761 kg/s at 280.7°C (normal operating condition) and the two outlets were set as pressure outlet, and the reactor reference pressure was set to 15.4MPa.
The influence of reactor core flow leakage was ignored in the three-dimensional calculation and the selection of other parameters was strictly consistent with the design conditions. According to the design data of the reactor primary circuit, a large number of parameters are used for simulation calculation, and the characteristic values with relatively high rate of change in the simulation results are selected for analysis. shows detailed thermo-physical property and boundary conditions.
Table 2. Physical property parameter and boundary condition
3. Results and discussions
In the reactor model, X-axis and Z-axis are the diameter of reactor, and the Y-axis is the height of reactor. Meanwhile, the center of the circular section at 900 mm above the lower grid plate was defined as the coordinate origin.
3.1. Validation of the CFD simulation and flow field characteristics
Total amount of coolant for the reactor remained as 2 × 35772m3/h, and two loops are evenly arranged. The absolute pressure and inlet temperature of coolant is 15.5Mpa and 280.7°C, respectively, and that condition is the rated condition.
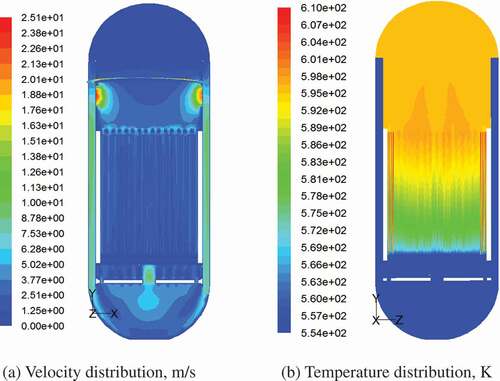
shows the temperature and velocity contours at the section through the reactor inlet and outlet. The coolant temperature rose along the axial position due to the absorption of the heat released from the fuel element when coolant flowed through the reactor core, as shown in . The temperature of coolant at upper region in reactor core was obviously higher than that of the coolant at lower region in the reactor core. The mean temperature at outlet is about 595K with temperature rise of 41K which has a good agreement with the design situation (321.1°C). The results above show the reasonableness and feasibility of the integral reactor model and parameters.
Figure 4. Flow distribution on reactor vertical section. (a) Velocity distribution, m/s (b) Ttmperature distribution, K.
Analyzing the simulation results of reactor flow field, it is found that when the coolant flows through the obstacles, a series of vortices are generated behind them, including transverse vortex (TV) and longitudinal vortex (LV), as shown in . The coolant enters into the reactor via the inlet nozzle, then vertically flow into the annular interlayer channel constructed by the pressure vessel and core barrel with rotations due to the disturbance of neutron pad and male pin that are installed among different loops inside the annular interlayer channel. Meanwhile, because the water flows along vertical direction, TVs inside the annular channel are not clear compared to LVs, inlet water flow of the two loops along internal annular channel is provided with sound uniformity.
After the coolant flows through core inlet plate, it is redistributed along horizontal cross-section due to the spoiler effect of the core inlet plate coolant holes, also the flow field has a great change before entering into lower grid plate of the reactor core. Under different coolant flows, there are certain differences in distribution of water flow entering into the lower grid plate of core [Citation23]. At the lower region of reactor, LVs in the central and surrounding are much clear, and flow distribution at upper grid plate is more uniform compared to the distributing characteristics along the horizontal cross-section at the lower grid plate.
3.2. Distribution analysis on flow field of reactor
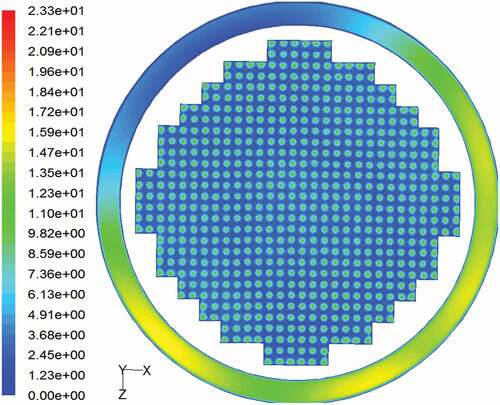
Reactor remains to run under rated condition. shows the coolant distribution of lower grid plate inlet section. In addition, there are 157 × 4 inlet holes totally at the lower grid plate. All the coolant entering the core through the regular inlet holes at lower grid plate. It can be observed from calculation results that the flow rate is not evenly distributed at horizontal cross-section of the lower grid plate, the water flow velocity is much rapid in surrounding and central regions, and its actual flow is larger. Compared with , it can be found that the water flow entering into the core is not uniformly distributed in the lower region of reactor, due to the influence of loop structure and disturbance of internal components. After the coolant flowing into the core, the coolant distribution tends to be more uniform and symmetrical along horizontal cross-section at upper grid plate region under the common action of fuel assemblies and other components inside the reactor. Also, the coolant flow rate in the blocked area is small.
Figure 5. Velocity distribution of reactor core, m/s. (a) Lower grid plate inlet section (b) upper grid plate outlet section.
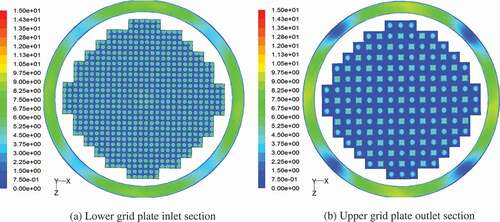
At this moment, one comparison between presented results and other similar CFD analyses for conventional nuclear power plant, in which there are three inlet nozzles/cold legs and three outlet nozzles/hot legs, is possible [Citation24]. The comparison indicates that the flow features are very complicated in three dimensions, core inlet and outlet flow distribution of AP1000 reactor is more uniform, and AP1000 has better self-regulation capability to distribute flow in the reactor core region than conventional reactor.
Compared to conventional nuclear power plants, AP1000 coolant system consists of two loops which are symmetrically arranged relative to the RV. Each loop includes two cold legs and one hot leg which is located in the middle of the two cold legs. Also AP1000 reactor core region adopts four neutron pads which are arranged symmetrically on the outside of core barrel corresponding to two loops instead of previous unsymmetrical thermal shielding. The above-mentioned comparison results illustrate that the design is more reasonable for the uniform flow of coolant and the design difference creates a different flow field in the RV. To a certain extent, the distribution uniformity of coolant flowing through the core is enhanced.
3.3. Loop fault accident analysis
When two pumps of one loop fail suddenly, the coolant flow of that loop begins to decrease gradually. Finally, the coolant flow is completely lost. This indicates that total volume flow rate of reactor coolant reduces to 50%, namely 35772 m3/h.
To simulate the loop fault accident condition which means the coolant flow of one loop is completely lost in this paper, two inlet of the faulty loop were set as mass flow inlet with 0 kg/s and the other two inlets were set as mass flow inlet with 3761 kg/s at 280.7°C (mean value of inlet). Meanwhile, two outlets were set as pressure outlet and the reference pressure was set to 15.4 MPa. All wall boundaries were set as a nonslip wall boundary.
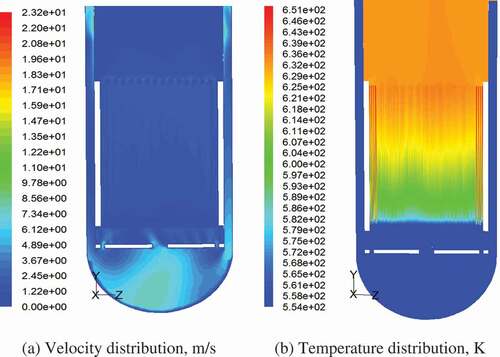
and show the flow features at the vertical section of the reactor under the condition of loop fault. And it can be observed from the calculation results that the radial velocity of the core began to appear uneven and water flow in the lower plenum and the inlet of lower grid plate possess much clearer nonuniformity, and the velocity of coolant in the center and surrounding regions is larger compared to upper grid plate. This uneven distribution caused by loss of coolant could not be eliminated through core inlet plate and core lower grid plate, although they have certain adjusting ability on nonuniformity of water flow. At the same time, the overall temperature increased significantly and the maximum local temperature reaches 648 K due to the insufficient cooling for partial regions of core. The reactor core outlet temperature is 643 K which has exceeded the saturation temperature with 617.95 K and the maximum limit temperature of the outer surface of the fuel rod cladding with 623 K to result in the heat transfer deterioration. So the reactor should be shut down in emergency in order to avoid the accident of core damage under this condition.
Figure 6. Flow distribution of loop fault. (a) Velocity distribution, m/s (b) temperature distribution, K.
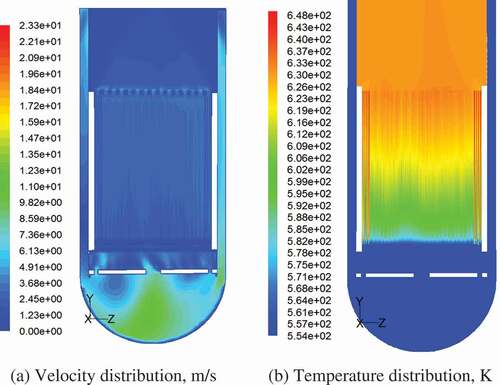
Figure 7. Velocity distribution at the lower grid plate inlet section of loop fault, m/s.
The simulation results also denote that the neutron pad should be designed in the middle of annular channel. Under normal running condition, the water flow in two loops is uniformly distributed along circumference of the core, and water flow tends to be small in lower parts of the blocked flow area.
3.4. Annular channel blocking accident analysis
During the actual operation of the reactor, there is a certain chance that the annular channel will be blocked (such as boron crystallization, filter shedding, etc.). In this study, it is assumed that annular channel is blocked by boron crystallization at the intermediate channel of two inlet nozzles of each loop along the circumference symmetrically. Under the rated condition, the accident of annular channel blocked uniformly by sundries is simulated. The water flow of core area is relatively uniform. It is attributed to the symmetrical reactor structure and the flow regulation capacity of core flow distribution plate and lower grid plate. In addition, although two loops form into separated passages mutually, flow distribution uniformity of the coolant at the outlets of annular channel increases due to coolant pumps circulating the fluid continuously.
Keep annular channel blocking accident constant, the 1oop fault condition (50% flow loss) is simulated. As shown in , the nonuniformity of coolant distribution is strengthened and the overall temperature is higher than only 50% flow loss condition (). The lower plenum is filled with different sized LVs, and the flow distribution of annular channel is extremely uneven. It illustrates that boron crystallization obstructs the normal flow of coolant and exacerbates the uneven distribution of coolant in the lower plenum. Under the dual influence of boron crystallization and loop fault, the maximum core temperature reaches 651K which can aggravate the degree and probability of core damage.
Figure 8. Flow distribution of annular channel blocking accident (a) Velocity distribution, m/s (b) temperature distribution, K.
3.5. Characteristic analysis of CHF and DNBR
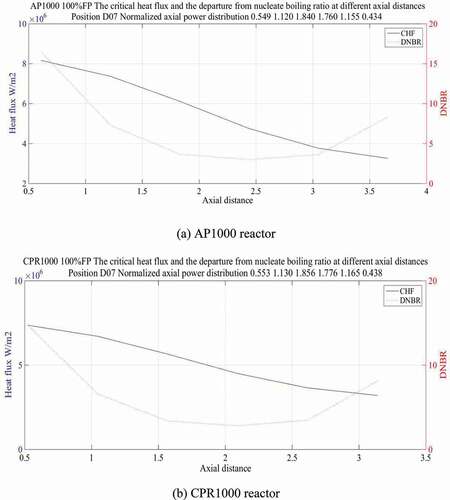
In order to further evaluate the safety performance of AP1000 reactor and compare with the simulation results, this study considered two important parameters, CHF and DNBR, which are the basis for reactor core thermal hydraulic design and safety analysis. The CHF correction directly determine the limits and accuracy of DNBR calculation. Therefore, seeking the distribution trends of CHF and DNBR along the reactor core has important guidance for the core optimization design.
The thermal hydraulic calculation programs of AP1000 reactor and prototype reactor were developed with MATLAB [Citation25], by which CHF and DNBR calculation of AP1000 and prototype reactor were carried out. The calculation results of the two reactors in 100% nuclear power were shown in . In the plot, the horizontal axis X is the axial distance, the left vertical axis Y1 is the CHF, and the right vertical axis Y2 is the DNBR. The dotted line indicates the value of DNBR. It can be learned that the DNBR is not a simple linear relationship with the CHF. The DNBR values decrease in the initial stage, then increase with the growth of axial distance and generally tend to be large at both ends but small in the middle. The minimum value of DNBR appears at the position slightly above the center of control body where the fuel rods are weakest, indicating that the actual heat flux is larger in the area with large nuclear power, and the larger actual heat flux leads to the temperature rise is faster [Citation26], which is highly consistent with the tendency of simulation result. The Comparison between AP1000 reactor and CPR1000 reactor reveals that the CHF and DNBR of each control body of AP1000 reactor core heat transfer channel are greater than that of CPR1000, which not only improves the overall thermal efficiency, but also obviously reduces the probability of CHF phenomenon appear.
Figure 9. Comparison of CHF and DNBR between AP1000 reactor and CPR1000 reactor. (a) AP1000 reactor (b) CPR1000 reactor.
4. The industrial test research
The test research results of coolant temperature rise in rod bundles channel of AP1000 and CPR1000 are shown in , and shows the main design parameters of AP1000 and CPR1000 reactor. The variation trend of coolant temperature along the axis in three different flow rate conditions, namely 50%, 75% and 100% flow rate [Citation27], could be obtained by analyzing the results. As is shown in , when the LOCA occurred, the outlet coolant temperature of rod bundles channel increased with the loss of flow rate, but the outlet temperature did not change linearly with the loss of flow rate.
Table 3. Main design parameters of AP1000 and CPR1000 reactor
Figure 10. Comparison of AP1000 and CPR1000 rod bundles channel test. (a) Temperature rise trends of AP1000 (b) temperature rise trends of CPR1000.
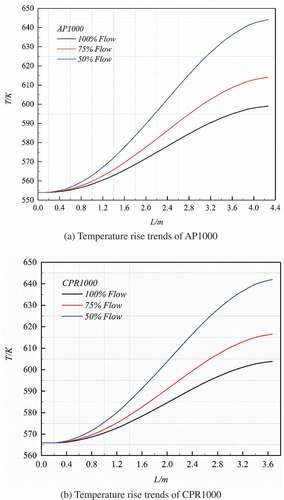
For the AP1000 rod bundles channel, when the coolant flow rate was reduced from 100% to 75%, the core outlet temperature of coolant is 613 K while that of conventional nuclear power unit is 617 K. In the actual operation of the reactor, the core outlet temperature is at least 10 K lower than the outer surface temperature of the fuel rod cladding with the maximum limit value is 623 K, when the heat transfer temperature difference is less than 10 K can lead to the zirconium water reaction. Thus, the reactor should be shut down in order to avoid the accident of fuel rod damage under this condition. When the coolant flow rate was reduced to 50%, the outlet temperature was about 645 K with temperature increase of 45 K relative to rated condition which has a good agreement with CFD three-dimensional simulation results above and the deviation between simulation and test research results is less than 5%. Meanwhile, comparing the temperature rise cures of AP1000 and CPR1000, although AP1000 has greater core thermal power and longer fuel active zone height, the lower coolant inlet temperature of AP1000 reactor can make the outlet temperature is still lower than that of CPR1000 reactor under rated condition and the accident of a small-scale loss of flow. Therefore, AP1000 reactor is less prone to heat transfer deterioration and has greater safety margin under same operating pressure.
At the present stage, there is no actual data of AP1000 overall reactor operation, and the coolant temperature rise test in rod bundles channel cannot completely reflect the actual operation situation of AP1000 reactor. In order to further verify the accuracy of the AP1000 three-dimensional heat transfer coupling simulation results, the same numerical simulation method is used to analyze the heat transfer characteristics of CPR1000 reactor core which has almost the same structure as AP1000. Then the CPR1000 simulation results are compared with the actual reactor physical test to prove the feasibility of the simulation method and fully illustrate the accuracy of the above AP1000 numerical simulation results.
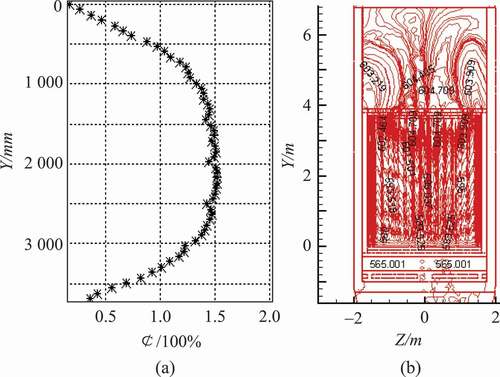
shows the actual axial neutron fluence rate distribution of CPR1000 reactor core in the physical test which can derive the axial nuclear power of the measurement channel, and then expand the nuclear power of the entire core channel according to the least squares method. The value of nuclear power distribution was used in the physical calculation model of whole CPR1000 reactor and the three-dimensional steady state numerical simulation for enthalpy increment characteristics of reactor was carried out under normal operating condition. The simulation result was read through TECPLOT and the reactor axial enthalpy increment characteristic is shown in [Citation28]. It can be seen that, when the coolant temperature of reactor inlet is 565K, the reactor outlet temperature is 603K, and the overall temperature rise is 38K, which has a deviation of 1K from the design value. Combined with the simulation results, it can be seen from the comparison of and that the hot channel has a certain correlation with the nuclear power, and hot spot is influenced by the coolant temperature, pressure, flow velocity and heat flux. There is a certain deviation between nuclear power peak distribution and hot spot distribution.
Figure 11. Distribution of the (a) neutron fluence rate and (b) reactor core temperature on CPR1000.
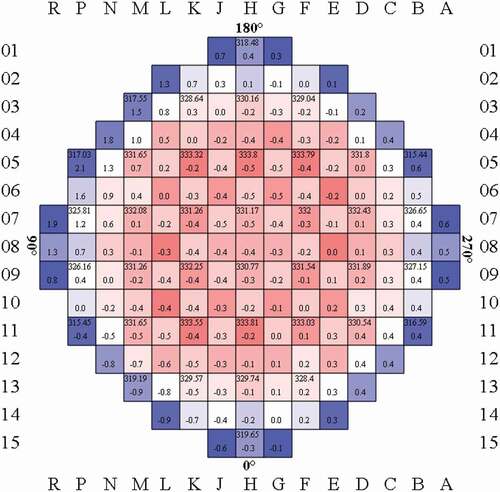
The measured core outlet temperature distribution of CPR1000 is shown in . Thirty-eight measuring points were set at the core outlet and the corresponding temperature values at the outlet of 38 fuel assemblies can be read out. Comparing the measuring point values of the same fuel assemblies with the simulated calculation results, it can be found that a good agreement between them with the maximum deviation less than 5% which demonstrates that the CFD method can accurately simulate the temperature rise characteristic trend of the reactor core. On the other hand, the accuracy of AP1000 three-dimensional heat transfer coupling simulation results is verified.
Figure 12. Reactor core outlet temperature field distribution.
5. Conclusions
In the present study, the detailed CFD analysis of flow characteristics in AP1000 reactor under different working conditions was conducted by construction of full-scale three-dimensional numerical model. The accuracy of numerical simulation results has been verified from various angles, which include numerical verification, the rod bundles channel test and the actual reactor physical test. In order to further evaluate the safety performance of AP1000 reactor, the calculation of CHF and DNBR was carried out. The following conclusions are drawn:
The core flow distribution plate and lower grid plate play certain roles in adjusting loop flow deviation. When the coolant flows through those, the coolant flow can be redistributed significantly.
Under normal operation condition, coolant of two loops is distributed symmetrically along the annular channel. AP1000 reactor has better self-regulation capability to distribute flow than conventional reactor due to its reasonable design.
In case that a loop fails suddenly, with the coolant from partial losses to total losses, the distribution nonuniformity of water flow for reactor core will increase sharply, and the flow distribution plate and lower grid plate cannot eliminate uneven flow due to a large loss of coolant which leads to the heat transfer deterioration easily. Under the dual influence of loop fault and annular channel blocking, the uneven distribution of coolant is more serious.
There is not a linear relationship between DNBR and CHF, and the DNBR decreases firstly then increases with the growth of axial distance of fuel rod. The CHF and DNBR of AP1000 reactor core heat transfer channel are greater than that of prototype reactor. It indicates that the actual security features of AP1000 have been improved.
The numerical simulation can be used as a supplement to the actual physical test. The actual test can be used as the input value of the simulation and check the calculation results.
Acknowledgment
This work was supported by China National Nuclear Corporation (CNNC) thermal hydraulic key laboratory fund project [20130901].
Disclosure statement
No potential conflict of interest was reported by the authors.
References
- Li S, He J, Wan J, et al. Dynamic modeling of AP1000 steam generator for control system design and simulation. Ann Nucl Energy. 2017;109:648–657.
- Zhao F, Zhao C, Bo H. Numerical investigation of the separation performance of full-scale AP1000 steam-water separator. Ann Nucl Energy. 2018;111:204–223.
- Wang WW, Su GH, Tian WX, et al. Research on thermal hydraulic behavior of small-break LOCAs in AP1000. Nucl Eng Des. 2013;263(1):380–394.
- Kao MT, Wu CY, Chieng CC, et al. CFD analysis of PWR reactor vessel upper plenum sections: flow simulation in control rods guide tubes. 18th International Conference on Nuclear Engineering, Xi'an, China. American Society of Mechanical Engineers; 2010. p. 499–506.
- Patankar SV. Numerical heat transfer and fluid flow. Washington (DC): Hemisphere; 1980. p. 140.
- Sohankar A, Davidson L. Effect of inclined vortex generators on heat transfer enhancement in a three-dimensional channel. Numer Heat Tr, Part A: Appl. 2001;39(5):433–448.
- Islam MS, Hino R, Haga K, et al. Experimental study on heat transfer augmentation for high heat flux removal in rib-roughened narrow channels. J Nucl Sci Technol. 1998;35(9):671–678.
- Xiao-Hang WU, Xiao-Hua FU. Effect of structure and thermal properties of the electrically heated rod on transient thermal-hydraulic experiment. Chin J Nucl Sci Eng. 2004;24(3):235–241.
- Fujun WANG. Analysis of computational fluid dynamics-principle and application of CFD. Beijing: Tsinghua University Press; 2004. p. 24–158.
- Oka YK. Design concept of once-through cycle super-critical pressure light coolant cooled reactors. Proc of SCR-2000. Tokyo: International Atomic Energy Agency (IAEA); 2000 Nov 6–8. p. 1–22.
- Tamagno P, Jean CDS, Bouland O, et al. From low- to high-energy nuclear data evaluations. Eur Phys J. 2015;51(12):1–24.
- Jeong HY, Ha KS, Kwon YM, et al. A dominant geometrical parameter affecting the turbulent mixing rate in rod bundles. Heat Mass Tr. 2007;50:908–918.
- Tsai FJ, Min L, Liu HC. Simulation of the in-vessel retention device heat-removal capability of AP-1000 during a core meltdown accident. Ann Nucl Energy. 2016;99:455–463.
- Giuli MD, Sumini M, Rosa FD. Modeling of AP1000 and simulation of 10-inch cold leg small break LOCA using the CESAR thermal-hydraulic module of ASTEC. Prog Nucl Energy. 2015;83(3):387–397.
- Xie H. Numerical simulation of AP1000 LBLOCA with SCDAP/RELAP 4.0 code. J Nucl Sci Technol. 2017;54(9):1–8.
- Xu DT, Li HB, Yang J, et al. Numerical simulation of heat transfer to SCW in 4-rod bundle. At Energy Sci Technol. 2015;49(2):292–296.
- Jimenez G, Bocanegra R, Fernandez K, et al.. Development of a PWR-W and an AP1000 (R) containment building 3D model with a CFD code for best-estimate thermal-hydraulic analysis. 2014 22nd International Conference on Nuclear Engineering, Prague, Czech Republic. American Society of Mechanical Engineers, 2014. V004T10A015 – V 0 04T10A015.
- Liu Y, Zhao D, Liu W, et al. Theoretical study on critical heat flux in vertical narrow tube with axial power step. Nucl Power Eng. 2016;4:6–10.
- Liu R, Huang M, Peng Y, et al. Analysis for crack growth regularities in the nozzle-cylinder intersection area of reactor pressure vessel. Ann Nucl Energy. 2018;112:779–793.
- Mohanty S, Soppet WK, Majumdar S, et al. Full-scale 3-D finite element modeling of a two-loop pressurized water reactor for heat transfer, thermal–mechanical cyclic stress analysis, and environmental fatigue life estimation. Nucl Eng Des. 2015;295:374–387.
- Lee KB, Jang HC. A numerical prediction on the turbulent flow in closely spaced bare rod arrays by a nonlinear k-ε model. Nucl Eng Des. 1997;172(3):351–357.
- Fujun W. Analysis of computational fluid dynamics principle and application of CFD. Beijing: Tsinghua University Press;2004 24–158. in Chinese.
- Sun L, Peng M, Xia G, et al. Numerical study on coolant flow distribution at the core inlet for an integral pressurized water reactor. Nucl Eng Technol. 2016;49(1):71–81.
- Chao Y, Zhai Y, Yang L, et al. Thermal hydraulics characteristics simulation of CPR1000 using CFD method. 21st International Conference on Nuclear Engineering, Chengdu, China. American Society of Mechanical Engineers, 2013. V004T09A107-V004T09A107.
- Jianquan L, Jingda S, Liuliu Z, et al. DNBR characteristics research based on the MATLAB on AP1000 nuclear power unit reactor. J Shanghai Univ Elec Power. 2015;31(6):505–510. in Chinese.
- Jianquan L, Jingda S, Jiguo Z, et al. CHF characteristic analysis of 1000 MW nuclear power plant reactor based on MATLAB. J Shanghai Univ Elec Power. 2018;31(5):245–250. in Chinese.
- Jo SW, Yong KL, Jo JC, Numerical simulation of the transient phase change heat transfer in a pressurized water reactor core during a loss-of-coolant accident, ASME 2011 Pressure Vessels and Piping Conference Maryland, USA. American Society of Mechanical Engineers, 2011. p. 335–341.
- Jianquan LIU, Qijun HUO, Tao ZHOU, et al. Simulation study of enthalpy gain characteristics on nuclear power 1000 MW unit pressurized water reactor loop flow deviation. Proc CSEE. 2015;35(16):4139–4146. in Chinese.