
ABSTRACT
We present maps and digital data of the surface manifestation of liquefaction for the two major events during the 2010–2011 Canterbury earthquake sequence, the 2010 Darfield and the 2011 Christchurch earthquakes, in order to show liquefaction extent. Maps include detailed interpretation of aerial photograph mosaics and satellite images captured immediately following each event, and incorporate ground-based surveys of liquefaction occurrences. Evidence of liquefaction includes predominantly silt to fine sand and/or water ejected to the ground surface, and the presence of lateral spreading cracks (with or without ejected sediment). Liquefaction appears to be related to recent alluvial systems, and is more prevalent adjacent to existing waterways and in abandoned stream channels, where young, normally consolidated and poorly compacted sediments are water-saturated. The digital data are available for download in standard geographic information system (GIS) formats, and should provide a reference for future regional scale liquefaction studies.
Introduction
Strong ground shaking during the 2010–2011 Canterbury earthquake sequence resulted in extensive and repeated liquefaction of susceptible sediments underlying parts of the eastern Canterbury Plains. For high liquefaction potential, sediments typically need to be: 1. loose and young (often Holocene in age); 2. fine-grained, cohesionless coarse silt to sand; and 3. water-saturated. Depth is also a factor, with the surface manifestations of liquefaction typically associated with liquefiable sediments in the upper few metres (van Ballegooy et al. Citation2014). During earthquake shaking, grains within a loose sand matrix become rearranged and are compacted under an overburden load (Youd & Idriss Citation2001). During this cyclical process, sediment loses strength due to a rapid rise in pore water pressure which, if sufficiently high, may exceed grain contact stresses, allowing the sediment to temporarily flow (i.e. liquefy). If the pressurised water is able to escape to the ground surface, e.g. through cracks, it can take silt and sand (and even gravel) with it, forming sand boils and causing surface flooding. The expulsion of water and sediment causes a volume decrease, and subsidence of the overlying material may result (Hughes et al. Citation2015). Lateral spreading can also occur, particularly close to waterways, where there is usually a high water table and the softest and youngest deposits commonly dip down towards the river. This is manifest as cracking and differential settlement of the affected ground.
After the major events in the 2010–2011 Canterbury earthquake sequence, airborne light detection and ranging (LiDAR) and satellite images were acquired to better assess the extent of damage to the built environment. These images have been essential for understanding the extent of liquefaction relating to these events (this study), but also for further research into understanding the controlling factors of the liquefaction process (Bastin et al. Citation2015; Villamor et al. Citation2016). These datasets provide an invaluable opportunity to document the extent and distribution of liquefaction for two historical events that were extremely well monitored by an extensive array of permanent and temporary instruments recording near-source ground accelerations and broadband waveforms (Bannister & Gledhill Citation2012).
Peak ground accelerations (PGAs) during the September 2010 Darfield earthquake were in the range of 0.2–0.3 g over wide parts of the plains and > 1 g near the Greendale Fault. Consequently, liquefaction occurrences were widespread, but generally restricted to areas adjacent to waterways, affecting the most susceptible materials. PGA values in the range of 0.3–0.6 g (locally exceeding 2 g) during the February 2011 Christchurch earthquake resulted in widespread liquefaction in Christchurch City and also many areas that liquefied previously in the Darfield event.
In this paper, we present maps and digital geographic information system (GIS) data of the extent of liquefaction caused by the September 2010 Darfield and February 2011 Christchurch earthquakes. Mapping is based on evidence of surface deformation (cracking) and sedimentation (ejecta), but no classification of severity has been attempted herein. We also map large areas of surface flooding – particularly for the 2010 Darfield event – but it is unclear how much of this flooding was caused by ground shaking and how much was a result of a very wet winter. These maps are intended to be used as an aid for understanding the extent of liquefaction induced in the 2010–2011 earthquakes in a regional context, but not for site specific geotechnical purposes.
Geologic overview
The Canterbury Plains () are a wide swath of coalesced alluvial fans and floodplains formed from sediment eroded from the Southern Alps. Inland, rivers have incised deep gorges into the plains but, towards the coast, incision diminishes and the rivers pass onto active or recently abandoned Holocene floodplains. Abandoned channels are filled with suspended-load sediments consisting of silt and fine sand, and peat. Bordering the coastline, sediments beneath the plains (including beneath Christchurch City) include fine-grained, marine and marginal marine sands and silts interbedded with coarser alluvial outwash gravels (Brown & Weeber Citation1992; Forsyth et al. Citation2008). Groundwater systems beneath the plains include shallow, unconfined aquifers, typically with water tables at depths of < 20 m, and deeper confined aquifers (Brown Citation2001). These deeper confined aquifers typically occur closer to the coast, where gravels are interbedded with fine-grained sediments, and positive artesian pressures are common (Cox et al. Citation2012).
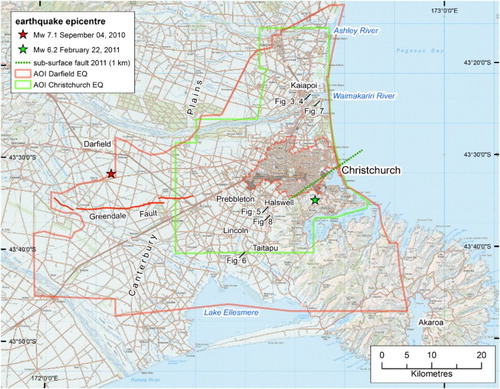
Figure 1. Overview of the Christchurch area, showing the epicentres of the Darfield and Christchurch earthquakes (stars), and the areas of interest (AOI) for which we have mapped the effects of liquefaction. Note that the central city area (dashed outline) was mapped on the ground by The University of Canterbury and Tonkin & Taylor, not from aerial image interpretation. Surface trace of the Greendale Fault is from Langridge et al. (Citation2016) and sub-surface fault (green dashed line, location of dipping fault plane as projected to within c. 1 km of the ground surface) is from http://www.gns.cri.nz/Home/Our-Science/Natural-Hazards/Recent-Events/Canterbury-quake/Hidden-fault. Earthquake epicentres are from GeoNet and background map is LINZ Topo250.
The 4 September 2010 (MW7.1) Darfield earthquake was accompanied by surface rupture of the previously unknown Greendale Fault (; Quigley et al. Citation2010). The epicentre was located beneath the central Canterbury Plains, c. 40 km to the west of Christchurch City and near the town of Darfield. Ground shaking during the Darfield earthquake reached PGA values of > 1.0 g near the Greendale Fault and 0.2–0.3 g over much of the wider Christchurch area (Cousins & McVerry Citation2010; Cubrinovski & Green Citation2010), causing widespread land damage due to liquefaction. Immediately following the Darfield earthquake, digital satellite images and aerial photography were obtained for the wider Canterbury region, covering the area affected by liquefaction. Examination of the images confirmed the presence of widespread liquefaction in rural areas, in the Christchurch urban area (near the Avon River), and at Kaiapoi. GNS Science (GNS) was tasked by Environment Canterbury (ECan) to produce a map and GIS layer of rural areas affected by liquefaction during the Darfield earthquake (Brackley et al. Citation2012; this paper, Dataset S1). Observations of surface liquefaction and lateral spreading in the main urban residential areas affected by liquefaction were also digitised by GNS, and were mapped on the ground by the University of Canterbury, Beca Ltd and by Tonkin & Taylor Ltd on behalf of the Earthquake Commission (EQC; Canterbury Geotechnical Database Citation2013). Data from Lincoln University (Almond et al. Citation2010) and Geotech Consulting Ltd. were also incorporated into the mapping.
The 22 February 2011 (MW6.2) Christchurch earthquake struck directly beneath Christchurch City. Although of smaller magnitude than the Darfield earthquake, the Christchurch earthquake caused more substantial damage in northern and eastern Christchurch (Cubrinovski et al. Citation2011b), partly because of its close proximity to the city, but also because it was directly beneath the liquefaction-prone land. Only moderate amounts of liquefaction occurred in rural areas. Recorded PGA values exceeded 2 g near the epicentre and were > 0.6 g over much of the central and eastern suburbs of Christchurch (Fry et al. Citation2011; Kaiser et al. Citation2012). After the acquisition of new aerial photographs and satellite images, liquefaction mapping was undertaken by ECan/GNS in the same manner as for the Darfield earthquake. Ground-based mapping of liquefaction across the Christchurch urban area (Dataset S2) was again undertaken by Tonkin & Taylor (Canterbury Geotechnical Database Citation2013), and data were also collected by Geotech Consulting Ltd, Lincoln University and the University of Canterbury (Cubrinovski et al. Citation2011a).
GIS mapping of liquefaction from aerial imagery
From the newly acquired imagery (), we visually assessed, interpreted and captured ground surface features associated with liquefaction (and related flooding/sedimentation) using ArcMap GIS software. Many of the mapping team had undertaken on-the-ground liquefaction mapping immediately after the Darfield earthquake, and this experience greatly assisted the on-screen mapping process. The scale of mapping depended on the resolution of the images, but was generally in the order of 1:1000 for satellite images and 1:500 for very high-resolution (10 cm pixel resolution) aerial photos (see and for details of images and their coverage). Several pre-event images from multiple dates were also used to check whether features suspected as being related to liquefaction had formed prior to the earthquakes (and thus were not liquefaction related). Colour images were much more informative than black and white for identifying features on the ground; however, for some areas (e.g. north of Kaiapoi), only black and white images were available. In general, images with pixel resolutions coarser than 1 m did not have enough detail for identifying liquefaction damage. Although not yet fully functional, many of these images will eventually be made available from GNS Science through the Dataset Catalogue portal (http://www.gns.cri.nz/Home/Products/Databases/GNS-Science-Dataset-Catalogue).
Figure 2. Areas covered by various images used in the analysis. See for image details. Background map is LINZ Topo250.
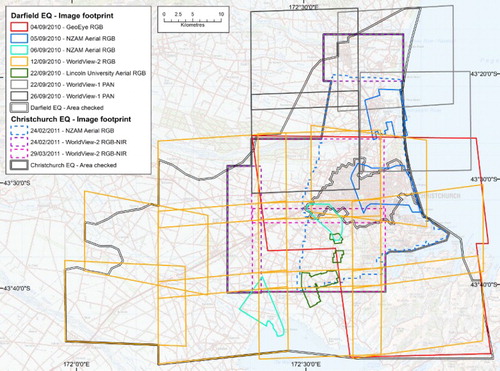
Table 1. Details of images used in this analysis.
Specific areas (polygons) affected by liquefaction, sedimentation and flooding were drawn manually within the GIS (Datasets S1 and S2). At the time of digitising, each polygon was assigned descriptive information to various attribute fields, including the appearance of the mapped feature (e.g. shape, colour, texture), the image source and the initials of the person who mapped the polygon (). Areas of surface sedimentation that could not directly be related to a liquefaction source were attributed as ‘flooding – sediment’, rather than ‘liquefaction’. Large areas of surface water were also digitised, especially for the 2010 Darfield event. However, we could not be certain that the surface flooding was induced by ground shaking, or if it was due to there being a very wet winter leading up to the event.
Table 2. Attributes assigned to polygons at the time of digitising.
Additional to the mapping interpreted from aerial imagery, the maps presented here and in Datasets S1 and S2 incorporate ground-based liquefaction mapping undertaken in the months following each of the main events. The methodology for this ground-based mapping approach is outlined in van Ballegooy et al. (Citation2014).
Examples of aerial imagery used in mapping extent of liquefaction
Examples of the aerial images used to identify and map the liquefaction are presented in –. These include ad hoc aerial photograph mosaics flown by New Zealand Aerial Mapping (NZAM) and Lincoln University, and various satellite images collected in the days following the events (see and ). Coordinates for all image centres are given in New Zealand Transverse Mercator (NZTM) projection.
Figure 3. Liquefaction (sand boils, cracking/lateral spread and fissures) east of Kaiapoi, September 2010. The alignment of sand boils and fissures (grey sediment/ejecta) relates to an in-filled former channel of the Waimakariri River (Wotherspoon et al. Citation2012). Image is NZAM 05/09/2010; centre of view approximately 1573200, 5195800 (NZTM). Rectangle indicates location of detail shown in .
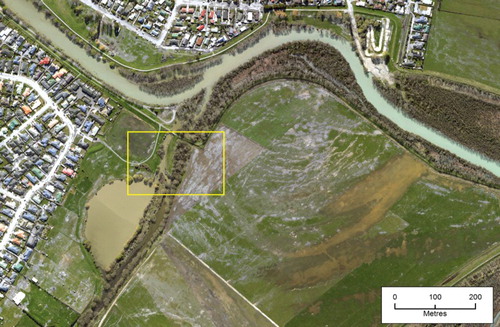
Figure 4. Part of (boxed area) viewed at approximately full image resolution reveals details of the features being mapped.
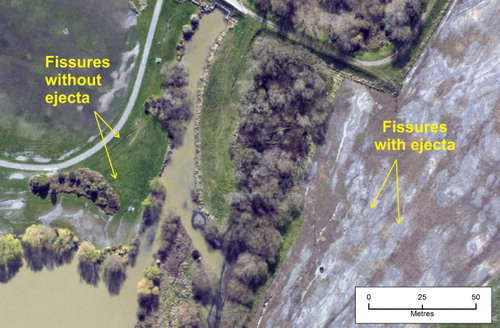
Figure 5. Liquefaction at Rawhiti, south of Halswell, September 2010. Damage includes cracking/lateral spread of the road, and sand boils and flooding (including sedimentation) in the paddocks (image GeoEye 04/09/2010; centre of view approximately 1564800, 5173000).
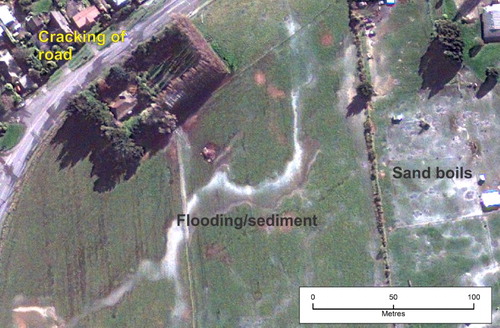
Figure 6. Sand boils and surface flooding across Carters Road, southwest of Taitapu, September 2010 (image WorldView 12/09/2010; centre of view approximately 1560000, 5164000). Note the en-echelon pattern of short fissure segments that merge to form longer contiguous features (e.g. arrows).
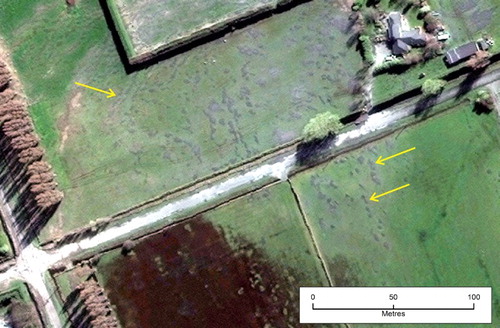
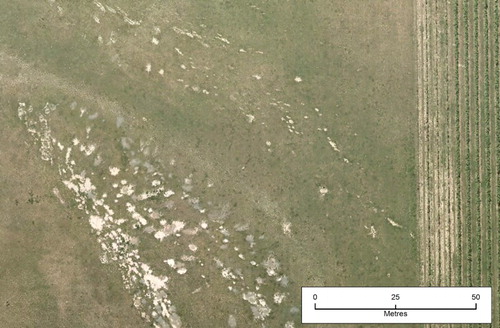
Figure 7. Liquefaction adjacent to the Styx River, west of Brooklands, February 2011. Note the alignment of sand boils parallel to the river margin (arrowed). This area was also affected in September 2010 (image NZAM 24/02/2011; centre of view approximately 1574970, 5194550).
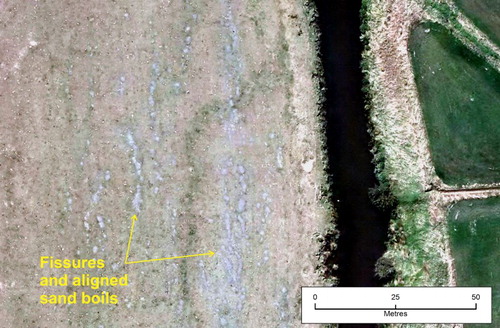
Figure 8. New (darker grey/wet; post February 2011 earthquake) and old (paler grey/dry; pre-February 2011) sand boils west of Lansdowne, February 2011 (image NZAM 24/02/2011; centre of view approximately 1565000, 5171530). Note: there were other earthquakes/aftershocks that caused localised liquefaction (Quigley et al. Citation2013) that was not mapped separately. The various episodes of liquefaction presented in this figure may represent some of these aftershocks, but by far the most damage occurred during the September 2010 and February 2011 earthquakes. Image capture was not frequent enough to determine a higher temporal resolution of damage.
Levels of certainty
In addition to the information assigned while digitising, each polygon has been attributed with a level of certainty. The CERTAINTY attribute relates to the level of certainty placed on the final FEATURE classification, with four categories: certain, probable, possible and uncertain. This is an overall assessment for the polygon that qualitatively takes into account all internal, external and site visit quality assessments (see below). When displayed in the GIS for research purposes, the CERTAINTY attribute should be used in conjunction with the FEATURE attribute, so that the level of certainty can be visually estimated (see – as examples).
Figure 9. Main area affected by liquefaction from the September 2010 Darfield earthquake. Grey dashed box outlines the area shown on . Note that this map does not display the liquefaction mapping by Tonkin & Taylor – see text for details. See Brackley et al. (Citation2012) and Datasets S1–S2 for full coverage. Epicentre location (black star) is from GeoNet. Background map is LINZ Topo250. Surface geological data from Forsyth et al. (Citation2008) and Heron (Citation2014). This figure includes data extracted from the Canterbury Geotechnical Database (https://canterburygeotechnicaldatabase.projectorbit.com/), which were prepared and/or compiled for the Earthquake Commission (EQC) to assist in assessing insurance claims made under the Earthquake Commission Act 1993 and/or for the Canterbury Earthquake Recovery Authority (CERA). The source maps and data were not intended for any other purpose. EQC, CERA, their data suppliers and their engineers, Tonkin & Taylor, have no liability for any use of the maps and data or for the consequences of any person relying on them in any way.
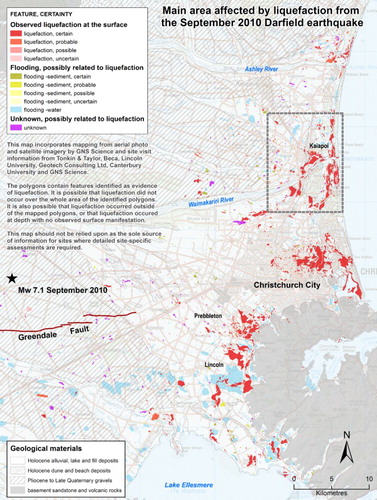
Figure 10. Detailed example of liquefaction mapping in the Kaiapoi area for the September 2010 Darfield earthquake. This map does not display liquefaction mapped by Tonkin & Taylor – see text for details. Note the distribution of observed liquefaction along abandoned river channels and in swampy ground near the coast. See for location. Background map is LINZ Topo50. This figure includes data extracted from the Canterbury Geotechnical Database (https://canterburygeotechnicaldatabase.projectorbit.com/), which were prepared and/or compiled for the Earthquake Commission (EQC) to assist in assessing insurance claims made under the Earthquake Commission Act 1993 and/or for the Canterbury Earthquake Recovery Authority (CERA). The source maps and data were not intended for any other purpose. EQC, CERA, their data suppliers and their engineers, Tonkin & Taylor, have no liability for any use of the maps and data or for the consequences of any person relying on them in any way.
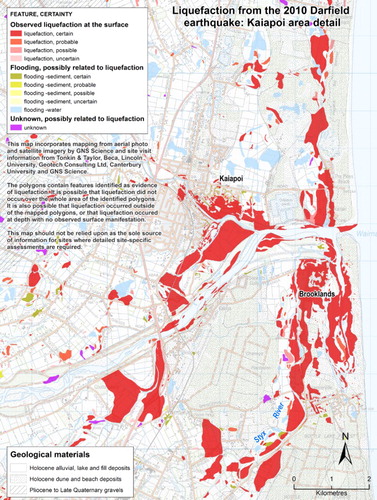
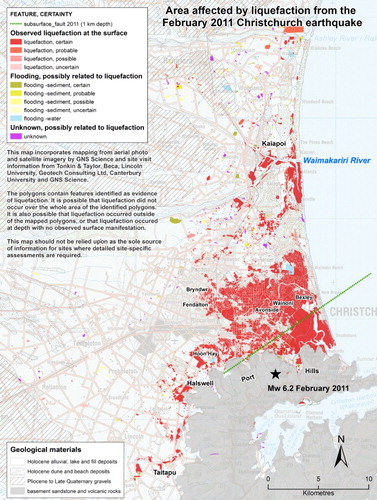
Figure 11. Total mapped area affected by liquefaction from the February 2011 Christchurch earthquake. Comparison with shows much more liquefaction in Christchurch City area and eastern suburbs, reflecting the closer epicentre and therefore locally higher shaking intensities for this event. Some areas were affected by both events. Green dotted line shows projection of dipping subsurface fault plane at c. 1 km depth. Epicentre location (black star) is from GeoNet. Background map is LINZ Topo250. Surface geological data from Forsyth et al. (Citation2008) and Heron (Citation2014). This figure includes data extracted from the Canterbury Geotechnical Database (https://canterburygeotechnicaldatabase.projectorbit.com/), which were prepared and/or compiled for the Earthquake Commission (EQC) to assist in assessing insurance claims made under the Earthquake Commission Act 1993 and/or for the Canterbury Earthquake Recovery Authority (CERA). The source maps and data were not intended for any other purpose. EQC, CERA, their data suppliers and their engineers, Tonkin & Taylor, have no liability for any use of the maps and data or for the consequences of any person relying on them in any way.
Internal quality assurance process
Because of the subjective nature of image interpretation, we undertook some desk-based verification of the digitised polygons. This quality assurance (QA) process involved a check and re-evaluation of every polygon by another member of the team (GNS_QA attribute). This ‘second look’ meant that sometimes the initial classification of the polygon was changed, the reasons for this being recorded in the GNSQA_NOTE attribute. Occasionally, more liquefaction was identified, which was subsequently reviewed by another team member.
External quality assurance process
An external quality assurance review of the liquefaction mapping was undertaken by staff from Landcare Research (Belliss & Lynn Citation2012). Spot check locations were selected by generating a series of random points both within and outside the mapped polygons, and the imagery at those locations was re-examined. The presence or absence of liquefaction and the extent of polygons (and their attributes) were reassessed. The vast majority polygons were assessed as correct; the main differences were almost always due to the scale of mapping, e.g. where a large area of dispersed sand boils or fissures was mapped as a single polygon, but the randomly generated point fell between the liquefaction-related features (or within one screen view width at 1:2000 scale). Where there was disagreement with the original classification, the polygon was re-categorised or the level of certainty downgraded, as necessary. The EXTRNAL_QA attribute identifies which polygons have been assessed by Landcare Research, and to what level, and incorporates any relevant comments from the external QA process.
Site visits
Site inspections were carried out at selected locations (as noted in the SITE_VISIT attribute in the GIS) to assess the interpretations made from the aerial and satellite imagery (Curline Citation2012). In some cases, it was unclear as to whether the mapping of liquefaction was correct, because evidence of liquefaction was no longer preserved by the time field checking was undertaken (either by grass regrowth and/or by agricultural and roading activities). Additionally, a substantial effort was made, usually within a few days following each liquefaction event, to clean up and remove the ejected sand and silt, especially in the residential areas, thus the evidence of liquefaction was not routinely preserved. The CERTAINTY attribute qualitatively takes into account these discrepancies, including site visit details, and provides an overall assessment of the polygon or area mapped.
Site visits were also undertaken by the University of Canterbury, Tonkin & Taylor, Beca and GNS. Tonkin & Taylor’s parcel-based liquefaction data are also included in both GIS layers (attributed as ORIGINATOR). However, because rural areas have relatively large parcels, an entire property was classified as being affected by liquefaction even if only a small part of it was damaged. A clearer understanding of liquefaction processes in these areas (e.g. Halswell) may be gained by only using mapping from aerial imagery, which include generalised natural boundaries of observed liquefaction (see and ). A simplified version of Tonkin & Taylor’s ground-based mapping for the February 2011 event (with abbreviated attribute data) is used for the Christchurch urban area, where mapping from aerial imagery was not carried out by GNS. More detailed data on the observed extent and severity of liquefaction in the main urban areas of Christchurch and Kaiapoi for each of the main earthquakes is available from the Canterbury Geotechnical Database (CGD Citation2013).
Discussion
Liquefaction extent and distribution
Overview maps of areas that were affected by liquefaction (and related sedimentation) are presented in –. More detail, together with site visit and quality assurance information, is provided in a GIS dataset (Datasets S1 and S2). The mapped polygons are colour coded based on the FEATURE attribute, including liquefaction, flooding (sediment and/or water) or unknown (see Appendix 1 for descriptions of these features). In addition, the polygons are colour shaded in conjunction with the CERTAINTY attribute to provide a level of certainty that takes into account all available quality assurance reviews and site visit information.
Evidence of liquefaction from the 2010 MW7.1 Darfield earthquake ( and ) was observed as far north as the Ashley River Lagoon (45 km from the fault trace, or 55 km from the epicentre), and as far south as Lake Ellesmere (30 km from the fault trace, or 45 km from the epicentre). Occurrences of liquefaction were also reported as far east as Akaroa (54 km from the fault trace, or 70 km from the epicentre; Cubrinovski & Green Citation2010; ), but were unable to be independently verified. The main areas of observed liquefaction were the coastal strip either side of the Waimakariri River, to the north and east of the Christchurch central business district (CBD), and the rural land at the western foot of the Port Hills.
For the February 2011 MW6.2 Christchurch earthquake (), a similar distribution of liquefaction was observed to the north and south of Christchurch City. Liquefaction was observed as far north as Waikuku Beach (28 km from the subsurface fault rupture, or 34 km from the epicentre) and as far south as Taitapu (14 km from the subsurface fault rupture, or 18 km from the epicentre). However, urban Christchurch was affected to a much greater degree, with liquefaction observed in many suburbs to the north, east and south of the CBD.
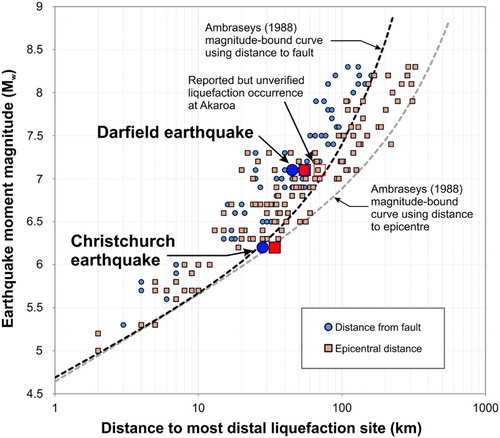
The occurrence of liquefaction in susceptible materials has a strong dependence on earthquake parameters (e.g. magnitude, shaking frequency content) and also maximum epicentral or fault trace distance from sites in which liquefaction develops (Ambraseys Citation1988; Pirrotta et al. Citation2007). Defining empirical relationships between earthquake magnitude and maximum extent of liquefaction is useful to engineers and planners for seismic hazard assessment and mitigation of risk, and also for studies of paleoliquefaction for scaling observed deformation to prehistoric earthquake parameters such as magnitude and location (Maurer et al. Citation2015). Data for the Darfield earthquake plot within previously published bounds for earthquake magnitude versus maximum epicentral or fault distance to liquefaction occurrence (). Data for the Christchurch earthquake, however, sit slightly beyond the ‘limit’ proposed by Ambraseys (Citation1988), probably reflecting the high liquefaction susceptibility of materials beneath the eastern Canterbury Plains. Compared with other published distance–magnitude relationships, both events sit within the fields of proposed farthest distance of liquefaction possible for their recorded magnitudes (Galli Citation2000; Pirrotta et al. Citation2007).
Figure 12. Furthest distance from the epicentre (![]()
Patterns of susceptibility in surficial materials
In general, liquefaction occurred in areas of abandoned or recently in-filled river channels, swampy ground and areas underlain by estuarine deposits (e.g. ). More detailed studies show that the most heavily affected areas appear to be related to near-surface (within a few metres) alluvial features, such as channels and meander loops, filled with loose, unconsolidated sediment (Cubrinovski et al. Citation2011b; Wotherspoon et al. Citation2012; Villamor et al. Citation2014, Citation2016; Bastin et al. Citation2015). Deformation structures include short, overlapping (en-echelon) fissures, either with or without ejecta (e.g. and ), that join to form arrays of longer features which are perpendicular to the inferred directions of lateral spreading (Quigley et al. Citation2013).
In some areas, there are remarkable similarities in the mapped distribution of liquefaction for both events, but there are also some important differences. This likely reflects controlling factors such as the distribution of ground shaking imposed by each earthquake, the underlying geological materials, the depth of groundwater levels and the local basin geometry. These controlling factors are explored in more detail below.
Recorded PGA values at Kaiapoi were c. 0.2 g for both events, and liquefaction damage there was similar in both events (compare and , ). PGA values were c. 0.2 g in Christchurch City during the Darfield event, but much higher (0.3 to ≥ 0.7 g) for the Christchurch event (a ‘direct hit’) and, consequently, far greater damage occurred there in 2011.
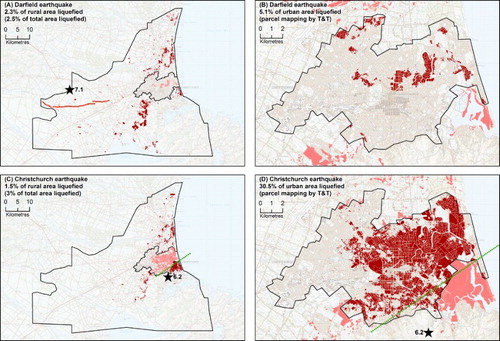
Although the Darfield earthquake was of a larger magnitude, the close proximity of the Christchurch earthquake to the city and the ‘direct hit’ beneath the liquefaction-prone land can at least partly explain the greater damage that occurred there in 2011. shows a comparison of the extent of liquefaction for both events, including an enlarged view of the Christchurch urban area. We compare these two areas separately because of the different mapping techniques employed: parcel-based mapping in the city and digitising of natural boundaries in the rural areas. Overall, c. 2.5% of the entire area that we assessed for the Darfield earthquake was mapped as having liquefied in the 2010 event. In comparison, c. 3% of the same area was affected in the 2011 event, even though the Christchurch earthquake was of a lower magnitude. This difference is due mainly to the large area (30%) of mapped liquefaction in the urban area for the Christchurch earthquake compared with only about 5% liquefaction of the urban area for the Darfield earthquake. In 2010, liquefaction occurred in only the most susceptible materials in the urban area, whereas in 2011, and with a smaller magnitude, even moderately susceptible soils were affected because the epicentre was closer and the PGA values locally higher.
Figure 13. Comparison of the distribution of liquefaction for the Darfield and Christchurch earthquakes in the rural and residential areas (mapped separately), as a proxy for comparing liquefaction severity between the two events. A, The Darfield earthquake affected c. 2.5% of the total area assessed. B, Because of its more distant source, only the most susceptible materials in the city (5% of mapped urban area) were affected. C, The Christchurch earthquake affected c. 3% of the same total area as in A. D, The proximity of the epicentre directly beneath the liquefaction-prone soils of the city and the consequently higher local PGA values resulted in more severe liquefaction, affecting both highly and moderately susceptible soils (c. 30% of mapped urban area). Epicentres are shown by black star and sub-surface fault (at 1 km depth) by green dashed line.
The pattern of liquefaction west of the Port Hills appears to define old abandoned channels and meanders of the Heathcote and Halswell river systems. Ground shaking in this area was similar during both events (measured PGA values for both events were between c. 0.1 and c. 0.3 g), but there was more liquefaction in 2010 than in 2011 – both in terms of volume (diameter) and number of sand boils (Villamor et al. Citation2016). The locally more extensive liquefaction there in 2010 might be due to differences in the water table level between September 2010 (wet) and February 2011 (dry), or some critical threshold for liquefaction was reached within the recorded range of PGA values. Alternatively, the local basin geometry may have played a role, whereby seismic energy coming in from the west during the September 2010 earthquake might have been amplified or diffracted against the strong lithological contrast (i.e. interface of gravels with volcanic rock) at the western end of the Port Hills.
Similarities in the observed distribution of liquefaction for the 2010 and 2011 events appear to be due to similar PGA intensities at a particular site (assuming that susceptible materials are present; e.g. as observed at Kaiapoi). Additionally, once liquefaction has occurred it may be easier for smaller events, that would not otherwise have done so, to induce surface liquefaction – the first event having broken the non-liquefied crust above the water table and formed conduits for easy escape of ejecta during future events of smaller magnitude. Quigley et al. (Citation2013) noted repeated activation of a set of structures in eastern Christchurch, recording at least 10 liquefaction events triggered by earthquakes with magnitudes as low as MW5.2. Furthermore, ground settlements from earlier events resulted in a higher water table and thinner overlying crust for subsequent events, and the loss of any age-related stiffness of liquefiable soils once triggered in the first event (Hayati & Andrus Citation2009).
Cox et al. (Citation2012) suggest that high (artesian) groundwater pressures were also a contributing factor for causing liquefaction, at least in the 2010 Darfield earthquake. Much of the worst damage occurred along the transition from unconfined/semi-confined aquifers under the plains in the west, to the deep, confined aquifers beneath the coastal belt. Damage to Christchurch City during the 2011 Christchurch earthquake may have been exacerbated by high (to artesian) groundwater pressures coupled with a pressure response of to the earthquake hypocentre directing energy directly below the city. However, it is currently unknown whether a connection between the deeper confined artesian groundwater pressures and the near-surface water table exists.
Thus, the distribution of mapped liquefaction presented here is influenced by a combination of factors including the magnitude of the earthquake and the location (proximity) of its epicentre, the nature of the underlying geological materials and their response to seismic energy, the local geometry of the basin potentially amplifying or attenuating that energy, seasonal fluctuations in the depth to the water table, whether or not there are pre-existing structures along which liquefied fluids may pass and, possibly the confined, deep aquifer system beneath the eastern Canterbury Plains.
Comparison of observed extent with liquefaction susceptibility maps
The potential for liquefaction to affect the sediments beneath Christchurch City (Elder et al. Citation1991; Brown & Weeber Citation1992; Clough Citation2005; Forsyth et al. Citation2008) and Kaiapoi (Berrill et al. Citation1994) has long been known. Maps of liquefaction susceptibility are usually based on the properties of surface and near-surface geological materials and the depth to the groundwater table. In a comparison with the liquefaction susceptibility map of Brown and Weeber (Citation1992; their Figure 72), some areas reacted as predicted during the Canterbury earthquake sequence, e.g. extensive liquefaction in the eastern suburbs, particularly along the Avon River between Avonside and Bexley, where ‘medium to high’ potential was mapped (Yaldhurst member of the Springston Formation: ‘dominantly alluvial sand and silt’). Other places did not react as susceptibility maps would suggest, e.g. parts of Bryndwr and Fendalton, mapped as ‘surface or near-surface gravel (< 2 m from ground surface)’ with ‘no liquefaction potential’ by Brown and Weeber (Citation1992), experienced extensive liquefaction in both events. Similarly, an area at Hoon Hay, mapped as a gravel-filled channel (Yaldhurst member of Springston Formation) with ‘no liquefaction potential’, experienced liquefaction in 2011. The mapped gravel probably overlies the materials that liquefied at depth – perhaps an old course of the Heathcote River, given the meandering pattern of liquefaction with sinuosity similar to modern channels (e.g. ). In a study of liquefaction and paleoliquefaction features along the Halswell River near Taitapu, Villamor et al. (Citation2014, Citation2016) did not encounter in their 2–3 m deep trenches the source of sands which liquefied (but possibly a source layer at 4 m depth in an auger hole). Thus, a deeper look than the approach used by Brown and Weeber (Citation1992), and the incorporation of geotechnical information such as soil density, is more appropriate to accurately identify potentially liquefiable materials.
More recently, liquefaction susceptibility maps produced by Beca have incorporated surface geological information and soil strength with available drillhole data for the coastal part of the Waimakariri District (Christensen Citation2004, and references therein). Clough (Citation2005) built upon these models by introducing seasonal variability in the depth to groundwater. Comparison of the September 2010 liquefaction extent with the susceptibility maps using the winter groundwater model of Clough (Citation2005) shows a similar pattern of predicted versus actual damage in the north and east of the CBD, but the model over-represented liquefaction in the south of CBD, where none was observed in 2010. The distribution of liquefaction for the February 2011 event did not correspond closely with predictions for either winter or summer groundwater models (Brackley et al. Citation2012).
Brackley et al. (Citation2012) re-ran the models of Clough (Citation2005) with PGA values recorded from the 2010 and 2011 events and the anticipated groundwater levels corresponding to the season in which the earthquakes occurred. These models predicted a much greater extent of liquefaction than was observed for the 2010 event, and that ‘significant liquefaction would have occurred in central, southern and western Christchurch during that earthquake’ (Brackley et al. Citation2012). However, the predicted distribution of liquefaction fits reasonably well with the observed extent for the February 2011 event, with the exception of under-prediction in the Halswell and Wainoni areas. The 2012 models correctly predict some liquefaction to occur in the north at Brooklands, but both scenarios failed to predict a corridor of observed liquefaction along the Styx River, which was mapped as low potential in both cases. As the models were based on boreholes and other sub-surface data (rather than geological models), the sparsity of data in remote locations such as these had reduced their reliability. Additionally, the highly variable nature (both laterally and vertically) of these fluvial deposits presents the biggest challenge to creating susceptibility maps with enough resolution to be useful for planning or hazard mitigation purposes.
Mapping techniques
Manual mapping from aerial images is both time consuming and subjective. We have attempted to minimise the subjectivity by using rigorous internal and external QA processes, including some ground-based verification. Mapping is based on evidence of surface deformation and sedimentation (ejecta), but no classification of severity has been attempted herein. Post-event clean-up and removal of ejected sediment meant that evidence of liquefaction was not routinely preserved and therefore could not always be verified in the field. In some areas, e.g. where we rely on parcel-based mapping, an entire property may have been classified as being affected by liquefaction even if only a small part of it was damaged. Additionally, because of the limitations of mapping scale, some large areas of dispersed deformation have been digitised as single polygons. This may over-represent the spatial extent of liquefaction in these areas.
A semi-automated (supervised) classification of liquefaction damage was attempted on satellite images and aerial photography following the February 2011 event (Broszeit & Ashraf Citation2013). Areas of liquefaction ejecta were defined with some success, but bright areas of reflectance from some concrete surfaces and rooftops were also classified as liquefaction ejecta. Better spectral resolution (e.g. five bands) produced better classification results, whereas higher spatial resolution only produced more pixels with reflectance values too similar to distinguish between ejecta, concrete and rooftops (Broszeit & Ashraf Citation2013). Thus, manual checking of areas identified as liquefaction would still be required if using this automated process. In addition, it would be difficult for automated classification techniques to identify and capture fissures without visible ejecta (see ). A recent remote-sensing approach using object-based image analysis is superior to pixel-based classification, but is itself still dependent on field verification and expert knowledge of liquefaction ejecta phenomena (Morgenroth et al. Citation2016).
Semi-automated to fully automated classification of liquefaction damage could be a useful technique during disaster responses where timing is critical. However, given the misidentification possible using these techniques, we believe that the best methodology for any future robust spatial recording of liquefaction (i.e. for the recovery–reconstruction phases of a disaster or longer term research) would be to employ semi-automated classification as a starting point, augmented by manual mapping and ground truthing.
Only liquefaction features caused by the Darfield and Christchurch earthquakes have been mapped herein, but other earthquakes in the sequence also caused liquefaction. As many as 10 separate events in total caused localised liquefaction in the eastern suburbs of Christchurch City (Quigley et al. Citation2013). However, image capture was generally not frequent enough to delineate many of these events. Ground reconnaissance after the June 2011 and December 2011 earthquakes indicated that liquefaction in these events was of similar or lesser extent and severity than February 2011 in most areas, except very close to the fault (van Ballegooy et al. Citation2014). To be able to fully understand the severity and distribution of liquefaction associated with earthquakes of different magnitudes, we recommend that aerial photography and/or satellite imagery of appropriate resolution is obtained as soon as possible after any event that causes liquefaction.
Conclusions and recommendations
We present maps and digital GIS layers of the extent of liquefaction caused by the September 2010 Darfield and February 2011 Christchurch earthquakes. These maps are intended to be used as an aid for understanding the extent of liquefaction induced by the earthquakes, but should not be relied upon as the sole source of information for sites where detailed site-specific assessment is required.
Mapping was carried out by assessing satellite and aerial photography. Specific areas (polygons) affected by liquefaction were drawn manually within the GIS and assigned descriptive information to various attribute fields. We attempted to minimise the inherent subjectivity of the above method by employing a rigorous QA process, including internal and external reviews, and some site visits. The maps also incorporate ground-based liquefaction mapping undertaken in the months following each of the main events.
Deformation structures include short, overlapping (en-echelon) fissures, either with or without ejecta, which may join to form arrays of longer features. The affected areas are likely to be related to near-surface (within a few metres) alluvial features, such as channels and meander loops, filled with loose, unconsolidated sediment.
Evidence of liquefaction from the September 2010 Darfield earthquake was observed as far north as the Ashley River Lagoon, as far south as Lake Ellesmere and from unconfirmed reports as far east as Akaroa (55, 45 and 70 km from the epicentre, respectively). The main areas of observed liquefaction were the coastal strip either side of the Waimakariri River, to the north and east of the Christchurch CBD, and the rural land at the western foot of the Port Hills.
For the February 2011 Christchurch earthquake, a similar distribution of liquefaction was observed to the north and south of Christchurch City. Liquefaction was observed as far north as Waikuku Beach and as far south as Taitapu (34 and 18 km from the epicentre, respectively). However, due to the proximity of the epicentre to Christchurch City, a much larger proportion of urban Christchurch was affected in 2011, with liquefaction observed in many areas to the north, east and south of the CBD. For the Darfield earthquake, the maximum distance from the epicentre of observed liquefaction is in accordance with data from global observations. The furthest occurrence from the epicentre of liquefaction for the Christchurch earthquake, however, plots slightly beyond the proposed upper limit for its magnitude.
Mapping undertaken in this study has been able to provide measurable differences in liquefaction extent between each earthquake, and highlights the need to understand the factors contributing to these changes. The extent of mapped liquefaction is influenced by a combination of factors, which may include the magnitude of the earthquake and the location (proximity) of its epicentre with respect to susceptible materials and/or infrastructure, the nature of the underlying geological materials (soil characteristics, density, overburden stress, age), the local geometry of the basin, seasonal variations in the water table, whether or not there are pre-existing structures along which liquefied fluids may pass and, possibly, the aquifer system beneath the eastern Canterbury Plains.
Further earthquake events located elsewhere in Canterbury or further afield may also result in areas liquefying which were not observed to liquefy during these events; thus drawing extensive conclusions about liquefaction hazard of the mapped region on the sole basis of observations made following the Canterbury earthquake sequence of 2010–2011 may lead to erroneous predictions of ground performance in future earthquakes.
Future work could involve a re-examination of the aerial imagery to assign liquefaction severity to the mapped polygons (or a subset of them), based on other collected ground-based information as a means of calibration. Liquefaction caused by other aftershocks (e.g. the MW6.3 13 June 2011 event) could be added, if appropriate imagery exists, to increase the temporal resolution of the mapping. A comparison of moment-weighted PGA values (PGA7.5) with the observed distribution of liquefaction may reveal more insights into the relationships between ground shaking and resulting liquefaction for particular events. We also recommend evaluating the frequency content of strong motion data for the Taitapu–Halswell area to assess whether amplification occurred there in 2010.
To be able to fully understand the severity and distribution of liquefaction associated with earthquakes of different magnitudes, we recommend that aerial photography and/or satellite imagery of appropriate resolution (1 m or better) is obtained as soon as possible after any event that causes liquefaction.
Supplementary data
Datasets S1. GIS layer of interpreted surficial liquefaction, related sedimentation and standing water for the Darfield earthquake, attributed by feature type, evidence for interpretation, observer, quality check, image of origin and final certainty.
Datasets S2. GIS layer of interpreted surficial liquefaction, related surface sedimentation and standing water for the Christchurch earthquake, attributed by feature type, evidence for interpretation, observer, quality check, image of origin and final certainty.
Acknowledgements
The authors thank Shaun Levick and Katie Jones for sourcing and processing images. We also thank Rebecca Pannen and Maximilian Haase for assistance with digitising and internal QA. We thank Beca, Landcare Research, GNS Science, Environment Canterbury, the Earthquake Commission and Greg Curline, for allowing access to unpublished reports. R Green kindly provided global data for distal liquefaction occurrences used in . Reviews by Pilar Villamor, David Heron, Russell Green and one other anonymous reviewer greatly improved this manuscript.
Associate Editor: Professor Shane Cronin.
Disclosure statement
No potential conflict of interest was reported by the authors.
Additional information
Funding
Related Research Data
References
- Almond P, Wilson T, Shanhun FL, Whitman Z, Eger A, Moot D, Cockcroft M, Nobes D. 2010. Agricultural land rehabilitation following the 2010 darfield (Canterbury) earthquake: a preliminary report. Bull New Zeal Soc Earthq Eng. 43:432–438.
- Ambraseys NN. 1988. Engineering seismology: part I. Earthq Eng Struct Dyn. 17:1–50. doi: 10.1002/eqe.4290170101
- van Ballegooy S, Malan P, Lacrosse V, Jacka ME, Cubrinovski M, Bray JD, O’Rourke TD, Crawford SA, Cowan H. 2014. Assessment of liquefaction-induced land damage for residential Christchurch. Earthquake Spectra. 30:31–55. doi: 10.1193/031813EQS070M
- Bannister SC, Gledhill KR. 2012. Evolution of the 2010-2012 Canterbury earthquake sequence. New Zealand J Geol Geophy. 55:295–304. doi:10.1080/00288306.2012.680475
- Bastin SH, Quigley MC, Bassett K. 2015. Paleoliquefaction in Christchurch, New Zealand. Geol Soc Am Bull. 127:1348–1365. doi:10.1130/B31174.1
- Belliss SE, Lynn IH. 2012. Quality assurance on GNS-compiled liquefaction mapping after September 2010 and February 2011 seismic events. Lincoln: Landcare Research. Landcare Research Contract Report LC 926.
- Berrill JB, Mulqueen PC, Ooi ETC. 1994. Liquefaction at Kaiapoi in the 1901 Cheviot, New Zealand, earthquake. Bull New Zeal Nat Soc Earthq Eng. 27:178–189.
- Brackley HL comp., Almond P, Barrell DJA, Begg JG, Berryman KR, Christensen S, Dellow GD, Fraser J, Grant H, Harwood N, et al. 2012. Review of liquefaction hazard information in eastern Canterbury, including Christchurch City and parts of Selwyn, Waimakariri and Hurunui Districts. GNS Science consultancy report 2012/218; Environment Canterbury report R12/83. 99 p. + 1 CD.
- Broszeit A, Ashraf S. 2013. Using different atmospheric correction methods to classify remotely sensed data to detect liquefaction of the February 2011 earthquake in Christchurch. In: SIRC NZ 2013: GIS and remote sensing research conference. Dunedin: Spatial Information Research Centre, August 2013; p. 1–5.
- Brown LJ. 2001. Canterbury. In: Rosen MA, White PA, editors. Groundwaters of New Zealand. Wellington: New Zealand Hydrological Society Inc; p. 441–459.
- Brown LJ, Weeber JH. 1992. Geology of the Christchurch Urban area. Scale 1:25 000. Institute of Geological and Nuclear Sciences geological map 1. 1 sheet + 104 p.
- Canterbury Geotechnical Database. 2013. https://canterburygeotechnicaldatabase.projectorbit.com/
- Christensen S. 2004. Christchurch liquefaction study: Stage IV. Beca, Carter, Hollings and Ferner Ltd, Christchurch, New Zealand. Environment Canterbury report U04/25/1.
- Clough B. 2005. Christchurch liquefaction study: Stage IV (addendum report). Beca, Carter, Hollings and Ferner Ltd, Christchurch, New Zealand. Environment Canterbury report U04/25/2.
- Cousins WJ, McVerry GH. 2010. Overview of strong-motion data from the Darfield earthquake. Bull New Zeal Soc Earthq Eng. 43:222–227.
- Cox SC, Rutter HK, Sims A, Manga M, Weir JJ, Ezzy T, White PA, Horton TW, Scott D. 2012. Hydrological effects of the Mw 7.1 Darfield (Canterbury) earthquake, 4 September 2010, New Zealand. New Zeal J Geol Geophy. 55:231–247. doi:10.1080/00288306.2012.680474
- Cubrinovski M, Bradley B, Wotherspoon L, Green R, Bray J, Wood C, Pender M, Allen J, Bradshaw A, Rix Get al., 2011a. Geotechnical aspects of the 22 February 2011 Christchurch earthquake, Bull New Zeal Soc Earthq Eng. 44:205–226.
- Cubrinovski M, Bray JD, Taylor M, Giorgini S, Bradley BA, Wotherspoon L, Zupan J. 2011b. Soil liquefaction effects in the central business district during the February 2011 Christchurch Earthquake. Seismol Res Lett. 82:893–904. doi:10.1785/gssrl.82.6.893.
- Cubrinovski M, Green RA, editors. 2010. Geotechnical reconnaissance of the 2010 Darfield (Canterbury) earthquake. Bull New Zeal Soc Earthq Eng. 43:243–320.
- Curline G. 2012. Ground truthing remote interpretation of the surface expression of liquefaction resulting from the September 2010 and the February, June and December 2011 major earthquake events. Unpublished summer scholarship report. Lincoln: Lincoln University.
- Elder DMG, McCahon IF, Yetton MD. 1991. The earthquake hazard in Christchurch: a detailed evaluation. Soils & Foundations Ltd, Christchurch. Report funded by the Earthquake Commission.
- Forsyth PJ, Barrell DJA, Jongens R comps. 2008. Geology of the Christchurch area: scale 1:250,000. GNS Science, Lower Hutt. Institute of Geological & Nuclear Sciences 1:250,000 geological map 16. 67 p. + 1 folded map.
- Fry B, Benites RA, Kaiser AE. 2011. The character of accelerations in the Mw 6.2 Christchurch Earthquake. Seismol Res Lett. 82:846–852. doi:10.1785/gssrl.82.6.846
- Galli P. 2000. New empirical relationships between magnitude and distance for liquefaction. Tectonophysics. 324:169–187. doi: 10.1016/S0040-1951(00)00118-9
- Hayati H, Andrus D. 2009. Updated liquefaction resistance correction factors for aged sands. J Geotech Geoenviron Eng. 135:1683–1692. doi: 10.1061/(ASCE)GT.1943-5606.0000118
- Heron DW (custodian). 2014. Geological map of New Zealand 1:250,000. Lower Hutt: GNS Science. GNS Science geological map 1. 1 CD.
- Hughes M, Quigley M, van Ballegooy S, Deam B, Bradley B, Hart D, Measures R. 2015. The sinking city: earthquakes increase flood hazard in Christchurch, New Zealand. GSA Today. 25:4–10. doi: 10.1130/GSATG221A.1
- Kaiser AE, Holden C, Beavan RJ, Beetham RD, Benites RA, Celentano A, Collet D, Cousins WJ, Cubrinovski M, Dellow GD, et al. 2012. The Mw 6.2 Christchurch Earthquake of February 2011: preliminary report. New Zeal J Geol Geophy. 55:67–90. doi:10.1080/00288306.2011.641182
- Langridge RM, Ries WF, Litchfield NJ, Villamor P, Van Dissen RJ, Barrell DJA, Rattenbury MS, Heron DW, Townsend DB, Lee JM, et al. 2016. The New Zealand active faults database: NZAFD250. New Zeal J Geol Geophy. 59. doi: 10.1080/00288306.2015.1112818
- Maurer BW, Green RA, Quigley M, Bastin S. 2015. Development of magnitude-bound relations for paleoliquefaction analyses: New Zealand case study. Eng Geol. 197:253–266. doi: 10.1016/j.enggeo.2015.08.023
- Morgenroth J, Hughes MW, Cubrinovski M. 2016. Object-based image analysis for mapping earthquake-induced liquefaction ejecta in Christchurch, New Zealand. Nat Hazards. 82:763–775. doi:10.1007/s11069-016-2217-0
- Pirrotta C, Barbano MS, Guarnieri P, Gerardi F. 2007. A new dataset and empirical relationships between magnitude/intensity and epicentral distance for liquefaction in central-eastern Sicily. Ann Geophy. 50:763–774.
- Quigley MC, Bastin S, Bradley BA. 2013. Recurrent liquefaction in Christchurch, New Zealand, during the Canterbury earthquake sequence. Geology. 41:419–422. doi:10.1130/G33944.1
- Quigley M, Van Dissen RJ, Villamor P, Litchfield NJ, Barrell DJA, Furlong K, Stahl T, Duffy B, Bilderback E, Noble D, et al. 2010. Surface rupture of the Greendale fault during the Darfield (Canterbury) Earthquake, New Zealand: initial findings. Bull New Zeal Soc Earthq Eng. 43:236–242.
- Villamor P, Almond P, Tuttle M, Giona-Bucci M, Langridge RM, Clark K, Ries W, Bastin SH, Eger A, Vandergoes M, et al. 2016. Liquefaction features produced by the 2010–2011 Canterbury earthquake sequence in southwest Christchurch, New Zealand and preliminary assessment of paleoliquefaction features. Bull Seismol Soc Am.
- Villamor P, Giona-Bucci M, Almond P, Tuttle M, Langridge RM, Clark KJ, Ries W, Vandergoes MJ, Barker PR, Martin F, et al. 2014. Exploring methods to assess paleoliquefaction in the Canterbury area. GNS Science consultancy report 2014/183. 142 p.
- Wotherspoon LM, Pender MJ, Orense RP. 2012. Relationship between observed liquefaction at Kaiapoi following the 2010 Darfield earthquake and former channels of the Waimakariri River. Eng Geol. 125:45–55.
- Youd TL, Idriss IM. 2001. Liquefaction resistance of soils: summary report from the 1996 NCEER and 1998 NCEER/NSF workshops on evaluation of liquefaction resistance of soils. J Geotech Geoenviron Eng. 127:297–313. doi: 10.1061/(ASCE)1090-0241(2001)127:4(297)
Appendix 1
A1.1 Names and description of fields in the accompanying GIS datasets
A1.2 Description of features in the FEATURE attribute of the accompanying GIS datasets
Liquefaction
The liquefaction category comprises areas of lateral spread and ground surface sedimentation resulting from liquefaction, usually where a vent area can be related to that sediment. Large areas with several sand boils and/or fissures were commonly incorporated into ‘ejecta fields’ (individual sand boils were not mapped separately). Also mapped in this category are areas of obvious lateral-spread damage. APPEARANCE: pale to dark grey sand and silt covering roads and in paddocks. Often manifest as overlapping or en-echelon fissures or individual sand boils (vents) with ejected sediment. Lateral spreading is indicated by fissures or cracks, with or without visible sediment ejecta.
Flooding – sediment
This category includes areas of surface sedimentation, but for which no vent area could be directly related – probably the result of liquefaction close by, but may also include secondary ‘run off’. APPEARANCE: dark grey (where wet) or pale grey to pale brown sediment in paddocks or on roads; typically, not thick enough to entirely mask the ground surface features.
Flooding – water
Large areas of standing surface water and saturated ground, and flooded drains were possibly the result of (temporary?) alteration of the water table due to ground shaking; they may also be due to a very wet winter prior to the Darfield earthquake (not as apparent for February 2011 event). NOTE: many of these large polygons overlap with other digitised liquefaction-related features, especially in GIS for the September 2010 event. APPEARANCE: darker colour than the surrounding land but, depending on the depth of the water, crop/grass textures may still be visible.
Unknown
In some areas, features resembling liquefaction or surface sediment can be seen on the images, but their origin(s) are uncertain. They are possibly the result of liquefaction, but could also be anthropogenic/agricultural. APPEARANCE: mottled ground or subtle darker patches in paddocks.
Other (sand dunes, landslides)
In coastal areas, bare sand forming dunes was initially mapped as liquefaction, but later comparison with pre-earthquake images suggested that these were pre-existing features. In some steeper areas of the Port Hills, debris flow paths (landslides) could be mapped from the GeoEye 04/09/2010 image. These are likely a result of the very wet/saturated ground, and some were noted to have occurred before the Darfield earthquake. APPEARANCE: sand dunes appear as patches of bare sand/soil, commonly with shadows caused by relief. Landslides appear as brown streaks of bare soil in valleys and can usually be traced back to a source area or head scarp.
Old flooding
A new category was added to the assessment for the 22 February earthquake. This includes areas that were under water in the September 2010 images, but were dry in February 2011 and subsequently remained as bare ground or were overgrown by weeds. APPEARANCE: patches of bare soil (grey to brown) or areas of new vegetation, sometimes with discrete white spots (perhaps flowering plants).
Agricultural, anthropogenic
Some polygons that had been mapped as ‘liquefaction’ were subsequently re-categorised as agricultural or anthropogenic (or unknown) as a result of review of the mapping (QA process). Where polygons were reclassified, it was because features in the images, although resembling liquefaction, were judged more likely to be crop patterns/textures resembling liquefaction, hay feed-out lines, or bare ground along fences and in gateways, etc. These reclassified polygons were retained in an archived version of the dataset, as they may have value for future research into the interpretation of imagery.
Polygons identified as ‘agricultural’ or ‘anthropogenic’ are not included in the final dataset, as it is unlikely they are related to liquefaction. APPEARANCE: mottled darker or lighter ground within paddocks. Typically, these features may be in a regular pattern, or are restricted to one or two paddocks and do not cross fence lines, suggesting that they are man-made.
Note that some attribute names have been altered since Brackley et al. (Citation2012). GROUP = FEATURE, ORIG_NOTE = EVIDENCE and ADOPT_CERT = CERTAINTY.
Appendix 2
Person or company who digitised and/or provided assessment for the mapped polygons as attributed in the ORIGINATOR field
DBT: Dougal Townsend; JML: Julie Lee; DS: Delia Strong; BSL: Belinda Smith-Lyttle; SA: Salman Ashraf; KSL: Katherine Lyttle; BR: Brenda Rosser; RJ: Richard Jongens; RP: Rebecca Pannen; MH: Maximillian Haase; NDP: Nick Perren; UC: various – data provided by Misko Cubrinovski; T&T: various – data provided by Mike Jacka; Beca: data provided by Steve Christensen.