
ABSTRACT
We present alkenone-derived sea surface temperature (SST) records from the New Zealand/Tasmania sector of the Southern Ocean (ODP Sites 1171 and 1125) during the Early Pleistocene (c. 1.7 to 0.7 Ma). Our data show that the subantarctic surface waters (ODP Site 1171) cooled by c. 4 °C and reached near modern conditions after 0.88 Ma, indicating a long-term northward migration of the Southern Ocean fronts. This long-term cooling occurred in two major steps between 1.25–1.1 Ma and 0.95–0.88 Ma, which correlate with significant increases in Antarctic ice volume and global circulation changes. The comparison between the subantarctic and subtropical SST trends tends to indicate that the Subtropical Front was unstable during the Early Pleistocene with significant southward incursions of subtropical waters during warm interglacials (1.07 Ma and 0.95 Ma identified as MIS31, MIS25).
Introduction
The Southern Ocean connects the Atlantic, Indian and Pacific Oceans through the Antarctic Circumpolar Current and plays a prominent role in both sequestering CO2 (Caldeira & Duffy Citation2000) and redistributing heat between hemispheres and from the surface to the deep ocean.
The climatic evolution of the Southern Ocean is closely linked to the migration of three prominent oceanic fronts (): the Subtropical Front (STF) between the subtropical waters (STW) and subantarctic waters (SAW), the Subantarctic Front (SAF) at the boundary of the Subantarctic Zone (SAZ) and the Antarctic waters, and the Antarctic Polar Front at 62°S in the western Pacific sector of the Southern Ocean. It is well established that during the Pleistocene, the Southern Ocean frontal system migrated northward during cold periods and south during warm periods (Morley Citation1989; Howard & Prell Citation1992; Findlay & Giraudeau Citation2002; Pelejero et al. Citation2006; Sikes et al. Citation2009; Hayward et al. Citation2012; Bostock et al. Citation2015). However, in the southwest Pacific, the STF latitudinal displacements during glacial–interglacial (G–IG) climate cycles have been complicated by the shallow bathymetry around New Zealand and remained locked on the Chatham Rise over the last few glacial cycles (Weaver et al. Citation1998; Sikes et al. Citation2002).
Figure 1. Modern SST (March 2013; Naval Research Laboratory–Navy Coastal Ocean Model [Internet]. Available from: http://www7320.nrlssc.navy.mil/) and positions of the main water bodies, fronts and surface currents in the western sector of the Southern Ocean (after Orsi et al. Citation1995). S-Tasman Rise, South Tasman Rise; Ch. Rise, Chatham Rise; SEC, South Equatorial Current; EAC, East Australia Current; EAUC, East Auckland Current; ECC, East Cape Current; TF, Tasman Front; N-STF, North Subtropical Front, S-STF, South Subtropical Front; STFZ, Subtropical Frontal Zone; SAF, Subantarctic Front.
![Figure 1. Modern SST (March 2013; Naval Research Laboratory–Navy Coastal Ocean Model [Internet]. Available from: http://www7320.nrlssc.navy.mil/) and positions of the main water bodies, fronts and surface currents in the western sector of the Southern Ocean (after Orsi et al. Citation1995). S-Tasman Rise, South Tasman Rise; Ch. Rise, Chatham Rise; SEC, South Equatorial Current; EAC, East Australia Current; EAUC, East Auckland Current; ECC, East Cape Current; TF, Tasman Front; N-STF, North Subtropical Front, S-STF, South Subtropical Front; STFZ, Subtropical Frontal Zone; SAF, Subantarctic Front.](/cms/asset/c61c34db-90f0-4371-a41b-c7040751bb60/tnzg_a_1195756_f0001_c.jpg)
In our study, we focus on the interval between c. 1.7 and 0.7 Ma, encompassing the Mid-Pleistocene Transition (MPT, between 1.25 and 0.7 Ma, Clark et al. Citation2006). This critical period in the Earth’s climate history features a long-term cooling trend affecting both low and high latitudes that started at 1.2 Ma [Marine Isotype Stage (MIS)35–34] and the transition from obliquity (41 kyr) paced ice volume variations to high-amplitude eccentricity (100 kyr) paced G–IG oscillations (Mudelsee & Stattegger Citation1997; McClymont et al. Citation2013).
The long-term Pleistocene cooling is well documented in the Atlantic sector of the Southern Ocean but less is known about the Pacific sector (Rodriguez-Sanz et al. Citation2012). The primary objective of this study was to document the long-term evolution of the subantarctic surface waters during the Early Pleistocene and to track the position of the STF in the southwestern sector of the Pacific through the MPT. To address this challenge, we reconstructed sea surface temperatures (SST) using alkenone paleothermometry () across the STF in the New Zealand/Tasmania sector of the Southern Ocean. We focus our analyses on two ODP sites: Site 1171 positioned south of Tasmania and south of the modern STF in the SAW; and Site 1125 located east of New Zealand, in the southwest Pacific STW directly north of the STF.
Modern oceanographic setting
The surface circulation in the southwest sector of the Pacific Ocean is marked by three components (), the subtropical inflow from the north, the subantarctic inflow from the south and the occurrence of the two major frontal systems, the STF and the SAF. Subtropical inflow comprises warm (over 15 °C in summer), high-salinity, macronutrient-poor, micronutrient-rich STW.
The subtropical inflow in the southwest Pacific is connected to the warm east Australian current that flows from the north along the east coast of the Australian continent () and is deviated eastward around 32°S (Ridgway & Godfrey Citation1994; Ridgway et al. Citation2002) as a response to wind stress (Tilburg et al. Citation2001). It enters by the South Pacific subtropical gyres as the Tasman Front and flows along the eastern side of New Zealand, forming the East Cape Current before turning eastward along the northern slope of the Chatham Rise.
The subantarctic inflow comprises cool (< 15 °C in summer), low-salinity, macronutrient-rich and micronutrient-poor waters that flow northward along the eastern side of South Island of New Zealand before reaching the southern slope of the Chatham Rise.
The convergence between these two water masses (the STF) in the Southern Ocean is complex (Graham & De Boer Citation2013). In the Tasman Sea, the STF spans a 500 km frontal zone (STFZ) that is delimited by the North Subtropical Front (N-STF) and the South Subtropical Front (S-STF) (; Smith et al. Citation2013; Chiswell et al. Citation2015 and reference herein). After flowing around the south of the New Zealand’s South Island, the STF bends north along the east coast, after which it becomes bathymetrically locked along the continental margin and the Chatham Rise (see Chiswell et al. Citation2015 for review). East of the Chatham Islands, the front becomes dynamic.
The S-STF, which is the poleward extent of the subtropical waters (STW) and is considered the main STF (Hamilton Citation2006), is characterised by a SST gradient of 4 °C over 0.5° of latitude (Rintoul et al. Citation1997). Southern Ocean fronts today migrate north and south seasonally across wide areas of the ocean (Belkin & Gordon Citation1996) and are generally controlled by wind (McCartney Citation1977), except in some locations where subsurface topography influences their location. For example, south of Tasmania, where ODP Site 1171 is located, the STF lies between the South Tasman Rise and Tasmania (Orsi et al. Citation1995; Belkin & Gordon Citation1996) and east of New Zealand, where ODP Site 1125 was drilled, the STF is steered by the Chatham Rise (Heath Citation1981, Citation1985; Belkin & Gordon Citation1996; McCave et al. Citation2004).
Material and methods
Core location and chronostratigraphy
ODP Site 1171 (48°30′S, 149°6′E) is located on the southwestern slope of the South Tasman Rise, c. 550 km south of Tasmania (). This site lies in modern SAW. Pleistocene sediment mainly consists of foraminiferal nannofossil ooze. The modern average annual SST in this area is 10 °C, with the coolest temperatures (9 °C) recorded in July–September and the warmest (c. 11 °C) between January and March (Locarnini et al. Citation2010).
ODP Site 1125 (42°33′S, 178°10′W) is located 610 km east of New Zealand’s South Island () on the northern slope of the Chatham Rise at 1360 m depth (Carter et al. Citation1999). Sediments recovered at Site 1125 comprise pelagic and hemipelagic clayey nannofossil ooze interbedded with nannofossil-bearing silty clay that was deposited continuously with little disturbance over the last glacial cycles (Carter et al. Citation2000). The mean annual SST in this area is 16 °C, with winter temperatures averaging 13 °C and the warmest summer temperatures being 18 °C measured in January–March (Locarnini et al. Citation2010).
We used chronologies for Sites 1171 and 1125 from shipboard paleomagnetic data, as guided by the core catcher first (FAD) and last (LAD) appearance nannofossil datum (), and published age model above 20.3 m at Site 1125 (Schaefer et al. Citation2005). Core catcher ages have a large depth error because FADs may occur up to 9 m deeper, and LADs 9 m shallower. At Site 1171, shipboard magnetic studies indicate that sediment demagnetises in low field strength alternating fields and that the dominant magnetic mineral in sediment is likely magnetite (Exon et al. Citation2001). Therefore, we used the 20 mT demagnetisation data measured at 5 cm intervals from holes B and C to construct the magnetostratigraphy. The magnetostratigraphy is relatively unambiguous, but demagnetisation data from hole B are better behaved than those from hole C, which contains anomalous shallow inclination intervals from the top of the core to c. 12 m. The anomalous shallow inclinations likely resulted from experiments performed to test the effect of different core liners and barrels (Exon et al. Citation2001). The correlation with the magnetic polarity timescale is unambiguous, as guided by the LADs of Pseudoemiliania lacunosa at 6.995 ± 0.05 m and Calcidiscus macintyrei at 24.06 ± 0.375 m, which have ages of 0.46 and 1.67 Ma, respectively (Stickley et al. Citation2004), and the LAD of Helicosphaera sellii (1.26 Ma) at 21.435 ± 0.38 m (Stant et al. Citation2004). Accordingly, we identify the base of C1n at c. 13.1 m, and the top and base of C1r.1n at c. 15.6 and 17.2 m, respectively. Overall, our age model agrees well with the most recent published age model of Stant et al. (Citation2004), who used additional FAD and LADs. At Site 1125 we adopt the chronostratigraphies of Hayward (Citation2002) and Schaefer et al. (Citation2005) to a depth of 21.53 m (0.978 Ma), after which we use the magnetic polarity record from shipboard analyses. Shipboard analyses comprised natural remanent magnetization (NRM) magnetic moment measurements followed by 20 mT alternating field demagnetisation, which reduced the magnetisation to 10−6 A/m. The resulting demagnetisation data are poor and likely contaminated by a vertical drilling over print, which was pervasive on cores recovered during this leg (Carter et al. Citation1999). However, a recognisable reversal record is present and, as guided by calcareous nannofossil datum, provides age control for our records. The correlation of the magnetic polarity reversals with the geomagnetic polarity time scale is guided by the FAD of Gephyrocapsa parallela at 23.37 m and LAD of Reticulofenestra asanoi, which have ages of c. 0.95 and 0.85 Ma, respectively. The LAD of H. sellii at 31.31 m indicates an age of c. 1.26 Ma. Therefore, we identify the base of C1n at c. 20.2 m, and the top and base of C1r.1n at c. 21.3 and 23.3 m, respectively. The base of the record is constrained by the FAD of Gephyrocapsa (medium) at 37.88 m, which has an age of 1.69 Ma (Lourens et al. Citation2004), and the C2r.2r–C2An.1n reversal, which has an age of 2.581 Ma (Sabaa et al. Citation2004). Data were converted to age by linear interpolation between geomagnetic reversals.
Figure 2. Magnetic polarity stratigraphies for ODP Sites 1171 and 1125 constructed from shipboard, 20 mT demagnetisation data measured on working half cores. Nannofossil FADs and LADs, and existing age models of Hayward (Citation2002) and Schaefer et al. (Citation2005) guide the correlation with the magnetic polarity timescale (Gradstein et al. Citation2012).
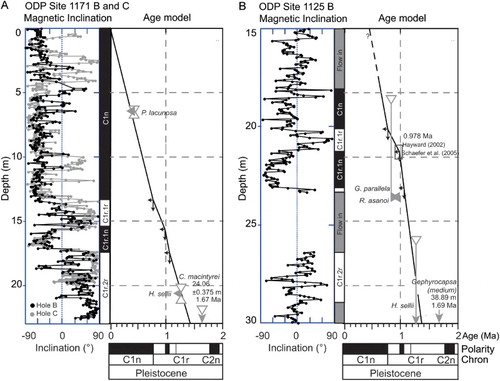
All depths refer to the metres composite depth scale using the splice by Exon et al. (Citation2001) for Site 1171 and Carter et al. (Citation1999) for Site 1125.
Sea surface temperature reconstructions
For Site 1171A, alkenone unsaturation ratios were measured on samples from 1171A–2H–4W to 1171A–3H–5W at a resolution of one sample every 20 cm (between 12.94 and 22.65 m). For Site 1125A, we measured alkenones on samples from the interval between 1125A–3H–2W and 1125A–4H–6W. Because of drilling disturbances () at Site 1125, our sampling was not continuous. For the intervals of good sediment recovery, the average resolution is of one sample every 30 cm (between 18.78 and 33.2 m).
Alkenones were extracted from freeze-dried sediments (c. 6 g) using a Dionex 300 Accelerated Solvent Extractor with dichloromethane and methanol (9:1, v/v) at 1500 psi and 100 °C. Alkenones were isolated by silica gel chromatography using solvents of increasing polarity following the procedure of Sicre et al. (Citation2001). The fractions containing alkenones were concentrated, transferred to clean glass vials, evaporated under nitrogen and reconstituted in dichloromethane. Gas chromatographic analyses were performed on a Hewlett-Packard 6890 gas chromatograph with a flame ionisation detector using a fused silica capillary column (Rxi-1 ms, 50 m long, 0.32 mm internal diameter, 0.25 μm film thickness). Helium was used as a carrier gas. The index
was calculated from the C37 alkenones to derive SSTs using the global calibration of Conte et al. (Citation2006):
, which is adapted for both subantarctic and subtropical Southern Ocean water masses and has a mean standard error of ± 1.2 °C (Conte et al. Citation2006). Alkenone-derived SSTs in the Southern Ocean are known to mainly reflect summer temperatures (King & Howard Citation2001, Citation2003; Sikes et al. Citation2005, Citation2009).
Results: sea surface temperature trends
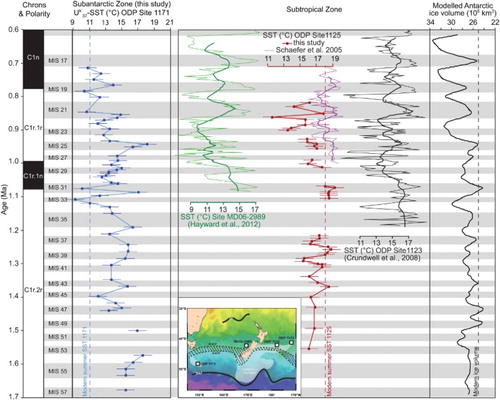
Alkenone-derived SSTs measured at Site 1171 (SST1171) vary between 9.2 ± 1.2 °C and 18.2 ± 1.2 °C, whereas those at Site 1125 (SST1125) vary between 11.7 ± 1.2 °C and 19.3 ± 1.2 °C and are on average 3 °C warmer than SST1171 (, Table S1). For the studied interval, SST1171 values are on average 3–4 °C warmer than the modern summer temperature until 0.85 Ma when they approach modern values. Although the SST record for Site 1125 is incomplete, our results show that for the studied interval, SST1171 and SST1125 record a long-term 3 °C cooling between c. 1.35 Ma and c. 0.88 Ma. From 0.85 Ma, SST1171 approaches the modern values and SST1125 averages 15 °C until the end of our record.
Figure 3. Summary of the evolution of the Subantarctic and Subtropical zones in the southwest Pacific sector of the Southern Ocean during the Early Pleistocene. The SAW are depicted by the alkenone-derived SSTs from ODP Site 1171. For the Subtropical Zone, we base our interpretations on SSTs from ODP Site 1125 (alkenone-derived SSTs from this study, modern analogue technique (MAT)-derived SSTs from Schaefer et al. Citation2005), ODP Site 1123 (Crundwell et al. Citation2008) and MD06-2989 (Hayward et al. Citation2012). For MAT-derived SSTs, the thick lines represent the 40 kyr smoothed records. For alkenone-derived SSTs, the error bars are shown. Each warm marine isotope stage (MIS) is shaded in grey and the extension of the Mid-Pleistocene Transition (MPT) is indicated by the vertical thick black bar. Modelled 40 kyr smoothed record of the Antarctic ice volume is from Pollard and Deconto (Citation2009).
Discussion
Our long-term SST record at Site 1171 () is very similar to the alkenone-derived SST reconstruction of Martínez-Garcia et al. (Citation2010) from the SAW of the Atlantic Ocean (ODP Site 1090). The agreement between these data sets indicates that our SST record from Site 1171 reflects changes that were Southern Ocean wide. To track the long-term interaction between the SAW and STW bodies in the southwest Pacific, we compare our new SST records with published ones. Available data for the STW (Schaefer et al. Citation2005; Crundwell et al. Citation2008; Hayward et al. Citation2012) were derived from the modern analogue technique and artificial neural network method on planktic foraminifera and overlap with our SST1171 during the interval between 1.1 and 0.7 Ma ().
The pre-MPT: before 1.25 Ma
Prior to 1.25 Ma, subantarctic SSTs were on average 4 °C warmer than modern summer temperatures. Evidence of warm conditions is supported by the calcareous nannofossil assemblage composition at Site 1171, which is characteristic of the SAZ with abundant low latitude taxa (Stant et al. Citation2004). Alkenone-derived SSTs at subtropical Site 1125 are similar, with conditions that are on average 3–4 °C warmer than SST1171. The apparent consistency of the temperature gradient between SAW and STW, similar to the average modern latitudinal gradient across the STF, tends to indicate moderate Southern Ocean frontal migrations. The absence of significant ecological shifts to cool water taxa at Site 1171 (Exon et al. Citation2001; Stant et al. Citation2004), low average Antarctic ice volume (27 × 106 km3; ) and moderate G–IG variations characterising the pre-MPT interval (41 kyr state; Clark et al. Citation2006) all lend support to the conclusion that there was relative warmth and only moderate migration of ocean fronts during this time. However, the short-lived appearance of subtropical calcareous nannofossil Umbilicosphaera jafari (Stant et al. Citation2004) at Site 1171 around 1.13 Ma seems to indicate a brief incursion of warm STW all the way to the latitude of Site 1171, which is not clearly featured in our SST reconstructions.
Onset of the MPT: 1.25 Ma to 1.1 Ma
We identify the first significant transition between 1.25 and 1.1 Ma () by a progressive SST cooling of c. 5 °C, which is also reflected in the calcareous nannofossil assemblage (Stant et al. Citation2004) with the increasing abundance of cold water SAZ species Coccolithus pelagicus and Calcidiscus leptoporus (e.g. McIntyre & Bé Citation1967; Hiramatsu & De Deckker Citation1997; Eynaud et al. Citation1999; Baumann et al. Citation2000).
A similar SST decrease was observed in the Atlantic sector (ODP Site 1090) of the Southern Ocean (Martínez-Garcia et al. Citation2010) between 1.25 and 1.15 Ma at the onset of the MPT (McClymont et al. Citation2013). At Site 1090 (42.9°S–8.9°W), this trend appears to be driven by a 6 °C cooling during MIS34, which we do not fully capture at Site 1171 because of the lower sampling resolution in this interval.
The SST1171 cooling, the temporary disappearance of the low latitude taxa Gephyrocapsa caribbeanica, and the shift to subantarctic calcareous nannofossil populations (Stant et al. Citation2004) attest to major changes in the subantarctic surface waters. Rodriguez-Sanz et al. (Citation2012) suggest that during this interval, the Atlantic Ocean surface waters were under the influence of a northward extension of the polar frontal system. At Site 1123 (41°47.2′S–171°29.9′W), situated on the northern edge of the STF east of New Zealand, Crundwell et al. (Citation2008) reported a similar long-term cooling of the mean annual SST from 1.185 Ma, which indicates a northward expansion of SAW (). We consider that during the onset of the MPT, at least the STF migrated northward in the southwest Pacific region and possibly the entire Southern Ocean frontal system in response to Antarctic ice growth ().
The MPT part 1: between 1.1 Ma and 0.88 Ma
This interval corresponds to a long-term SST cooling of c. 3.5 °C at the STZ sites (Site 1123, MD06–2989 and Site 1125 alkenone-derived SSTs), which has been attributed to an increased inflow of SAW (Crundwell et al. Citation2008). The northward displacement of the STF in the southwest Pacific echoes the general northward migration of SAF in the Atlantic interpreted by Marino et al. (Citation2009) from calcareous nannofossil assemblages and is in agreement with a dynamic Pacific Deep Western Boundary Current (Hall et al. Citation2001; Venuti et al. Citation2007).
The subantarctic SSTs (Site 1171) during that interval display low variability and an overall stable long-term trend interrupted by two short warm events at 1.07 and 0.95 Ma, which may be MIS31 and MIS25 (). Stant et al. (Citation2004) noted the dominance of Helicosphaera carteri and the temporary reappearance of the low latitude eutrophic specie G. caribbeanica at around 1.07 Ma at Site 1171, indicating surface-ocean warming. The ecology of H. carteri is controversial and their increased abundance may indicate a warming of waters (McIntyre Citation1967; Winter et al. Citation1979) or iceberg melting (Sierro et al. Citation2005). Flores and Sierro (Citation2007) reported an increase in H. carteri at Site 1094 south of the Polar Front in the Atlantic sector of the Southern Ocean during the MIS31, arguing for the southward migration of the front and surface ocean warming. Similarly, the SST1171 increase at 0.95 Ma is correlated with a temporary increase in the abundance of G. caribbeanica (Stant et al. Citation2004). At Site 1123 (), MIS31 and MIS25 are also clearly identified with an SST increase averaging 5 °C, indicating a temporary southward migration of the STF. At Site 1125, our SST reconstruction is patchy and we do not observe a clear temperature increase during MIS31 or MIS25. However, Schaefer et al. (Citation2005) also did not identify unusual SST warming during MIS25, which may indicate that SSTs were generally more stable in this location. The apparent SST stability at Site 1125 compared with Site 1123 may be due to complex interactions of the STF with the topography in this region (Smith et al. Citation2013). At the location of Site 1125, sitting half way along the Chatham Rise, the subsurface topography limits the STF shifts, whereas Site 1123 is located east of the Chatham Rise in a region where STF can migrate latitudinally (Crundwell et al. Citation2008; Hayward et al. Citation2012).
Although Hayward et al. (Citation2012) consider that during all the MPT interglacials (including MIS31 and MIS25), the STF was diffuse and located close to its modern position in the East Tasman Sea, we argue that, at least during MIS31 and MIS25, the STF migrated southward, bringing warm waters close to the latitude of ODP Site 1171.
The MPT part 2: from 0.88 Ma
At c. 0.88 Ma (MIS22), the subtropics and the subantarctic surface waters warm simultaneously. This abrupt event marks the beginning of a clear separation between the subantarctic and subtropical zones associated with the major perturbation of the Pacific Deep Western Boundary Current (Hall et al. Citation2001; Venuti et al. Citation2007) and global thermohaline circulation.
From 0.87 Ma, at Site 1171 we observe a c. 4 °C cooling to near modern SSTs with persistent average SSTs of 11 °C until 0.74 Ma, whereas in the subtropical zone, the SSTs vary between long intervals of temperate interglacials and short G–IG with increasing subtropical inflow north of the STF (Crundwell et al. Citation2008; ). At Site 1171, calcareous nannofossils also reflect the cooling trend with episodic decreased abundance of C. pelagicus, C. leptoporus and reticulofenestrids (Stant et al. Citation2004). This is in agreement with the deposition of laminated diatom mats in the Atlantic SAZ indicating a northward displacement of the Polar Front between 0.89 and 0.74 Ma (Kemp et al. Citation2010).
Conclusions
Our low-resolution SST record at Site 1171 demonstrates that through the Early Pleistocene, subantarctic surface waters cooled by c. 4°C and reached near modern conditions after 0.88 Ma. This long-term cooling has also been recognised in the Atlantic SAZ (Martínez-Garcia et al. Citation2010) and indicates a northward migration of the Southern Ocean fronts. The cooling occurred in two major steps between 1.25–1.1 Ma and 0.95–0.88 Ma, and correlates with significant increases in Antarctic ice volume (Naish et al. Citation2009; Pollard & DeConto Citation2009) and changes in global circulation (Hall et al. Citation2001; Venuti et al. Citation2007; Marino et al. Citation2009).
Based on a comparison between the long-term SST evolution of the subtropical and SAZ, we argue that the position of the STF in the southwest Pacific was unstable and that, at least during two episodes, dated at 1.07 and 0.95 Ma (identified as MIS31 and MIS25), the STF migrated south significantly. Further effort should be dedicated to investigating this later frontal displacement, which has not been identified in the southwest Pacific. Investigations should include alkenone-derived SST reconstructions in the subtropical zone to determine the latitudinal temperature gradient across the STFZ, avoiding any proxy-related bias (modern analogue technique versus ).
Supplementary data
Table S1. Alkenone-derived SST estimates from ODP Sites 1171 and 1125.
Table S1. Alkenone-derived SST estimates from ODP Sites 1171 and 1125.
Download MS Excel (16.8 KB)Acknowledgements
We thank Nick Mortimer and the reviewers for their constructive and valuable reviews. Special thanks go to Helen Bostock who greatly improved the manuscript with her comments and suggestions. We thank the curators from the USA and Japan IODP core repositories for their efficiency in providing the samples that were needed for this study.
Associate Editor: Associate Professor Brent Alloway.
Disclosure statement
No potential conflict of interest was reported by the authors.
Related Research Data
References
- Baumann KH, Andruleit H, Samtleben C. 2000. Coccolithophores in the Nordic Seas: comparison of living communities with surface sediment assemblages. Deep-Sea Research II. 47:1743–1772. doi: 10.1016/S0967-0645(00)00005-9
- Belkin IM, Gordon AL. 1996. Southern Ocean fronts from the Greenwich meridian to Tasmania. J Geophy Res Oceans. 101:3675–3696. doi: 10.1029/95JC02750
- Bostock HC, Hayward BW, Neil HL, Sabaa AT, Scott GH. 2015. Changes in the position of the subtropical front south of New Zealand since the last glacial period. Paleoceanography. 30:824–844. doi: 10.1002/2014PA002652
- Caldeira K, Duffy PB. 2000. The role of the Southern Ocean in uptake and storage of anthropogenic carbon dioxide. Science. 287:620–622. doi: 10.1126/science.287.5453.620
- Carter L, Neil HL, McCave IN. 2000. Glacial to interglacial changes in non-carbonate and carbonate accumulation in the SW Pacific Ocean New Zealand. Palaeogeogr Palaeoclimatol Palaeoecol. 162:333–356. doi: 10.1016/S0031-0182(00)00137-1
- Carter RM, McCave IN, Richter C, Carter L, et al. 1999. Site 1125: productivity under the subtropical convergence on North Chatham slope. Proc Ocean Drilling Program, Initial Reports. 181. doi:10.2973/odp.proc.ir.181.109.2000
- Chiswell SM, Bostock HC, Sutton PHJ, Williams MJM. 2015. Physical oceanography of the deep seas around New Zealand: a review. New Zeal J Mar Freshwat Res. 49:286–317. doi: 10.1080/00288330.2014.992918
- Clark PU, Archer D, Pollard D, Blum JD, Rial JA, Brovkin V, Pisias NG, Roy M., 2006. The middle Pleistocene transition: characteristics, mechanisms, and implications for long-term changes in atmospheric pCO2. Quaternary Sci Rev. 25:3150–3184. doi: 10.1016/j.quascirev.2006.07.008
- Conte MH, Sicre MA, Rühlemann C, Weber JC, Schulte S, Schulz-Bull D, Blanz T. 2006. Global temperature calibration of the alkenone unsaturation index (Uk’37) in surface waters and comparison with surface sediments. Geochem Geophy Geosy. 7:Q02005. doi:10.1029/2005GC001054
- Crundwell M, Scott G, Naish T, Carter L. 2008. Glacial-interglacial ocean climate variability from planktonic foraminifera during the Mid-Pleistocene transition in the temperate Southwest Pacific, ODP Site 1123. Palaeogeogr Palaeoclimatol Palaeoecol. 260:202–229. doi: 10.1016/j.palaeo.2007.08.023
- Exon NF, Kennett JP, Malone MJ, et al. 2001. Proceeding ODP, Initial Reports 189: College Station, TX (Ocean Drilling Program). doi:10.2973/odp.proc.ir.189.2001
- Eynaud F, Giraudeau J, Pichon JJ, Pudsey CJ. 1999. Sea-surface distribution of coccolithophores, diatoms, silicoflagellates and dinoflagellates in the South Atlantic Ocean during the late austral summer 1995. Deep-Sea Research I. 46:451–482. doi: 10.1016/S0967-0637(98)00079-X
- Findlay CS, Giraudeau J. 2002. Movement of oceanic fronts south of Australia during the last 10 ka: interpretation of calcareous nannoplankton in surface sediments from the Southern Ocean. Mar Micropaleontol. 46:431–444. doi: 10.1016/S0377-8398(02)00084-1
- Flores JA, Sierro FJ. 2007. Pronounced Mid-Pleistocene southward shift of the polar front in the Atlantic sector of the Southern Ocean. Deep-Sea Research II. 54:2432–2442. doi: 10.1016/j.dsr2.2007.07.026
- Gradstein FM, Ogg JG, Schmitz MD, Ogg GM. 2012. The Geologic Time Scale 2012, volume 1-2.
- Graham RM, De Boer AM. 2013. The great whirl: observations of its seasonal development and interannual variability. J Geophy Res Oceans. 118:1–13.
- Hall IR, McCave IN, Shackleton NJ, Weldon GP, Harris SE. 2001. Intensified deep Pacific inflow and ventilation in Pleistocene glacial times. Nature. 412:809–812. doi: 10.1038/35090552
- Hamilton LJ. 2006. Structure of the subtropical front in the Tasman Sea. Deep Sea Res Part I. 53:1989–2009. doi: 10.1016/j.dsr.2006.08.013
- Hayward BW. 2002. Late Pliocene to middle Pleistocene extinctions of deep-sea benthic foraminifera (“Stilostomella extinction”) in the Southwest Pacific. J Foraminiferal Res. 32:274–307. doi: 10.2113/32.3.274
- Hayward BW, Sabaa AT, Kolodziej A, Crundwell MP, Steph S, Scott GH, Neil HL, Bostock HC, Carter L, Grenfell HR. 2012. Planktic foraminifera-based sea-surface temperature record in the Tasman Sea and history of the subtropical front around New Zealand, over the last one million years. Mar Micropaleontol. 82-83:13–27. doi: 10.1016/j.marmicro.2011.10.003
- Heath RA. 1981. Oceanic fronts around southern New Zealand. Deep Sea Research Part A. 28:547–560. doi: 10.1016/0198-0149(81)90116-3
- Heath RA. 1985. A review of the physical oceanography of the seas around New Zealand – 1982. New Zeal J Mar Freshwat Res. 19:79–124. doi: 10.1080/00288330.1985.9516077
- Hiramatsu C, De Deckker P. 1997. The late Quaternary calcareous nannoplankton assemblages from three cores from the Tasman Sea. Palaeogeogr Palaeoclimatol Palaeoecol. 131:391–412. doi: 10.1016/S0031-0182(97)00013-8
- Howard WR, Prell WL. 1992. Late quaternary surface circulation of the southern Indian Ocean and its relationship to orbital variations. Paleoceanography. 7:79–117. doi: 10.1029/91PA02994
- Kemp AES, Grigorov I, Pearce RB, Naveira Garabato AC. 2010. Migration of the Antarctic polar front through the mid Pleistocene transition: evidence and climatic implications. Quaternary Sci Rev. 29:1993–2009. doi: 10.1016/j.quascirev.2010.04.027
- King AL, Howard WR. 2001. Seasonality of foraminiferal flux in sediment traps at Chatham Rise, SW Pacific: implications for paleotemperature estimates. Deep Sea Research Part I. 48:1687–1708. doi: 10.1016/S0967-0637(00)00106-0
- King AL, Howard WR. 2003. Planktonic foraminiferal flux seasonality in Subantarctic sediment traps: a test for paleoclimatic reconstructions. Paleoceanography. 18. doi:10.1029/2002PA000839
- Locarnini RA, Mishonov AV, Antonov JI, Boyer TP, Garcia HE, Baranova OK, Zweng MM, Johnson DR. 2010. World Ocean atlas 2009, volume 1: temperature. Levitus S editor. NOAA Atlas NESDIS 68. Washington (DC): U.S. Government Printing Office.
- Lourens LJ, Hilgen FJ, Laskar J, Shackleton NJ, Wilson D. 2004. The neogene period. In: Gradstein FM, Ogg JG, Smith AG, editors. A geologic time scale 2004. Cambridge (MA): Cambridge University Press; p. 409–440.
- Marino M, Maiorano P, Lirer F, Pelosi N. 2009. Response of calcareous nannofossil assemblages to paleoenvironmental changes through the Mid-Pleistocene Revolution at Site 1090 (Southern Ocean). Palaeogeogr Palaeoclimatol Palaeoecol. 280:333–349. doi: 10.1016/j.palaeo.2009.06.019
- Martínez-Garcia A, Rosell-Melé A, McClymont EL, Gersonde R, Haug GH. 2010. Subpolar link to the emergence of the modern equatorial pacific cold tongue. Science. 328. doi:10.1126/science.1184480
- McCartney MS. 1977. Subantarctic mode water. In: Angel MV, editor. A voyage of Discovery, Deep Sea Research. 24(supplement):103–119.
- McCave IN, Carter L, Carter R, Hayward BW. 2004. Cenozoic oceanographic evolution of the SW Pacific gateway: introduction. Mar Geol. 205:1–7. doi: 10.1016/S0025-3227(04)00015-5
- McClymont EL, Sosdian SM, Rosell-Melé A, Rosenthal Y. 2013. Pleistocene sea-surface temperature evolution: early cooling, delayed glacial intensification, and implications for the mid-Pleistocene climate transition. Earth-Sci Rev. 123:173–193. doi: 10.1016/j.earscirev.2013.04.006
- McIntyre A. 1967. Coccoliths as paleoclimatic indicators of Pleistocene glaciation. Science. 158:1314–1317. doi: 10.1126/science.158.3806.1314
- McIntyre A, Bé AWH. 1967. Modern coccolithophores of the Atlantic Ocean – I, Placoliths and cyrtoliths. Deep-Sea Res. 14:561–597.
- Morley JJ. 1989. Variations in high-latitude oceanographic fronts in the Southern Indian Ocean: an estimation based on faunal changes. Paleoceanography. 4:547–554. doi: 10.1029/PA004i005p00547
- Mudelsee M, Stattegger K. 1997. Exploring the structure of the mid-Pleistocene revolution with advanced methods of time-series analysis. Geol Rundsch. 86:499–511. doi: 10.1007/s005310050157
- Naish T, Powell R, Levy R, Wilson G, Scherer R, Talarico F, Krissek L, Niessen F, Pompilio M, Wilson T, et al. 2009. Obliquity-paced Pliocene West Antarctic ice sheet oscillations. Nature. 458:322–328. doi: 10.1038/nature07867
- Orsi AH, Whitworth T, Nowlin WD. 1995. On the meridional extent and fronts of the Antarctic circumpolar current. Deep-Sea Research. 42:641–673. doi: 10.1016/0967-0637(95)00021-W
- Pelejero C, Calvo E, Barrows TT, Logan GA, De Deckker P. 2006. South Tasman sea alkenone palaeothermometry over the last four glacial/interglacial cycles. Mar Geol. 230:73–86. doi:10.1016/j.margeo.2006.04.004
- Pollard D, DeConto RM. 2009. Modeling West Antarctic ice sheet growth and collapse through the past five million years. Nature. 458:329–332. doi: 10.1038/nature07809
- Ridgway KR, Dunn JR, Wilkin JL. 2002. Ocean interpolation by four-dimensional weighted least squares – Application to the waters around Australasia. J Atmos Ocean Tech. 19:1357–1375. doi:10.1175/1520-0426(2002)
- Ridgway KR, Godfrey JS. 1994. Mass and heat budgets in the East Australian current: a direct approach. J Geophy Res. 99:3231–3248. doi:10.1029/93JC02255
- Rintoul SR, Donguy JR, Roemmich DH. 1997. Seasonal evolution of upper ocean thermal structure between Tasmania and Antarctica. Deep Sea Research Part I. 44:1185–1202. doi:10.1016/S0967-0637(96)00125-2
- Rodriguez-Sanz L, Mortyn PG, Martinez-Garcia A, Rosell-Melé A, Hall IR. 2012. Glacial Southern Ocean freshening at the onset of the middle Pleistocene climate transition. Earth Planet Sci Lett. 345-348:194–202. doi: 10.1016/j.epsl.2012.06.016
- Sabaa AT, Sikes EL, Hayward BW, Howard WR. 2004. Pliocene sea surface temperature changes in ODP Site 1125, Chatham Rise, East of New Zealand. Mar Geol. 205:113–125. doi: 10.1016/S0025-3227(04)00020-9
- Schaefer G, Rodger JS, Hayward BW, Kennett JP, Sabaa AT, Scott GH. 2005. Planktic foraminiferal and sea surface temperature record during the last 1 Myr across the Subtropical Front, Southwest Pacific. Mar Micropaleontol. 54:191–212. doi: 10.1016/j.marmicro.2004.12.001
- Sicre MA, Ternois Y, Paterne M, Martinez P, Bertrand P. 2001. Climatic changes in the upwelling region off Cap Blanc, NW Africa, over the last 70 kyear: a multi-biomarker approach. Org Geochem. 32:981–990. doi: 10.1016/S0146-6380(01)00061-4
- Sierro FJ, Hodell DA, Curtis JH, Flores JA, Reguera I, Colmenero-Hidalgo E, Bárcena MA, Grimalt JO, Cacho I, Frigola J, et al. 2005. Impact of iceberg melting on Mediterranean thermohaline circulation during Heinrich events. Paleoceanography. 20:PA2019. doi: 10.1029/2004PA001051
- Sikes EL, Howard WR, Neil HL, Volkman JK. 2002. Glacial-interglacial sea surface temperature changes across the subtropical front east of New Zealand based on alkenone unsaturation ratios and foraminiferal assemblages. Paleoceanography. 17:2-1–2-13. doi:10.1029/2001PA000640
- Sikes EL, Howard WR, Samson CR, Mahan TS, Roberston LG, Volkman JK. 2009. Southern Ocean seasonal temperature and Subtropical Front movement on the South Tasman Rise in the late Quaternary. Paleoceanography. 24. doi:10.1029/2008PA001659
- Sikes EL, Nodder SD, O’Leary T, Volkman JK. 2005. Alkenone temperature records and biomarker flux at the subtropical front of the Chatham Rise, SW Pacific Ocean. Deep Sea Research Part I. 52:721–748. doi: 10.1016/j.dsr.2004.12.003
- Smith RO, Vennell HC, Bostock HC, Williams MJM. 2013. Interaction of the subtropical front with topography around New Zealand. Deep Sea Research I. 76:13–26. doi: 10.1016/j.dsr.2013.02.007
- Stant SA, Lara J, McGonigal KL, Ladner BC. 2004. Quaternary nannofossil biostratigraphy from Ocean Drilling Program Leg 189, Tasmanian Gateway. In: Exon NF, Kennett JP, Malone MJ, editors. Proceeding ODP Scientific Results. 189.
- Stickley CE, Brinkhuis H, McGonigal KL, Chaproniere GCH, Fuller M, Kelly DC, Nürnberg D, Pfuhl HA, Schellenberg SA, Schoenfeld J, et al. 2004. Late cretaceous–quaternary biomagnetostratigraphy of ODP Sites 1168, 1170, 1171, and 1172, Tasmanian Gateway. In: Exon NF, Kennett JP, Malone MJ, editors. Proceedings of the Ocean Drilling Program, Scientific Results. 189:1–57.
- Tilburg CE, Hurlburt HE, O’Brien JJ, Shriver JF. 2001. The dynamics of the East Australian current system: the Tasman front, the East Auckland current and the East Cape current. J Phys Oceanogr. 31:2917–2943. doi: 10.1175/1520-0485(2001)031<2917:TDOTEA>2.0.CO;2
- Venuti A, Florindo F, Michel E, Hall IR. 2007. Magnetic proxy for the deep (Pacific) western boundary current variability across the mid-Pleistocene climate transition. Earth Planet Sci Lett. 259:107–118. doi: 10.1016/j.epsl.2007.04.032
- Weaver PPE, Carter L, Neil HL. 1998. Response of surface water masses and circulation to late quaternary climate change east of New Zealand. Paleoceanography. 13:70–83. doi: 10.1029/97PA02982
- Winter A, Reiss Z, Luz B. 1979. Distribution of living coccolithophore assemblages in the Gulf of Elat (Aqaba). Mar Micropaleontol. 4:197–223. doi: 10.1016/0377-8398(79)90017-3