
 ?Mathematical formulae have been encoded as MathML and are displayed in this HTML version using MathJax in order to improve their display. Uncheck the box to turn MathJax off. This feature requires Javascript. Click on a formula to zoom.
Abstract
The accurate prediction of the fluid flow mass and the heat transfer process as well as the system response during reflood transients has long been a critical and challenging issue for reactor system safety analyses. Accurate characterization of the flow and energy transport can also significantly facilitate the various system/component design and optimization tasks. In the current study based on the U.S. Nuclear Regulatory Commission/Pennsylvania State University Rod Bundle Heat Transfer (RBHT) reflood experimental data, a comprehensive uncertainty analysis framework is developed using DAKOTA. The developed framework is used to perform an in-depth reflood model validation and verification for the subchannel analysis code COBRA-TF. In the meantime, the artificial intelligence (AI)–based machine learning (ML) model for rod cladding temperature prediction during reflood is also developed and evaluated using the current framework. Key input parametric effects for reflood thermal-hydraulic prediction include the system pressure, inlet liquid temperature/enthalpy, inlet mass flow rate, and average bundle power input. The figure of merit under consideration is the peak cladding temperature variations. It is found in the current study that, while further model improvement is needed, COBRA-TF can predict the correct parametric trends when compared with the RBHT data. On the other hand, it is challenging for the pure AI-based ML models to correctly reflect the parametric trends. Suggestions for future ML model development are provided in the end.
I. INTRODUCTION
Maintaining reactor core integrity and coolability during postulated design-basis accidents (DBAs) has always been a crucial issue in reactor safety analysis, both for the legacy fleet and new builds. However, the underlying physics involved in such cooling transients are still unclear due to extremely complex thermal-hydraulic responses between the fuel performance and fluid flow mass and heat transfer. For light water reactors (LWRs), the reactor pressure vessel safety injection following a DBA typically leads to vigorous two-phase boiling phenomenon in the core region, which further dictates the fuel peak cladding temperature (PCT). As a result, accurate prediction of the two-phase flow behavior and the fuel rod thermal-hydraulic response during reflood are of crucial importance in assessing the safety of the nuclear reactor system. Moreover, reliable simulation of the accident scenario as well as timings for key thermal-hydraulic quantities, such as the PCT and quenching, are needed to provide informative guidance for in-depth probabilistic risk assessment study.
In order to have a better understanding of the fundamental physics involved during reflood, tremendous efforts and resources have been spent to conduct thermal-hydraulic experiments that simulate the reflood transients of a loss-of-coolant accident (LOCA), including THETIS (CitationRefs. 1, Citation2, and Citation3), FEBA (CitationRef. 4), SELFEX (CitationRefs. 5 and Citation6), ACHILLES (CitationRef. 7), QUENCH (CitationRefs. 8 and Citation9), FLECHT-SEASET (CitationRefs. 10 and Citation11), and most recently, the Rod Bundle Heat TransferCitation12,Citation13 (RBHT). Using these experimental data, many numerical analyses and thermal-hydraulic code evaluations, as well as code uncertainty quantifications (UQs), have been carried out by previous researchers. The different system and/or subchannel analysis codes used include but are not limited to SPACE (CitationRef. 14), TRACE (CitationRefs. 15 through 21), RELAP5 (CitationRefs. 16, Citation22, and Citation23), RELAP/SCDAPSIM (CitationRef. 24), CATHARE2 (CitationRef. 25), MARS (CitationRefs. 26 and Citation27), SOCRAT/V3 (CitationRef. 28), COBRA-TF (CitationRefs. 29 through 35), etc. Most of these codes were developed based on a two-fluid three-field (liquid, vapor, and droplets) scheme, with each field having its own set of conservation equations and closures. However, owing to the fact that very limited experimental data are available for code validation, especially for the post-dryout regime and quench front region where measurements are difficult, an in-depth as well as high-resolution representation and characterization of the fluid flow and heat transfer process is very challenging.
In addition, along with the advances in modern computational science and optimization theory, the artificial intelligence (AI)– and machine learning (ML)–based regression techniques, as well as data-driven models, are quickly drawing attention as an alternative approach to the conventional predictive methods. The ML approach, as compared with conventional numerical analysis tools, has unique strength in tackling complicated and nonlinear problems with quick convergence speed. It has the potential to handle large amounts of data and can be applied to gain valuable insights from the system-state variables (i.e., inputs and outputs) in an unsupervised fashion, which makes it very suitable for solving multiscale multiphysics engineering problems involving two-phase flow mass and heat transfer. Machine learning utilizes available data for a specific system operation to obtain mathematical relationships between the system-state variables, albeit with limited knowledge of the physical/mathematical interdependence between such variables. Learning from data is the main feature of the data-driven model, where the mathematical interdependence between the system inputs and outputs is discovered iteratively through minimizing the deviation between observed and estimated values.Citation36 However, the application of AI-based ML techniques in nuclear engineering is still limited and has been recognized only recently as a promising research field.Citation37 To accelerate its application, rigorous and thorough evaluation of its capability of capturing the underlying physics of the actual process, like reflood, is desperately needed. A number of researchers have investigated the feasibility of applying ML techniques in predicting key thermal-hydraulic and safety parameters in nuclear engineering, including Kim et al.Citation38 for narrow rectangular channel applications, Jin et al.Citation39,Citation40 and Zhao et al.Citation41 for critical heat flux (CHF) model development based on domain knowledge–informed ML in various channel geometries, and Park et al.Citation42 for wall temperature prediction at CHF, as well as He and LeeCitation43 for CHF table construction using a support vector machine.
As part of the fundamental principles for quality assurance, verification and validation (V&V) on the accuracy, sensitivity, and uncertainty of the best estimate thermal-hydraulic models have long been the heart of reactor system transient and safety analysis. Rigorous V&V assessment of the thermal-hydraulic models is expected to further improve the code capability as well as the safety margin of nuclear reactors.
Regulatory guidelines [RG 1.157 and later RG 1.203 (CitationRef. 44)] issued by the U.S. Nuclear Regulatory Commission (NRC) streamline code application to comply with Appendix K of 10 CFR 50-46. Several international code benchmark and assessment projects led by the Organisation for Economic Co-operation and Development (OECD) Nuclear Energy Agency (NEA) have been launched since the early 1980s, including the Uncertainty Methods Study,Citation45 BEMUSE (CitationRef. 46), and Post-BEMUSE Reflood Models Input Uncertainty Methods.Citation47 Several topics related to uncertainty and sensitivity were investigated in these projects. Different best estimate plus uncertainty (BEPU) analysis approaches were formulated, such as the code scaling, applicability, and uncertainty (CSAU) method,Citation48 evaluation model development and assessment process (EMDAP) method,Citation44 generation random sampled (GRS) method,Citation49 uncertainty methodology based on accuracy extrapolation (UMAE) method,Citation50 etc. One of the most important issues found from these previous campaigns is related to the resolution, quality, and completeness of the experimental database used. On the one hand, the definition of representative experiments for model uncertainties quantification and the treatment of experimental uncertainties has a significant effect on the results. On the other hand, scaling of uncertainty limits as well as input parameters from small to large scale is often challenging. As a result, more reliable benchmark experiments with advanced instrumentation as well as comprehensive V&V assessment for thermal-hydraulic models are necessary. Beside the forward UQ methods mentioned in recent days, the inversed UQ is gaining more and more attention in the nuclear community, and extensive investigation and application have been followed.Citation51–53 With inverse UQ, the information flow is from the model outputs and experimental data to the inputs, such that the input statistics, including statistical moments, probability density functions (pdf’s), and upper and lower bounds, can be obtained.
In the current study, based on the unique NRC/Pennsylvania State University (PSU) RBHT experiments, a detailed uncertainty analysis is performed for the reflood thermal-hydraulic models used in COBRA-TF. Also explored in this study are the AI-based ML techniques for predicting reflood transients. The major objective of the current work is to develop a complete uncertainty analysis framework that can be used to evaluate the various model prediction capabilities for the reactor core reflood transient simulations. Based on the results, recommendations for future code improvements are proposed. In addition, the model performance based on ML techniques is evaluated and discussed in detail, which can be extremely useful for further ML model V&V, as these ML models can be potentially incorporated into existing numerical tools to further improve the prediction performance in terms of accuracy and efficiency.
II. NRC/PSU RBHT BENCHMARK DATA
The NRC/PSU RBHT test facility is designed to conduct thermal-hydraulic experiments in a 7 × 7 rod bundle geometry, reproducing the fluid flow and heat transfer process during reactor core normal operation condition and/or accident scenarios for LWRs (CitationRefs. 12 and Citation13). The comprehensive and high-quality data obtained could also be useful for the design and analysis of advanced nuclear systems such as small modular reactors. shows a sketch of the RBHT facility layout. The main system components include the boiler, water supply tank, injection pump, full-length test section with upper and lower plenum, carryover tanks, steam separator, and pressure oscillation damping tank.
Fig. 1. Configuration of the NRC/PSU RBHT test facility.
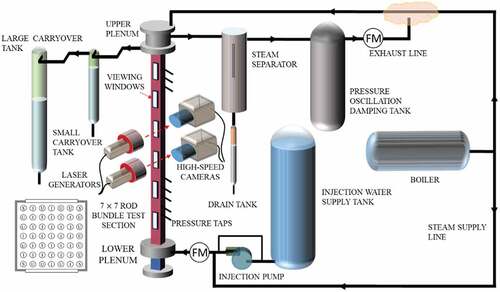
The test section is encompassed by a square-shaped flow housing made of Inconel 600. It has a 7 × 7 rod bundle assembly with 45 heated rods and four unheated support rods. A linear axial power distribution with a peak at 2.74 m is applied to the bundle with a designed power peaking ratio of 1.5. Each heater rod has an outer diameter of 9.5 mm and a rod pitch of 12.6 mm. There are six pairs of quartz windows located on the flow housing for flow visualization and seven spacer grids to maintain the structure integrity. There are 256 thermocouples (TCs) mounted inside the heater rods and additional TCs on the flow housing and lower/upper plenum as well as on the spacer grids to monitor the temperature variations for various components. The test section is also equipped with 22 differential pressure cells and 13 stand-off penetrations for pressure drop and vapor temperature measurement, respectively. In addition, two sets of advanced laser imaging systems are installed for two-phase flow measurement and analysis. The imaging systems are capable of analyzing the liquid droplet velocity/size distribution in the vapor flow. A detailed description of each test component, instrumentation, and droplet measurement configuration, as well as their measurement uncertainties, can be found in Hochreiter et al.Citation12,Citation13, Kim et al.,Citation54 and Jin et al.Citation55–57
In the current study, two RBHT reflood experiments are selected as the benchmark set for UQ analysis. shows the test conditions.Citation58 Both tests have the same upper plenum system pressure, bundle power input, and inlet liquid temperature. However, experiment (exp.). 8009 has a lower inlet liquid mass flow rate and lower initial rod bundle cladding temperature to start with.
TABLE I Test Conditions for Selected RBHT Experiments*
III. DEVELOPMENT OF THE ANALYSIS FRAMEWORK
In the current study, a comprehensive uncertainty analysis framework was developed to investigate the reflood model performance based on the COBRA-TF and ML model predictions. This section first introduces the COBRA-TF code and ML techniques used in the current study, followed by a discussion of the BEPU approach. A complete analysis framework is developed based on the DAKOTA UQ analysis code.
III.A. Nuclear Reactor Thermal-Hydraulic Analysis Code COBRA-TF
COBRA-TF uses a two-fluid three-field (i.e., liquid field, vapor field, and droplet field) solution scheme for the flow field. Each field is characterized with its own set of conservation equations. These equations are solved simultaneously using the Semi-Implicit Method for Pressure-Linked Equations or SIMPLE algorithm.
COBRA-TF’s heat transfer package consists of a library of correlations as well as a selection logic that allows the code to predict the complete boiling curve as a function of the computational cell thermal-fluid quantities, such as the void fraction, pressure, mass flow, and heated surface temperature. There is a complete set of criteria incorporated into COBRA-TF for selecting different heat transfer regimes as needed. The heat transfer package calculates both the wall-to-fluid heat transfer as well as the interfacial heat transfer between the phases. Since separate energy equations are used for the phases, it has the capability of capturing the possible thermal-hydraulic nonequilibrium of the flow. Therefore, the interfacial heat transfer area and the interfacial heat transfer are calculated to determine the temperature of each phase. It is worth mentioning that based on the value of the wall surface temperature compared with the CHF temperature, the COBRA-TF heat transfer and flow regime is further divided into the so-called “normal wall” and “hot wall” regimes. Different flow regime maps are then applied according to the division. It is also capable of simulating the droplet entrainment/de-entrainment dynamics as well as its breakup process on spacer grids
presents the COBRA-TF modeling strategy for the RBHT test section, which is the same as the previous study.Citation34 Three sections, shown in , were used in the current numerical analysis model. Section 1 (containing four subchannels and 31 axial nodes) models the heated length of the test section. Section 2 (containing four subchannels and two axial nodes) and section 3 (containing one subchannel and two axial nodes) model the upper plenum component. Transport parameters between the sections are properly defined for the code. In addition, mass and heat transfer across the subchannels within each section are also defined by the “transversal gap” input according to the actual RBHT geometry. For each subchannel, a certain number of heated rods and unheated structures, shown in , are specified, including the spacer grids, unheated corner rods, and flow housing. Both the heated structures and the unheated structures have been further divided into several radial temperature nodes to account for heat conduction within the geometry. The inlet boundary conditions are the flooding rate and inlet liquid enthalpy. The outlet boundary conditions are specified as the pressure boundary. On the other hand, the initial cladding temperature and flow housing temperature were specified according to the RBHT experiments.
Fig. 2. COBRA-TF model for the RBHT test section: (a) nodalization for test section and (b) cross section of rod bundle.
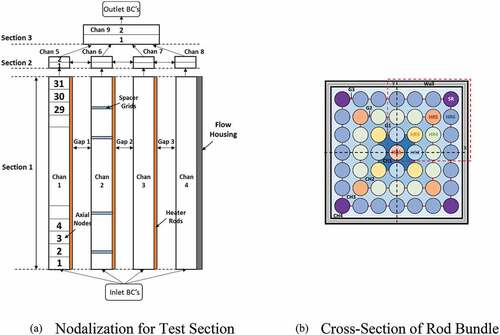
Based on the COBRA-TF calculations, the rod cladding temperature variations at the 106-in. (2.69-m) location from the test section inlet and the corresponding quench front propagations during reflood are investigated and compared with RBHT data in detail.
III.B. Machine Learning Techniques
Several AI-based ML techniques have been developed over the past decades, including various regression models, artificial neural networks (ANNs), and cluster analyses,Citation59–62 of which the ANN shows superior efficiency in uncovering complex relationships between system inputs and outputs.Citation63,Citation64 Examples include the feedforward backpropagation ANN (CitationRef. 65), the convolutional neural networkCitation66 (CNN), and the recurrent neural networkCitation67 (RNN) with its different variants, including the long short-term memory (LSTM) networks. The feedforward backpropagation ANN is the simplest type of ANN and is typically used when the information/signal is moving in one direction (i.e., inputs are used to predict a set of outputs).Citation68 The CNN uses different topology of data to mainly analyze visual data sets. The RNN is typically used when the order dependence of a sequence is of interest. Beside these ANN structures, another ML method tested in the present study is the tree-based random forest (RF), a fast and reliable ML tool that requires minimal hyperparameter tuning and feature engineering.
shows the general training process of a typical ML technique. After feature engineering that cleans and explores the raw data set, the input data are then prepared in a standard format to be fed into the learning algorithm. In the modeling process, various algorithms (e.g., ANN, RF, etc.) are used to develop and train the models based on the training data set, generating ML model–predicted results
. The validation data set
is then used to validate and tune the models until the loss function is sufficiently small.
Fig. 3. Typical ML technique framework.
The feedforward ANN is essentially a collection of layers (at least three layers: input, hidden, and output) with fully connected units (see for a sample architecture) capable of nonlinear mapping via activation functions (e.g., “step function,” “ramp function,” or “sigmoid function”) between two layers. The basic operation of a simple unit (or a neuron) for the ANN framework is represented in EquationEq. (1)
(1)
(1) mathematically:
Fig. 4. Typical feedforward ANN example of a 3/4/4/1 architecture.
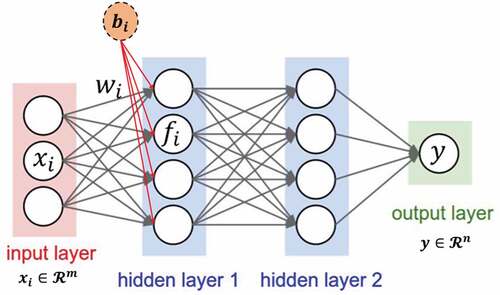
where is the output of a specific neuron in the current layer. Weights
and biases
for neurons in the previous layer are randomly initiated from a uniform distribution and iteratively updated during training by the backward propagation algorithm using Stochastic Gradient Descent or Adaptive Moment Estimation (ADAM). The training process is repeated for certain times (epochs) such that the errors (e.g., “mse,” “logcosh,” etc.) are adequately reduced. To ensure generalization (i.e., to prevent overfitting), various regularization techniques such as dropoutCitation69 or early stoppingCitation70 can be applied to help reduce the test error.
Random forests or random decision forests is an ensemble learning method for classification, regression, and other tasks that operates by constructing a multitude of decision trees at training time. For classification tasks, the output of the RF is the class selected by most trees. For regression tasks, the mean or average prediction of the individual trees is returned. By randomly selecting observations and features with the bootstrap aggregation technique (also known as bagging, a model averaging approach that is designed to improve accuracy, prevent overfitting, and reduce variance), multiple decision trees are aggregated and their predictions are then averaged, as depicted in .
Fig. 5. Simplified RF structure.
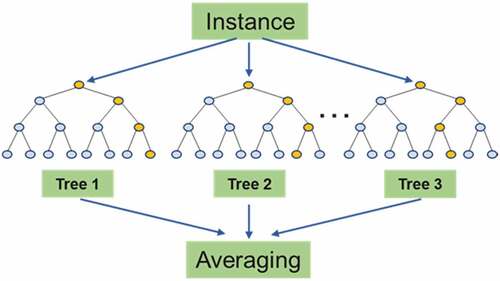
Random forest is selected in the current investigation because it is a fast, flexible, ensemble learning method that produces robust results without much tuning of hyperparameters.Citation71 It can handle binary features, categorical features, and numerical features with high dimensions. There is very little preprocessing and the data do not need to be rescaled or transformed. In addition, RF is able to handle unbalanced data with a relatively low bias, generating robust predictions even if the data have outliers or are nonlinear.
The input parameters for the current ML model developed are determined according to the RBHT reflood experiments, i.e., system upper plenum pressure, inlet coolant mass flow rate, inlet coolant temperature/enthalpy, bundle average power, quench front location with its corresponding time, and the initial clad temperature at the 106-in. (2.69-m) axial location. Note that this is different from the COBRA-TF simulation, where the quench front propagation is predicted by the calculations. The ML model output is selected to be the transient cladding temperature variation at the 106-in. (2.69-m) location, based on which its PCT could be further obtained. During the training process, there are in total 60+ RBHT reflood tests (in total 398 010 data points covering the entire reflood transients with various system conditions) collected and processed.Citation58 In order to evaluate the overall model performance of the reflood model constructed by the ML models, a 10% subset (in total 403 09 data points) was retained for the final model testing. The performance of the final predicted output is evaluated by its mean and standard deviation, as well as by the relative root-mean-square error (rRMSE):
where is the size of the data set.
III.C. BEPU Approach Overview
In recent years, nonparametric statistics have become the method of choice being applied to several uncertainty studies in the nuclear industry.Citation72–75 The UQ method adopted in the present work includes three steps:
1. Characterizing input uncertainties where the input parameters that are important to the phenomena of interest (post-dryout heat transfer, cladding mechanical behavior, etc.) are selected based on the RBHT measurement uncertainty while their uncertainty ranges and distributions are also determined carefully.
2. Forward propagating these uncertainties through a computational model in which extensive code calculations are performed in order to achieve certain statistical requirements.
3. Performing statistical or interval assessments on the resulting responses.
This process determines the effect of uncertainties and assumptions on model outputs. Also note that, in the current analysis, only the forward UQ method is adopted and only the model uncertainty is considered.
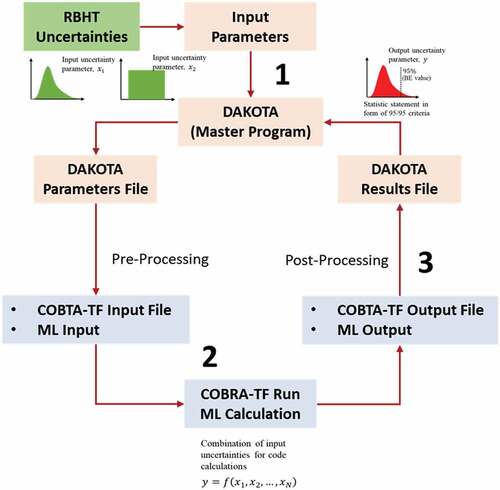
shows the developed UQ framework. The input uncertainties determined by experiments can be propagated though the COBRA-TF/ML-DAKOTA interface into the calculations. The DAKOTA code, developed and maintained by Sandia National Laboratories, is a multilevel parallel object-oriented framework for design optimization, parameter estimation, uncertainty quantification, and sensitivity analysis.Citation76 For its UQ capability, DAKOTA primarily focuses on the forward propagation of uncertainties and analysis parts of the process, where probabilistic or interval information on parametric inputs is mapped through the computational model to assess statistics or intervals on the figures of merit (FOMs) selected. On the other hand, DAKOTA also has emerging methods for inference or inverse UQ, such as Bayesian calibration, that will help with step 1 by obtaining a statistical characterization of input parameters based on provided experimental data.
Fig. 6. COBRA-TF/ML-DAKOTA coupled UQ framework.
In terms of LWRs during a LOCA, the criteria for the successful application of emergency core cooling systems is based on several key parameters formulated in 10 CFR 50-46. Therefore, the maximum PCT variation is taken as the FOM in the current analysis to evaluate the developed UQ framework as well as the capability of the reflood models.
shows the four key input parameters and their corresponding distributions and uncertainty ranges selected based on the actual RBHT experiments. These input parameters include system pressure measured at the test section upper plenum, bundle power input (represented as the average power per unit length and/or total power), inlet liquid temperature (enthalpy) and/or subcooling, and inlet liquid mass flow rate or velocity. Uncertainties for these parameters have normal distributions.
In the current work, once the input parameters are identified, the Monte Carlo sampling (random sampling) method is used to reproduce their original uncertainty distributions. With each of their corresponding uncertainty ranges specified in the DAKOTA input file, all four input parameters as identified in are sampled simultaneously to generate groups of inputs of a desired number. These input parameter uncertainties are then propagated into COBRA-TF and ML calculations through DAKOTA’s preprocessing capability. Once completed, the DAKOTA master program automatically launches the UQ calculations, gathering all the results of interest after completion of each case and starting the next case in line. When all the cases are completed, DAKOTA generates a result file and performs various statistical analyses through its powerful post-process capability.
To achieve a high confidence level, in the present study the total sample size is selected to be 100 for COBRA-TF and 200 for ML calculations to determine the cladding temperature prediction envelope. Based on the two-sided Wilk’s formula, a sample size of 100+ is sufficient to satisfy the 95/95 statistical requirement.Citation77 The current calculation also uses the parallel computing scheme provided by DAKOTA to further reduce the computational time.
TABLE II Uncertainties for Selected Input Parameters for the RBHT Tests
IV. RESULTS AND DISCUSSION
The major findings of the present work, including the results of the COBRA-TF calculations and ML model predictions that utilized the NRC/PSU RBHT benchmark data, are presented in this section.
IV.A. Results for COBRA-TF Predictions
A total of 100 COBRA-TF simulations with the Monte Carlo–sampled input parameters were performed for exps. 8009 and 7123. Their corresponding rod cladding temperature and quench front variations are shown in , respectively. For exp. 8009, COBRA-TF initially captures the clad temperature variation at the 106-in. (2.69-m) location for the first ~50 s. However, it underpredicts the temperature thereafter, and the experimentally measured temperature is out of the envelope, indicating that the post-dryout flow and heat transfer models need to be further improved to correct this bias. In addition, it can be seen that COBRA-TF predicts a faster rod quench than the experimental data for exp. 8009, and the top-down quench reported by the code did not happen in the actual test. As discussed in Jin et al.,Citation34 the top-down quench model incorporated in COBTA-TF tends to predict higher liquid deposition and vapor condensation at the top of the test section. This behavior should be further validated by experiments the model should be improved as needed.
Fig. 7. COBRA-TF–predicted cladding temperature and quench front location (exp. 8009).
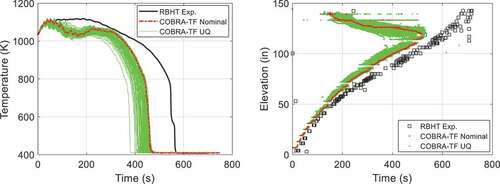
Fig. 8. COBRA-TF–predicted cladding temperature and quench front location (exp. 7123).
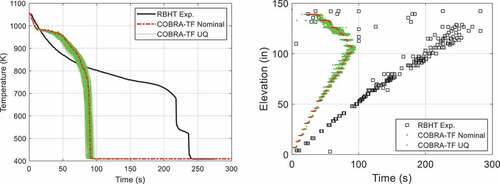
On the other hand, relatively larger prediction errors are observed for exp. 7123, which has a high flooding rate as compared to exp. 8009. After initial agreement within the first ~10 s, COBRA-TF tends to overpredict the rod cladding temperature and reports much early rod quench. This is mainly due to the inadequacy of the heat transfer model used in the current COBRA-TF code. For exp. 8009 with 1 in./s (2.54 cm/s) flooding velocity, the flow pattern at the quench front location has been confirmed to be the annular mist flow regime. While for exp. 7123 with 4 in./s (10.16 cm/s) flooding velocity, the flow pattern at the quench front is observed to be the inverted annular flow regime. Evidently, compared to the annular flow heat transfer, the models used for the inverted annular flow heat transfer, such as the liquid column breakup and droplet formation, the transition boiling heat transfer, inverted film boiling heat transfer, and direct wall and droplet heat transfer, should be further improved.
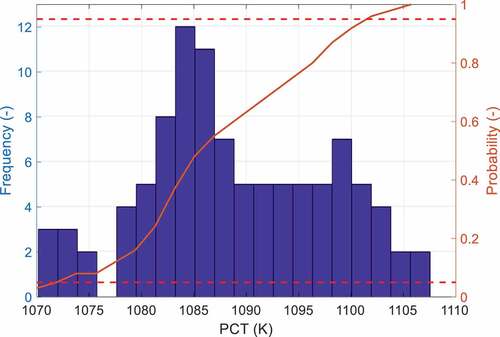
Based on the COBRA-TF UQ calculations, it is possible to further obtain the predicted clad PCT distribution as well as the various parametric effects on PCT. shows the obtained PCT distribution for exp. 8009. The PCT distribution for exp. 7123 is not presented in the current study since its PCT is basically the initial rod cladding temperature because a higher inlet mass flow rate will cool down the rods immediately after injection. For exp. 8009, it can be seen that the predicted PCT values generally follow a normal distribution with mean value and standard deviation
, and the BEPU reported 95/95 PCT value is 1111.0 K. On the other hand, the actual rod PCT for exp. 8009 at the 106-in. (2.69-m) axial location is measured to be 1117.6 K. As a result, for exp. 8009 COBRA-TF underpredicts the PCT value by about 7 K based on a 95/95 criteria, which provides a good estimation of the actual scenario. However, it should be noted that the predicted PCT time by COBRA-TF is different as compared to the actual PCT time, which can be seen from .
Fig. 9. COBRA-TF–predicted PCT distribution (exp. 8009).
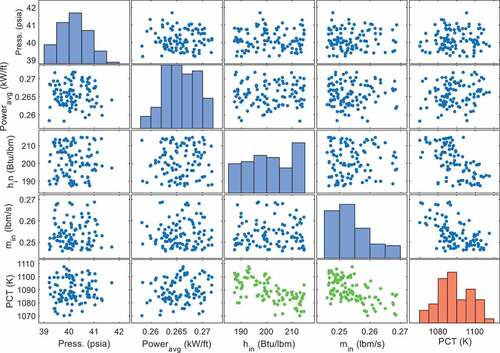
further shows the scatter plot of parametric effects for the four inputs on the final PCT variation predicted. While the uncertainties of system pressure and bundle power have a minor effect on the PCT, both the inlet liquid temperature/enthalpy and the mass flow rate are found to have a negative effect on the PCT variations. With a higher inlet liquid temperature/enthalpy and a higher mass flow rate, the predicted PCT is lower, as expected.
Fig. 10. COBRA-TF scatter plot for parametric effects on PCT (exp. 8009).
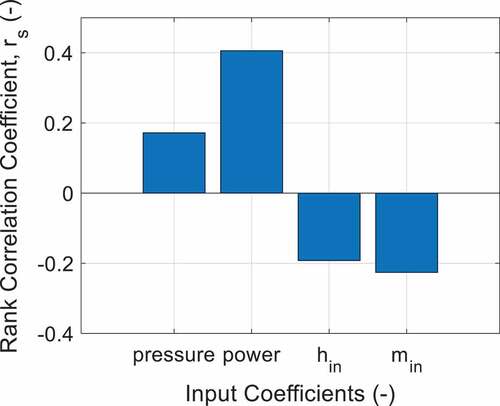
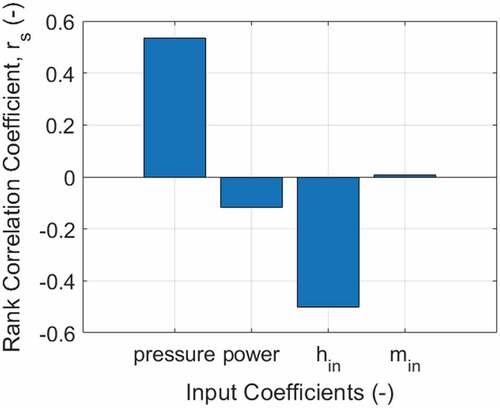
In order to quantitatively investigate the different input parameter effects, their corresponding spearman’s rank correlation coefficients are further calculated and plotted in . It can be seen that the inlet liquid enthalpy and mass flow have a relatively strong negative effect on the PCT, while the other two inputs, i.e., the system pressure and bundle power input, have relatively small but positive effects on the PCT.
Fig. 11. Spearman’s rank correlation coefficients for COBRA-TF prediction (exp. 8009).
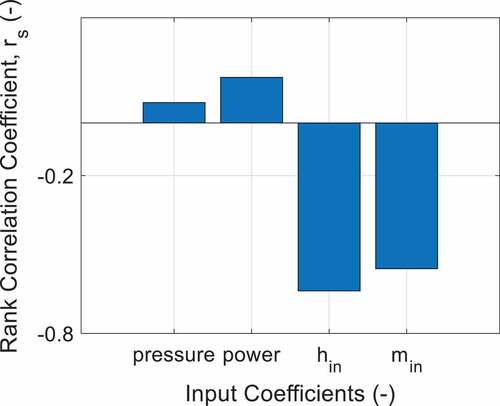
To compare these parametric trends obtained by COBTA-TF with the actual experimental behavior, a similar spearman’s rank correlation coefficients plot can also be generated based on the RBHT reflood data set with various system conditions, as shown in .
Fig. 12. Spearman’s rank correlation coefficients for RBHT test (exp. 8009).
It can be observed that COBRA-TF generally can reproduce the correct parametric trends in terms of the four input parameters selected. However, their relative importance with respect to the PCT is somewhat different when compared with the actual experimental data. Nevertheless, it should be noted that the parametric trends obtained in the current study for COBRA-TF were obtained by perturbing the input parameters through forward propagation UQ analysis of a specific test condition, i.e., exp. 8009, with specified uncertainty distributions. The parametric trends for the RBHT tests, on the other hand, were obtained from different reflood tests of varying system conditionsCitation58 (60+ reflood tests). As a result, it is expected that the relative importance of each of these input parameters would be different. In the future, the COBRA-TF dependency on various flow and heat transfer models should be further investigated and improved to reflect the accurate parametric trends during reflood transients.
IV.B. Results for ML Model Predictions
As mentioned in Sec. III.B, a feedforward ANN model and RF model were developed and trained based on the unique and comprehensive RBHT data set. After extensive model structure and hyperparameter optimization, it was decided that the ML model architectures for the ANN is 5/32/64/32/1 with an ADAM optimizer (learning rate = 0.001), “ReLU” activation, no regularization, and a dropout rate for each layer of 0.1. For the RF it is 65 trees/estimators with 50% to 70% features in each individual tree and no regularization. In order to ensure a direct comparison between different models in the following UQ analysis, the model architectures are fixed during the entire training process. In addition, to avoid the potential overfitting problem, both the RF and ANN are trained using the 10-fold cross-validation technique.
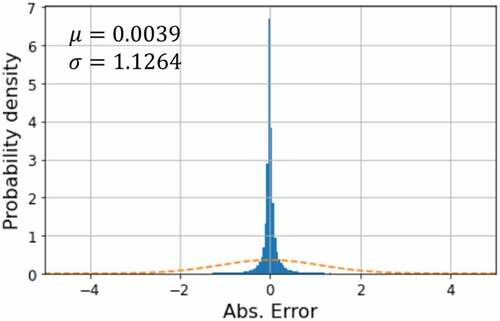
show the cladding temperature predicted by the training set and validation set for the ANN and RF ML model developed. Compared with the previous COBRA-TF reflood study performed by Jin et al.,Citation34 where the code reported a 15% prediction error for the post-dryout regime cladding temperature prediction and a strong tendency of predicting early quench, the current ML learning ANN and RF models developed were found to be able to further improve the prediction accuracy. For the ANN model, the post-dryout PCT prediction error is reduced to within 10% while a slightly larger error exists for the PCT prediction during quench. For the RF model, on the other hand, the predicted PCT values are all well within the 10% error span, indicating that the RF approach has superior capability in developing the cladding temperature model during the reflood period. For the models developed in the current work, the prediction errors have a mean value of −9.0353 K and a standard deviation of 15.2660 K for the ANN and 0.0039 K and 1.1264 K for the RF, respectively. In terms of the rRMSE, the ANN is 0.01967 and the RF is 0.00173. As a result, the developed ML models with specified architectures are indeed able to further improve the prediction accuracy and statistics. In addition, the RF has slightly better statistics than the ANN.
Fig. 13. PCT prediction for ANN training and validation data set.
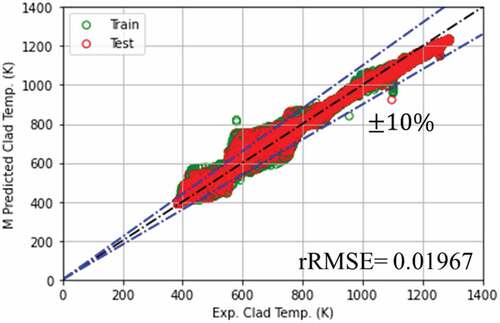
Fig. 14. Statistics for ANN PCT prediction errors.
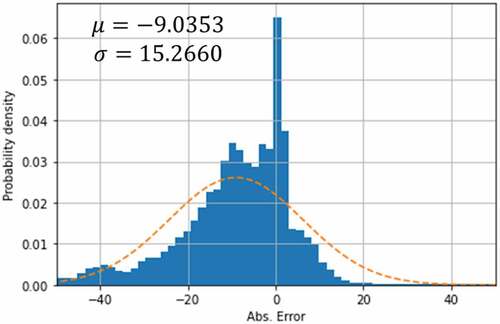
Fig. 15. PCT prediction for RF training and validation data set.
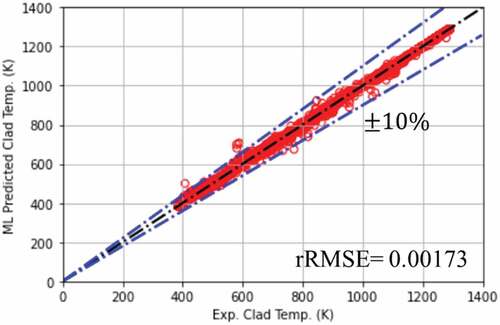
Fig. 16. Statistics for RF PCT prediction errors.
Next, like the COBRA-TF validation performed in the previous section, a detailed UQ analysis was also carried out for the newly developed ANN and RF reflood models in terms of the cladding temperature variation. For comparison, the input parameters and uncertainty distributions used for the ML models are exactly the same as the COBRA-TF case, as shown in . Again, data from RBHT exp. 8009 are used for model validation. Moreover, due to the significantly improved simulation efficiency using the ML models, the total UQ sample size was increased to 200 so that more data points could be included in the analysis.
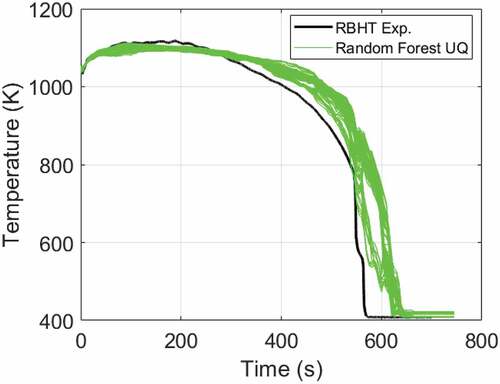
The cladding temperature variation predicted by the ML models during the entire quench transient for exp. 8009 are presented in for the ANN and RF, respectively. Compared with the COBRA-TF prediction, both the ANN and RF models were found to be able to further reduce the prediction error, indicating that the current ML models developed can capture the complex thermal-hydraulic phenomena during reflood. In addition, it can be also witnessed that, while the ANN and RF have a similar performance for cladding temperature prediction in the post-dryout regime by predicting slightly later quench, the RF is found to report a better temperature prediction at the beginning than the ANN prediction as compared to exp. 8009. In addition, the RF PCT predictions are smoother as compared with the ANN predictions, indicating that the ANN technique has a higher input data dependency.
Fig. 17. ANN-predicted cladding temperature (exp. 8009).
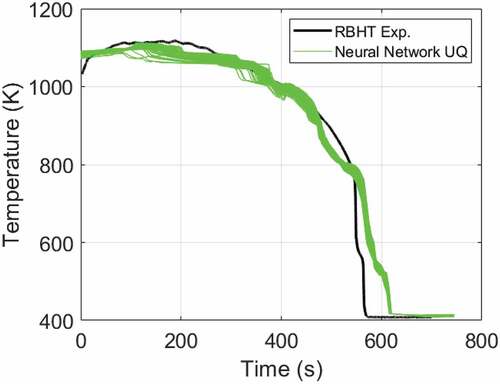
Fig. 18. RF-predicted cladding temperature (exp. 8009).
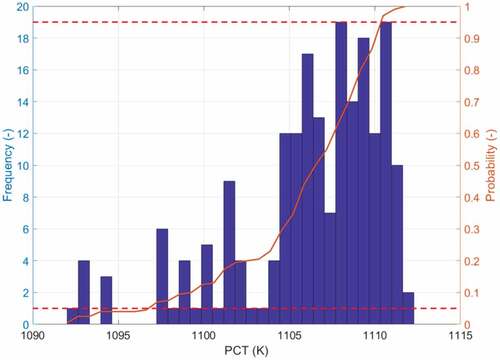
The model-predicted PCT distributions are further presented in for the ANN and RF, respectively. For the ANN, prediction mostly centered near the upper end with a mean value μ = 1109.0 K and standard deviation σ = 3.7170 K, and the BEPU reported 95/95 PCT value is 1111.06 K. On the other hand, the RF-predicted PCT values generally follow a normal distribution slightly biased toward the lower end with a mean value and standard deviation
, and the BEPU reported 95/95 PCT value is 1111.0 K, representing a 6.6-K deviation from the actual exp. 8009 PCT value of 1117.6 K. A very similar PCT performance was obtained for both the ANN and RF models, indicating that the AI-based modeling technique has the potential to better capture the PCT behavior during reflood.
Fig. 19. ANN-predicted PCT distribution (exp. 8009).
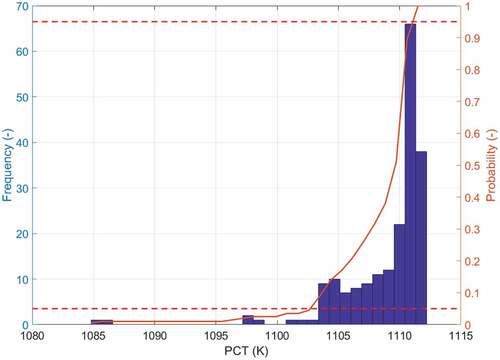
Fig. 20. RF-predicted PCT distribution (exp. 8009).
Last, to further investigate whether the ML reflood models developed can reflect the correct parametric effects for the existing four input parameters selected, scatter plots of the parametric effects for the ANN and RF are presented in , respectively, whereas the spearman’s rank correlation coefficient plots are shown in , respectively Compared with the actual RBHT data, the ANN predicts correct bundle power and inlet liquid mass flow rate effects but fails to capture the system pressure and inlet liquid temperature/enthalpy effects, while the RF predicts correct system pressure and inlet liquid temperature/enthalpy effects but fails to capture the bundle power and inlet liquid mass flow rate effects.
Fig. 21. ANN scatter plot for parametric effects on PCT (exp. 8009).
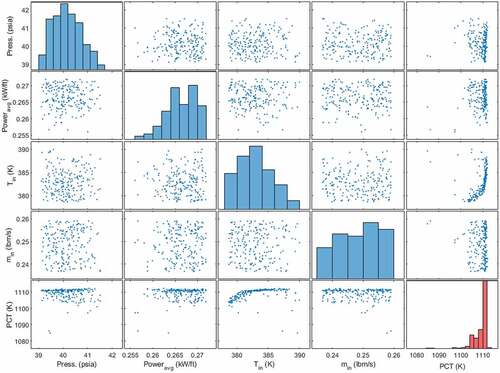
Fig. 22. RF scatter plot for parametric effects on PCT (exp. 8009).
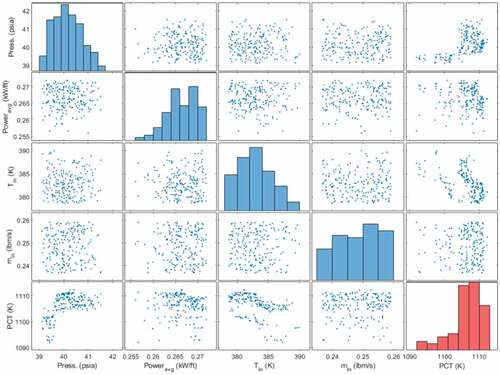
Fig. 23. Spearman’s rank correlation coefficients for ANN prediction (exp. 8009).
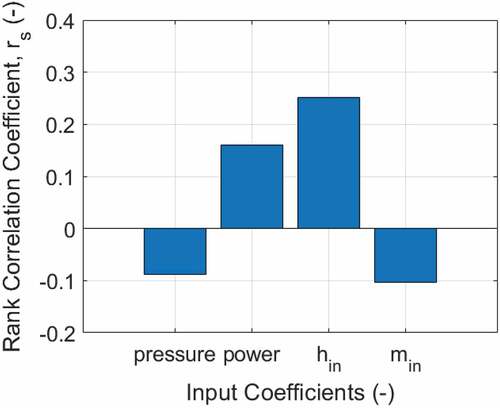
Fig. 24. Spearman’s rank correlation coefficients for RF prediction (exp. 8009).
These model behaviors are due to the so-called black-box problem inherent in the “pure” ML (or pure data-driven) process. The users clearly know the ML model input and output structures. However, they typically do not know how the model is trained or how each individual input parameter is behaving and interacting with the outputs during the training process. Such lack of understanding for the underlying ML training logic poses a risk in applying these developed models in engineering systems, especially nuclear systems. In addition, when modeling a very complex mass and energy transport process, such as the reflood with rapidly changing transients as well as various intercoupled physics, the pure AI-based ML models alone are typically inadequate to learn the entire underlying physics. As a result, more sophisticated ML models (such as RNN, CNN, etc.) and advanced ML techniques need to be introduced to solve these problems, such as the physics-informed ML techniques that are already proving to be very effective in tackling pure AI-based ML model deficiencies.Citation40,Citation41
However, the combinations and applications of these advanced approaches are task-specific problems. For example, the RBHT reflood data are basically a set of time series with rapidly changing transients. The various physical processes involved have clear connections in time, such as the transition of mass and heat transfer regimes. Therefore, beside the basic ML approach such as the ANN and RF, the LSTM network (a typical type of RNN) is also an appropriate method to be considered. On the other hand, RBHT collects a large amount of liquid droplet data as raw images, which makes it very suitable to be modeled and analyzed using CNN-type ML techniques. Last but not least, the physics-informed methodology could be applied on top of these techniques to further improve the model’s capability of capturing the actual physics and ensure the correct parametric correlations.
V. SUMMARY AND CONCLUSIONS
Based on the NRC/PSU RBHT reflood experimental data, a comprehensive uncertainty analysis framework has been developed using DAKOTA. The developed framework is used to perform detailed reflood model V&V for both the subchannel analysis code COBRA-TF and the cladding temperature AI-based ML models. Two ML techniques are adopted in the current study, including the typical ANN architecture and the RF tree-based architecture. The key input parametric effects for reflood thermal-hydraulic prediction include system pressure, inlet liquid temperature/enthalpy, mass flow rate, and average bundle power input. The FOM under consideration is the PCT. It should be noted that in the current study only those experimental initial and boundary conditions are considered because at the early stage of our code validation work, the uncertainties as well as the corresponding distributions of these parameters can be readily obtained from the RBHT experiments, thus providing a good starting point. However, these parameters might not be the major contributing factor to the code uncertainties. For example, it has been found that the two-phase flow heat transfer coefficient and pressure drop model play a significant role in code reflood transient simulations.
It has been found that while further model improvement is needed, COBRA-TF can predict the correct parametric trends when compared with the RBHT data. On the other hand, while the overall cladding temperature prediction accuracy is significantly improved by using the ML models, it is challenging for the pure AI-based ML models to correctly reflect the parametric trends. Advanced ML techniques, including the RNN, CNN, LSTM, and physics-informed ML need to be further explored to solve the problems under consideration. In addition, more sophisticated flow and heat transfer models need to be developed for COBRA-TF transient reflood predictions.
In the future, a similar approach will be applied to other important parameters and models based on the LOCA phenomena identification and ranking table (PIRT) as well as previous studies. Advanced methodologies, such as the inverse UQ based on the Bayesian theory, will be explored to determine the various parameters’ uncertainties and distributions.
Acknowledgments
The work performed in the current study was based on the RBHT tests supported by the NRC under contract number NRC-HQ-60-16-T-0002.
This paper was prepared as an account of work sponsored by an agency of the U.S. government. Neither the U.S. government nor any agency thereof, nor any of their employees, makes any warranty, expressed or implied, or assumes any legal liability or responsibility for any third party’s use, or the results of such use, of any information, apparatus, product, or process disclosed in this paper, or represents that its use by such third party would not infringe privately owned rights. The views expressed in this paper are not necessarily those of the NRC.
Disclosure Statement
No potential conflict of interest was reported by the authors.
References
- K. G. PEARSON, C. A. COOPER, and D. JOWITT, “Reflooding Experiments on a 49-Rod Cluster Containing a Long 90% Blockage,” UKAEA Report AEEW-R1591 (1983).
- K. G. PEARSON, C. A. COOPER, and D. JOWITT, “The THETIS 80% Blocked Cluster Experiment. Part 4. Gravity Reflood Experiments,” Report AEEW-R1766, UK Atomic Energy Authority (1984).
- C. A. COOPER, K. G. PEARSON, and D. JOWITT, “The THETIS 80% Blocked Cluster Experiment. Part 3. Forced Reflood Experiments,” AEEW-R1765, UK Atomic Energy Authority (1984).
- P. IHLE and K. RUST, FEBA—Flooding Experiments with Blocked Arrays Evaluation Report, KfK 3657, Karlsruhe Institute of Technology (1984).
- P. IHLE and K. RUST, “SEFLEX, Fuel Rod Simulator Effects in Flooding Experiments. Part 1,” Evaluation Report KfK–4024, Karlsruhe Institute of Technology (1986).
- P. IHLE and K. RUST, “PWR Reflood Experiments Using Full Length Bundles of Rods with Zircaloy Cladding and Alumina Pellets,” Nucl. Eng. Des., 99, 223 (1987); https://doi.org/10.1016/0029-5493(87)90123-3.
- K. G. PEARSON and M. K. DENHAM, “Achilles Unballooned Cluster Experiments—Part 1: Description of the Achilles Rig, Test Section and Experimental Procedures,” Technical Report AEEW-R 2336, UK Atomic Energy Authority, Winfrith Technology Centre (1989).
- J. STUCKERT et al., “Experimental Results of Reflood Bundle Test Quench-14 with M5 Cladding Tubes.” Proc. 17th Int. Conf. Nuclear Engineering (ICONE-17), Brussels, Belgium, July 12–16, 2009.
- M. STEINBRÜCK et al., “Synopsis and Outcome of the QUENCH Experimental Program,” Nucl. Eng. Des., 240, 1714 (2010); https://doi.org/10.1016/j.nucengdes.2010.03.021.
- N. LEE et al., “PWR FLECHT-SEASET Unblocked Bundle, Forced and Gravity Reflood Task Data Evaluation and Analysis Report,” EPRI NP-2013; NUREG/CR-2256; WCAP-9891, Westinghouse Electric Corporation, Monroeville, Pennsylvania (1982).
- L. E. HOCHREITER, “FLECHT-SEASET Program Final Report,” NUREG/CR-4167, U.S. Nuclear Regulatory Commission (1985).
- L. E. HOCHREITER et al., “Rod Bundle Heat Transfer Test Facility Test Plan and Design,” NUREG/CR-6975, U.S. Nuclear Regulatory Commission (2010).
- L. E. HOCHREITER et al., “RBHT Reflood Heat Transfer Experiments Data and Analysis,” NUREG/CR-6980, U.S. Nuclear Regulatory Commission (2012).
- S. K. MOON et al., “Assessment of the KAERI 6×6 Reflood Experiment Using the SPACE Code.” Proc. ICAPP 2011, Nice, France, May 2–5, 2011.
- W. JAEGER and V. H. S. ESPINOZA, “Uncertainty and Sensitivity Study in the Frame of TRACE Validation for Reflood Experiment,” Nucl. Technol., 184, 3, 333 (2013); https://doi.org/10.13182/NT184-333.
- O. A. BERAR, A. PROŠEK, and B. MAVKO, “RELAP5 and TRACE Assessment of the Achilles Natural Reflood Experiment,” Nucl. Eng. Des., 261, 306 (2013); https://doi.org/10.1016/j.nucengdes.2013.05.007.
- D. WICAKSONO, O. ZERKAK, and A. PAUTZ, “A Methodology for Global Sensitivity Analysis of Transient Code Output Applied to a Reflood Experiment Model Using TRACE.” Proc. NURETH-16, Chicago, Illinois, August 30–September 4, 2015.
- M. ZAKIR, “On the Development of a TRACE Model for the Study of Reflooding in BWR Parallel Channels,” MS Thesis, Chalmers University of Technology, Department of Applied Physics, Gothenburg, Sweden (2015).
- B. G. HUH, A. J. CHEONG, and K. W. LEE, “Evaluation of TRACE Spacer Grid Model with FLECHT-SEASET Reflood Test,” NUREG/IA-0481, U.S. Nuclear Regulatory Commission (2017).
- B. G. HUH, A. J. CHEONG, and K. W. LEE, “TRACE Assessment for Effect of Spacer Grid in RBHT Reflood Heat Transfer Experiments,” NUREG/IA-0480, U.S. Nuclear Regulatory Commission (2018).
- G. R. GARRETT et al., “Effects of System Parameters on the Two-Phase Flow and Heat Transfer Behavior in a Rod Bundle.” Proc. 4th Thermal and Fluid Engineering Conf. (TFEC2019), Las Vegas, Nevada, April 14–17, 2019.
- T. S. CHOI and H. C. NO, “Improvement of the Reflood Model of RELAP5/MOD3.3 Based on the Assessments Against FLECHT-SEASET Tests,” Nucl. Eng. Des., 240, 832 (2010); https://doi.org/10.1016/j.nucengdes.2009.11.043.
- T. S. CHOI and H. C. NO, “An Improved RELAP5/MOD3.3 Reflood Model considering the Effect of Spacer Grids,” Nucl. Eng. Des., 250, 613 (2012); https://doi.org/10.1016/j.nucengdes.2012.06.025.
- G. GEROVA et al., “Modeling and Simulation of the QUENCH 12 Experiment with the RELAP/SCDAPSIM/MOD3.5 Code,” AIP Conf. Proc., 2048, 020019 (2018).
- S. LUTSANYCH, F. MORETTI, and F. D. AURIA, “Validation of CATHARE TH-SYS Code Against Experimental Reflood Tests,” Proc. NURETH-16, Chicago, Illinois, August 30–September 4, 2015.
- G. H. SEO, H. H. SON, and S. J. KIM, “Numerical Analysis of RBHT Reflood Experiments Using MARS 1D and 3D Modules,” J. Nucl. Sci. Technol., 52, 1, 70 (2015); https://doi.org/10.1080/00223131.2014.932722.
- S. H. HONG et al., “Reflood Experiments at Elevated Pressures Using Intact and Deformed Rod Bundles to Simulate Small and Medium Break Loss-of-Coolant Accidents,” Nucl. Eng. Des., 338, 209 (2018); https://doi.org/10.1016/j.nucengdes.2018.08.017.
- A. VASILIEV and J. STUCKERT, “Application of Thermal Hydraulic and Severe Accident Code SOCRAT/V3 to Bottom Water Reflood Experiment QUENCH-LOCA-1,” J. Nucl. Eng. Radiat. Sci., 2, 021024–1 (2016).
- C. Y. PAIK et al., “Analysis of FLECHTSEASET 163-Rod Blocked Bundle Data Using COBRA-TF,” NUREG/CR-4166, U.S. Nuclear Regulatory Commission (1985).
- D. R. TODD, C. FREPOLI, and L. E. HOCHREITER, “Development of a COBRA-TF Model for the Penn State University—Rod Bundle Heat Transfer Program,” Proc. 7th Int, Conf. Nuclear Engineering, Tokyo, Japan, April 19–23, 1999.
- S. ERGUN, L. E. HOCHREITER, and J. H. MAHAFFY, “Modifications to COBRA-TF to Model Dispersed Flow Film Boiling with Two Flow, Four Field Eulerian–Eulerian Approach—Part 1,” Ann. Nucl. Energy, 35, 1663 (2008); https://doi.org/10.1016/j.anucene.2008.02.013.
- S. ERGUN, L. E. HOCHREITER, and J. H. MAHAFFY, “Modifications to COBRA-TF to Model Dispersed Flow Film Boiling with Two Flow, Four Field Eulerian-Eulerian Approach—Part 2,” Ann. Nucl. Energy, 35, 1671 (2008); https://doi.org/10.1016/j.anucene.2008.02.014.
- M. J. HOLOWACH et al., “A Model for Predicting Droplet Entrainment at a Quench Front in Thermal Hydraulic Analysis Codes,” Proc. IMECE’03, Washington, District of Columbia, November 16–21, 2003.
- Y. JIN et al., “Numerical Investigation of Rod Bundle Thermal-Hydraulic Behaviour During Reflood Transients Using COBRA-TF,” Ann. Nucl. Energy, 148, 107708 (Dec. 1, 2020); https://doi.org/10.1016/j.anucene.2020.107708.
- Y. JIN et al., “Validation of the Sub-channel Analysis Code COBRA-TF Based on the NRC/PSU RBHT Benchmark Data,” Proc. 19th Int. Topl. Mtg. Nuclear Reactor Thermal Hydraulics (NURETH-19), Brussels, Belgium, March 6, 2022.
- T. M. MITCHELL, Machine Learning, McGraw-Hill, New York (1997).
- M. GOMEZ et al., “Nuclear Energy System’s Behaviour and Decision Making Using Machine Learning,” Nucl. Eng. Des., 324, 27 (2017); https://doi.org/10.1016/j.nucengdes.2017.08.020.
- H. KIM et al., “Prediction of Critical Heat Flux for Narrow Rectangular Channels in a Steady State Condition Using Machine Learning,” Nucl. Eng. Technol., 53, 6, 1796 (2021); https://doi.org/10.1016/j.net.2020.12.007.
- Y. JIN, X. G. ZHAO, and K. SHIRVAN, “Unified Domain Knowledge Informed Machine Learning Model for CHF Prediction,” presented at the 2021 America Nuclear Society Virtual Annual Mtg., June 14, 2021.
- Y. JIN et al., “Constructing a New CHF Look-Up Table Based on the Domain Knowledge Informed Machine Learning Methodology,” Proc. 19th Int. Topl. Mtg. Nuclear Reactor Thermal Hydraulics (NURETH-19), Brussels, Belgium, March 6, 2022.
- X. ZHAO et al., “On the Prediction of Critical Heat Flux Using a Physics-Informed Machine Learning Aided Framework,” Appl. Therm. Eng., 164, 114540 (2020); https://doi.org/10.1016/j.applthermaleng.2019.114540.
- H. M. PARK, J. H. LEE, and K. D. KIM, “Wall Temperature Prediction at Critical Heat Flux Using a Machine Learning Model,” Ann. Nucl. Energy, 141, 107334 (2020); https://doi.org/10.1016/j.anucene.2020.107334.
- M. F. HE and Y. LEE, “Application of Machine Learning for Prediction of Critical Heat Flux: Support Vector Machine for Data-Driven CHF Look-Up Table Construction Based on Sparingly Distributed Training Data Points,” Nucl. Eng. Des., 338, 189 (2018); https://doi.org/10.1016/j.nucengdes.2018.08.005.
- “Transient and Accident Analysis Methods,” Regulatory Guide 1.203, U.S. Nuclear Regulatory Commission (2005).
- “UMS: Report on the Uncertainty Methods Study,” Vols. 1 and 2, NEA/CSNI/R (1997), p. 35, Nuclear Energy Agency, Committee of the Safety of Nuclear Installations (1998).
- “BEMUSE Phase VI Report—Status Report on the Area, Classification of the Methods, Conclusions and Recommendations,” NEA/CSNI/R, p. 4, Nuclear Energy Agency, Committee of the Safety of Nuclear Installations (2011).
- “PREMIUM: A Benchmark on the Quantification of the Uncertainty of the Physical Models in the System Thermal-Hydraulic Codes—Methodologies and Data Review,” NEA/ CSNI/R, p. 9, Nuclear Energy Agency, Committee of the Safety of Nuclear Installations (2016).
- B. BOYACK et al., “Quantifying Reactor Safety Margins,” NUREG/CR-5249, R4, U.S. Nuclear Regulatory Commission (1989).
- H. GLAESER, “Uncertainty and Sensitivity Analysis of a Post-Experiment Calculation in Thermal Hydraulics,” RESS, 45, 1–2, 19 (1994).
- F. D’AURIA, N. DEBRECIN, and G. M. GALASSI, “Outline of the Uncertainty Methodology Based on Accuracy Extrapolation,” Nucl. Technol., 109, 21 (1995); https://doi.org/10.13182/NT109-21.
- X. WU et al., “Inverse Uncertainty Quantification Using the Modular Bayesian Approach Based on Gaussian Process, Part 2: Application to TRACE,” Nucl. Eng. Des., 335, 417 (2018).
- Y. LIU and N. DINH, “Validation and Uncertainty Quantification for Wall Boiling Closure Relations in Multiphase-CFD Solver,” Nucl. Sci. Eng., 193, 81 (2019); https://doi.org/10.1080/00295639.2018.1512790.
- R. COCCI et al., “A Comprehensive Bayesian Framework for the Development, Validation and Uncertainty Quantification of Thermal-Hydraulic Models,” Ann. Nucl. Energy, 172, 109029 (2022); https://doi.org/10.1016/j.anucene.2022.109029.
- S. KIM et al., “Final Report on Advanced Instrumentation Development,” NUREG/CR Report, U.S. Nuclear Regulatory Commission (2018).
- Y. JIN et al., “Investigation of the Thermal-Hydraulic Non-equilibrium in a 7×7 Rod Bundle During Reflood,” Int. J. Heat Mass Transfer, 127, 266 (2018); https://doi.org/10.1016/j.ijheatmasstransfer.2018.08.011.
- Y. JIN et al., “Uncertainty Analysis on Droplet Size Measurement in Dispersed Flow Film Boiling Regime During Reflood Using Image Processing Technique,” Nucl. Eng. Des., 326, 202 (2018); https://doi.org/10.1016/j.nucengdes.2017.11.013.
- Y. JIN et al., “Experimental Study of Droplet Sizes Across a Spacer Grid Location Under Various Reflood Conditions,” Exp. Therm. Fluid Sci., 94, 246 (2018); https://doi.org/10.1016/j.expthermflusci.2018.02.017.
- Y. JIN et al., “Investigation of Two-Phase Flow Thermal-Hydraulic Behavior in Rod Bundle During Reflood Transients Based on the RBHT Experimental Data,” PhD Thesis, Pennsylvania State University, University Park, Department of Mechanical and Nuclear Engineering (2019).
- T. FOSHCH et al., “Regression Models of the Nuclear Power Unit VVER-1000 Using Data Mining Techniques,” Procedia Comput. Sci., 100, 253 (2016); https://doi.org/10.1016/j.procs.2016.09.151.
- L. FAHRMEIR et al., Regression Models, Springer, Berlin, Heidelberg (2013); https://doi.org/10.1007/978-3-642-34333-9_2.
- S. R. PATRA et al., “Artificial Neural Network Model for Intermediate Heat Exchanger of Nuclear Reactor,” Int. J. Comput. Appl., 1, 26, 36 (2010).
- D. MALJOVEC et al., “Analyzing Simulation-based PRA Data through Traditional and Topological Clustering: A BWR Station Blackout Case Study,” Reliab. Eng. Syst. Saf., 145, 262 (2016); https://doi.org/10.1016/j.ress.2015.07.001.
- O. I. ABIODUN et al., “State-of-the-Art in Artificial Neural Network Applications: A Survey,” Heliyon, 4, e00938 (2018); https://doi.org/10.1016/j.heliyon.2018.
- H. H. KANG, M. KAYA, and S. HAJIMIRZA, “A Data Driven Artificial Neural Network Model for Predicting Radiative Properties of Metallic Packed Beds,” Quant. Spectrosc. Radiat. Transfer, 226, 66 (2019); https://doi.org/10.1016/j.jqsrt.2019.01.013.
- J. LI, “Brief Introduction of Back Propagation (BP) Neural Network Algorithm and Its Improvement,” Adv. Comput. Sci. Inf. Eng., 169, (2012); https://doi.org/10.1007/978-3-642-30223-7_87.
- K. O’SHEA and R. NASH, “An Introduction to Convolutional Neural Networks,” Cornell Univrsity (2015); https://arxiv.org/abs/1511.08458.
- T. MIKOLOV et al., Recurrent Neural Network Based Language Model, Interspeech (2010).
- Y. SINGH and A. S. CHAUHAN, “Neural Networks in Data Mining,” J. Theor. Appl. Inf. Technol., 5, 36e42 (2009).
- N. SRIVASTAVA et al., “Dropout: A Simple Way to Prevent Neural Networks from Overfitting,” J. Mach. Learn. Res., 15, 1929 (2014).
- L. PRECHELT, “Automatic Early Stopping Using Cross Validation: Quantifying the Criteria,” Neural Networks, 11, 761 (1998); https://doi.org/10.1016/S0893-6080(98)00010-0.
- T. K. HO, “Random Decision Forests,” Proc. 3rd Int. Conf. Doc. Anal. Recognit., 1, 278 (1995); https://doi.org/10.1109/ICDAR.1995.598994.
- W. JAEGERET et al., “Uncertainty and Sensitivity Studies with TRACE-SUSA and TRACE-DAKOTA by Means of Steady State BFBT Data,” Sci. Technol. Nucl. Inst., Article ID 610598, 11 (2013).
- R. P. MARTIN and L. D. O’DELL, “Development Considerations of AREVA NP Inc.’s Realistic LBLOCA Analysis Methodology,” Sci. Technol. Nucl. Inst., Article ID 239718, 13 (2008); https://doi.org/10.1155/2008/239718.
- C. FREPOLI, “An Overview of Westinghouse Realistic Large Break LOCA Evaluation Model,” Sci. Technol. Nucl. Ins., Article ID 498737, 15 (2008); https://doi.org/10.1155/2008/498737.
- E. ZUGAZAGOITIA, “Uncertainty and Sensitivity Analysis of a PWR LOCA Sequence Using Parametric and Non-parametric Methods,” Reliab. Eng. Syst. Saf., 193, 106607 (2020); https://doi.org/10.1016/j.ress.2019.106607.
- B. M. ADAMS et al., Dakota, A Multilevel Parallel Object-Oriented Framework for Design Optimization, Parameter Estimation, Uncertainty Quantification, and Sensitivity Analysis: Version 6.11 User’s Manual, Sandia National Laboratories (2019).
- “UK ABWR Generic Pre-construction Safety Report (PCSR),” Technical Report. (Rev. B.), HITACHI-GE (2015).