
Kimio, ITO, Koichi ENDOH, Yutaka SHIRATORI and Kazuyuki INUBUSHI (2015). Silicon elution from three types of steel slag fertilizers in a paddy field analyzed by electron probe micro-analyzer (EPMA). Soil Science and Plant Nutrition, 61(5), pp. 835-845. http://dx.doi.org/10.1080/00380768.2015.1064326
When the above article was published in print as part of Vol. 61, Issue 5, Figures 4, 5 and 6 were erroneously printed in black and white. Please find the colour versions of these figures below.
Figure 4 Electron probe micro-analyzer (EPMA) mapping images of granulated blast furnace slag fertilizer. Two-dimensional distribution images of silicon (Si), calcium (Ca), oxygen (O), magnesium (Mg), aluminum (Al), manganese (Mn) and iron (Fe) in the cross section of granulated blast furnace slag fertilizer before and after setting in paddy field for 75 d. Contents of each element are shown using colors from high content to low content: white, pink, red, yellow, light green, green, light blue, blue and black in turn.
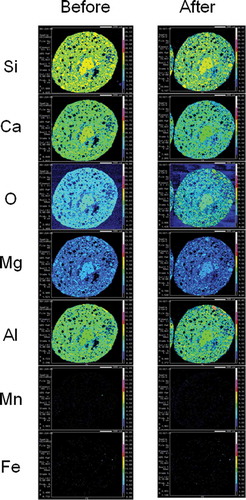
Figure 5 Electron probe micro-analyzer (EPMA) mapping images of dephosphorization slag fertilizer. Two-dimensional distribution images of silicon (Si), calcium (Ca), oxygen (O), magnesium (Mg), aluminum (Al), manganese (Mn) and iron (Fe) in the cross section of dephosphorization slag fertilizer before and after setting in paddy field for 75 d. Contents of each element are shown using colors from high content to low content: white, pink, red, yellow, light green, green, light blue, blue and black in turn.
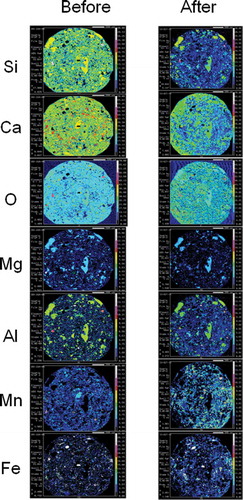
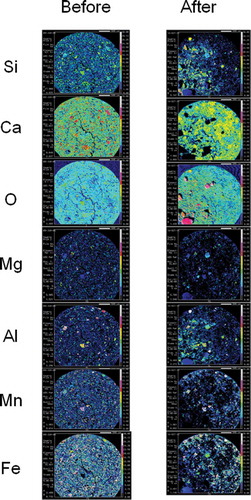
Figure 6 Electron probe micro-analyzer (EPMA) mapping images of decarburization slag fertilizer. Two-dimensional distribution images of silicon (Si), calcium (Ca), oxygen (O), magnesium (Mg), aluminum (Al), manganese (Mn) and iron (Fe) in the cross section of decarburization slag fertilizer before and after setting in paddy field for 75 d. Contents of each element are shown using colors from high content to low content: white, pink, red, yellow, light green, green, light blue, blue and black in turn.
Taylor & Francis apologises for this error.