
 ?Mathematical formulae have been encoded as MathML and are displayed in this HTML version using MathJax in order to improve their display. Uncheck the box to turn MathJax off. This feature requires Javascript. Click on a formula to zoom.
Abstract
Trazpiroben (TAK-906), a peripherally selective dopamine D2/D3 receptor antagonist, is being developed for the treatment of patients with gastroparesis. The potential of trazpiroben to act as a perpetrator or a victim for cytochrome P450 (CYP)- or transporter- mediated drug–drug interactions (DDIs) was evaluated following the latest regulatory guidelines.
In vitro studies revealed that trazpiroben is metabolised mainly through a non-CYP pathway (56.7%) by multiple cytosolic, NADPH-dependent reductase, such as aldo-keto reductase and short-chain dehydrogenase/reductase including carbonyl reductases. Remaining metabolism occurs through CYP3A4 and CYP2C8 (43.3%). Trazpiroben is neither an inhibitor nor an inducer of major CYP enzymes at a clinically relevant dose. It is a substrate of P-glycoprotein (P-gp) and organic anion transporting polypeptide (OATP) 1B1/1B3, but is not an inhibitor of transporters listed in the DDI guidelines at a clinically relevant dose. This is consistent with findings from CYP3A and P-gp-based clinical assessment showing no substantial change (≤2-fold) in trazpiroben exposure when co-administered with itraconazole.
Collectively, trazpiroben has low potential of enzyme-mediated DDIs and is unlikely to act as a perpetrator of transporter-mediated DDIs but there may be a potential to act as a victim of OATP1B1/1B3 DDI that will be evaluated clinically.
Introduction
Trazpiroben, 3-((1-cyclohexyl-4-oxo-8-(4-oxo-4-phenylbutyl)-1,3,8-triazaspiro[4.5] decan-3-yl)methyl)benzoic acid maleate (1:1) (previously referred to as TAK-906 or ATC-1906M), is a peripherally selective dopamine D2/D3 receptor antagonist being developed as an oral capsule to treat patients with diabetic and idiopathic gastroparesis. Gastroparesis is a motility disorder of the stomach characterised by delayed gastric emptying in the absence of mechanical obstruction. Common symptoms reported by patients with gastroparesis include nausea, vomiting, early satiety, abdominal pain, and postprandial fullness that are chronic with episodic symptom exacerbation (Choung et al. Citation2012). D2 and D3 receptors are valid targets for gastroparesis pharmacotherapy as D2 receptors are involved in the control of nausea and vomiting and D3 receptors play a role in gastric motility. Blocking D2 receptors is associated with a reduction in nausea and vomiting while blocking D3 receptors is associated with an increase in gastric motility (Darmani et al. Citation1999, Kashyap et al. Citation2009, Lee and Kuo Citation2010). Currently, there remains a significant unmet medical need for gastroparesis treatments because prescribed D2 receptor antagonists such as metoclopramide and domperidone as standard of care carry a significant safety risk of tardive dyskinesia and extra-pyramidal symptoms or QT prolongation, respectively (Meltzer Citation2013, Michaud and Turgeon Citation2013), and their use is limited to the acute setting. Trazpiroben has low central nervous system (CNS) penetration and was not associated with CNS, pulmonary or cardiovascular safety issues in non-clinical studies (Jasper and Whiting Citation2020, Kreckler et al. Citation2020, Whiting et al. Citation2020). Given the significant unmet medical need, the anticipated favourable benefit–risk profile of trazpiroben supports its investigation as a viable treatment option in patients with diabetic and idiopathic gastroparesis.
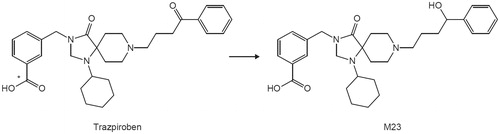
Patients with gastroparesis are often prescribed multiple drugs and are potentially at risk of drug–drug interactions (DDIs). DDI guidelines from the United States Food and Drug Administration (FDA) and the Japan Pharmaceuticals and Medical Devices Agency (PMDA) have recently been finalised or revised (Japan Ministry of Health, Labour and Welfare Citation2019, U.S. Food and Drug Administration, Department of Health and Human Services, Center for Drug Evaluation and Research (CDER) Citation2020). They emphasise evaluation of the potential of new drug candidates to act as perpetrators or victims of cytochrome P450 (CYP)- or transporter-mediated DDIs in the process of drug development (Bohnert et al. Citation2016). As shown in , trazpiroben is metabolised to M23, a ketone product, which is detected as a major metabolite in human plasma (data not shown). Considering the DDI potential of trazpiroben, identification of enzymes involved in its metabolism is essential. In this study, the DDI potential of trazpiroben was evaluated according to the latest DDI guidelines.
Figure 1. Metabolic pathway from trazpiroben to M23, a major metabolite in humans. The asterisk indicates the position of radiolabelling.
Materials and methods
Reagents
Trazpiroben maleate salt and its metabolite, M23, were prepared by Takeda Pharmaceutical Company Limited (Tokyo, Japan). [14C]trazpiroben was synthesised by Curachem, Inc. (Cheongju-si, Republic of Korea). Suppliers of materials used in these studies are listed in Supplementary Material S1. Other reagents used in the study were commercially available in analytical grade.
Determination of binding to human liver microsomes
Pooled human liver microsomes (HLM) from 150 donors (male and female) were purchased from BioIVT (Baltimore, MD). Protein binding of trazpiroben in HLM was determined using equilibrium dialysis as described below. The protein binding of trazpiroben was measured in triplicate in HLM (0.5 mg/mL) at 0.1 and 1 µM for five time points (0, 4, 5, 6, 7, and 8 h). Rapid Equilibrium Dialysis device inserts (membranes with a molecular weight cut-off of 8000 Da) and a Teflon base plate from Thermo Fisher Scientific (Rockford, IL) were used. Samples (50 µL) were vortex-mixed with 50 µL of methanol containing an internal standard and 200 µL of acetonitrile for 3 min. Samples were then centrifuged at 1640×g for 5 min at ambient temperature. Supernatant was transferred to a clean 96-well plate and samples were evaporated to dryness under a stream of nitrogen at 40 °C. The samples were reconstituted with 150 µL of methanol:water (50:50, v/v), vortexed for 2 min to mix, and analysed using liquid chromatography–mass spectrometry (LC-MS).
Identification of enzymes in trazpiroben metabolism
The in vitro metabolite profile of [14C]trazpiroben was examined using human, rat and dog hepatocytes, and metabolic pathways including M23 formation were clarified using HLM, human liver cytosol (HLC) and CYP-expressing microsomes. The contribution of non-CYP and CYP to in vitro metabolic clearance (CLint) of trazpiroben by human liver S9 was evaluated using a typical inhibitor of CYP (1-aminobenzotriazole, ABT). Intrinsic clearance for each S9 reaction sample (CLint(S9)) was calculated using the following equation:
where k (min−1) is the first-order rate constant when the remaining ratios of trazpiroben (percent remaining) were plotted against incubation time (t) and CS9 is the final concentration of human liver S9 (1.0 mg protein/mL).
The relative contribution ratio was calculated using the following equation:
where CLint(S9)without inhibitor is the intrinsic clearance for the reaction without inhibitor in human liver S9 and CLint(S9)with ABT is the intrinsic clearance for the reaction with ABT in human liver S9.
Relative contribution ratio of non-CYP (%) = 100 − relative contribution ratio of CYP
The reductase involved in [14C]trazpiroben metabolism was estimated based on the effect of reductase inhibitors using HLC. Typical reductase inhibitors were selected according to information in the literature (Rosemond et al. Citation2004, Ramsden et al. Citation2018). Phenobarbital, flufenamic acid, zopolrestat, chenodeoxycholic acid, and dexamethasone were used as aldo-keto reductase (AKR), 4-methylpyrazole was as an alcohol dehydrogenase inhibitor, disulphiram was as an aldehyde dehydrogenase inhibitor, quercetin and menadione were as short-chain dehydrogenase/reductase (SDR) and carbonyl reductase (CR) inhibitors, and dicumarol was as a quinone reductase inhibitor, respectively. The remaining activity was calculated as the percentage to the total radioactivity of the M23 peak in the sample with each inhibitor when the corresponding percentage in each control sample was regarded as 100%. The inhibition was calculated using the following equation:
where PRsamp is the percentage to the total radioactivity of the M23 peak in the sample with each inhibitor (%) and PRcont is the percentage to the total radioactivity of the M23 peak in each control sample (%).
For CYP phenotyping, the relative CYP contribution ratio to in vitro oxidative metabolism of trazpiroben using major CYP-expressing microsomes was evaluated using relative activity factor (RAF) values (Harper and Brassil Citation2008). Briefly, trazpiroben (1 µM) was incubated with various CYP-expressing microsomes (CYP1A2, 2B6, 2C8, 2C9, 2C19, 2D6 and 3A4) at 37 °C for 5, 10, 20, 30 and 40 min. After incubation, samples were analysed for trazpiroben using liquid chromatography with tandem mass spectrometry (LC-MS/MS) to calculate remaining ratios of trazpiroben and CLint. The percentage contribution of each CYP isoform to trazpiroben metabolism was evaluated using RAFs. To determine the RAFs, each typical substrate metabolised by CYP1A2, 2B6, 2C8, 2C9, 2C19, 2D6 and 3A4 was added to HLM (0.1 mg protein/mL) or CYP-expressing microsomes (50 pmol P450/mL). Phenacetin (6 μM), bupropion (20 μM), amodiaquine (0.5 μM), diclofenac (0.8 μM), (S)-mephenytoin (6 μM), bufuralol (2 μM) and midazolam (0.2 μM) were used as typical substrates for CYP1A2, 2B6, 2C8, 2C9, 2C19, 2D6 and 3A4, respectively. The mixtures were incubated at 37 °C for 10 or 20 min (HLM) or 1 min (CYP-expressing microsomes). Substrate metabolites produced by HLM or CYP-expressing microsomes were quantified using LC-MS/MS and RAFs were calculated from the CLint values (μL/min/mg protein) obtained.
CLint in CYP-expressing microsomes was corrected using the RAF and the percentage contribution of the CYP isoform was calculated. The method used to calculate the percentage contribution of CYP3A4 is shown below; the percentage contributions of the other isoforms were calculated in the same manner.
Typical in vitro reaction phenotyping with [14C]trazpiroben/trazpiroben
[14C]trazpiroben (10 μM) or trazpiroben (1 μM) dissolved in acetonitrile/ultrapure water (1:1, v/v) was incubated with hepatocytes (3.0 × 10⁵ viable cells/500 μL) or incubation mixtures consisting of the following: 50 or 100 mM potassium phosphate buffer (pH 7.4); HLM (0.2 mg protein/mL), HLC (1.0 mg protein/mL), human liver S9 (1.0 mg protein/mL) or CYP-expressing microsomes (50 pmol CYP/mL); NADPH-regenerating system (5 mM MgCl2, 5 mM glucose 6-phosphate, 0.5 mM β-NADP + and 1.5 units/mL glucose-6-phosphate dehydrogenase) or NADPH (2 mM) in the presence or absence of ABT (1 mM) or reductase inhibitors (10 and 100 μM). Hepatocytes were incubated with In VitroGRO™ Krebs–Henseleit buffer (BioreclamationIVT) for up to 6 h in 5% CO2 at 37 °C and the reaction was terminated by adding 25 μL of 1 M hydrochloric acid and 500 μL of methanol. Other incubations were conducted at 37 °C for 30 min (HLM and CYP-expressing microsomes), 60 min (HLC), 10, 20, 30, 40 and 50 min (HLM and S9) and 10, 20, 30 and 40 min (CYP-expressing microsomes) in a final volume of 300 or 500 μL, and the reaction was terminated by adding an equivalent volume of methanol. All incubations were carried out in triplicate.
Analytical procedures for [14C]trazpiroben/trazpiroben
Incubation reactions of [14C]trazpiroben/trazpiroben with stop solution were centrifuged at approximately 1500×g or 2130×g for 10 min at 10 °C. The supernatants of [14C]trazpiroben were analysed by high-performance liquid chromatography (HPLC) (Shimadzu Corp., Kyoto, Japan) with an online flow scintillation analyser (PerkinElmer, Inc., Waltham, MA). The diluted supernatant samples of non-radiolabelled trazpiroben with methanol/water/formic acid (1000:1000:1, v/v/v) were injected into an API 4000™, API 5000™ or 4000 QTRAP® (AB SCIEX., Framingham, MA) LC-MS/MS equipped with HPLC (Shimadzu Corp.).
A summary of analytical procedures is detailed in Supplementary Material S2.
CYP assays
CYP inhibition
CYP inhibition was evaluated using half-maximal inhibitory concentration (IC50) shift values. Time-dependent inhibition was determined by comparing IC50 values both with and without preincubation and with and without the NADPH-regenerating system present in the preincubation. Observed inhibition (%) was measured for all preincubation conditions. Marker substrates and their concentrations, and positive control inhibitors and their concentrations for each CYP reaction are shown in Supplementary Table S1.
Assay and analytical procedures are detailed in Supplementary Material S3. The IC50 shift for CYP time-dependent inhibition was calculated using the following equation:
where IC50 (−NADPH) and IC50 (+NADPH) are the IC50 values with 30-min preincubation in the absence and presence of NADPH regenerating system, respectively.
CYP induction
CYP induction was evaluated by mRNA expression in three donors of primary cryopreserved human hepatocytes (Supplementary Table S2). Hepatocytes were treated with hepatocyte culture medium fortified with trazpiroben at six concentrations (0.1, 0.3, 1, 3, 10 or 30 µM). Positive controls were treated in parallel, with hepatocyte culture medium fortified with a known inducer of each CYP: omeprazole (50 µM) for CYP1A2, phenobarbital (750 µM) for CYP2B6 and rifampicin (20 µM) for CYP3A4. Vehicle and negative controls were treated with hepatocyte culture medium containing 0.1% dimethyl sulfoxide (DMSO) and flumazenil (25 µmol/L), respectively. Refer to Supplementary Material S3 for assay and analytical procedures.
Induction parameters Emax (maximal effect) and EC50 (concentration giving half-maximal effect) were determined by plotting in vitro fold induction data (mRNA normalised to control) against the nominal in vitro concentration and were analysed using non-linear regression models in GraphPad Prism version 8 (GraphPad, San Diego, CA).
Transporter assays
For substrate assays, P-glycoprotein (P-gp) and breast cancer resistance protein (BCRP) were evaluated in Caco-2 cells and other transporters in transporter-transfected human embryonic kidney (HEK) 293 cells. For inhibition assays, P-gp was investigated in Caco-2 cells, BCRP in Madin–Darby canine kidney (MDCK) II epithelial cells and other transporters in transporter-transfected HEK293 cells, except for bile salt export pump (BSEP) (membrane vesicle). Inhibition was evaluated using IC50 shifts, and time-dependent inhibition was measured by comparison with or without preincubation for 30 min for organic anion transporting polypeptide (OATP) 1B1 and OATP1B3 according to the latest guidelines of FDA and PMDA. In addition, the contribution ratio of OATP1B1 and OATP1B3 to trazpiroben uptake was evaluated in three human hepatocyte donors and OATP1B1/1B3-expressing cells with reference to pravastatin (Hirano et al. Citation2004).
Uptake transporter studies
Uptake transporter-related assays were conducted with vector control- and transporter-transfected cells. Cell culture conditions are detailed in Supplementary Material S4, and assay and analytical procedures are detailed in Supplementary Material S5.
Ratio of uptake rates between transporter-expressing and control cells for uptake transporter studies was calculated as follows:
where Dlys is the amount of radioactivity in an aliquot of cell lysate (dpm), VDtes is the volume of test solution in which the radioactivity was determined (50 μL), VDlys is the volume of cell lysate in which radioactivity was determined (200 μL), Dtes is the amount of radioactivity in an aliquot of test solution (dpm), and Prot is the protein content (mg protein/mL).
where TF is transporter-transfected cells and VC is vector control-transfected cells.
Efflux transporter studies
Efflux transporter-related assays were conducted with cell monolayers via bidirectional permeability: apical-to-basolateral (AP-to-BL) and basolateral-to-apical (BL-to-AP). P-gp and BCRP substrate, and P-gp inhibition were assessed using Caco-2 cells and BCRP inhibition was evaluated using BCRP-expressing MDCK II cells. Cell culture conditions are detailed in Supplementary Material S4 and assay and analytical procedures are detailed in Supplementary Material S5.
Efflux ratio and percentage inhibition for efflux transporter studies was calculated as follows:
The apparent permeability coefficient (Papp) was calculated using the following equation:
where dQ/dt is the transport rate (dpm/s), Amem is the membrane surface area of the insert (0.3 cm2) and C0 is the concentration of radioactivity in the test solution (dpm/mL).
where TA is test article (Giacomini et al. Citation2010).
Uptake transport study using human hepatocytes
Descriptions of assay and analytical procedures are detailed in Supplementary Material S5.
The uptake clearance (μL/min/mg protein) in human hepatocytes was determined by calculating the slope of the uptake volume between two time points (20–60 s) for trazpiroben concentration dependence and the corresponding slope between 37 and 4 °C for comparison of uptake clearance of trazpiroben and reference compounds. To calculate saturable uptake clearance in hepatocytes, the uptake clearance was fitted to the following equation using non-linear least-squares regression analysis (WinNonlin; Certara, L.P., Princeton, NJ, USA).
where Vmax is the maximum uptake rate (pmol/min/mg protein), Km is the Michaelis constant (μM), S is the substrate concentration in the medium (μM), and Pdif is the non-saturable uptake clearance (μL/min/mg protein). The saturable component of the hepatic uptake clearance (CLhep) for comparison of uptake clearance of trazpiroben and reference compounds was determined by subtracting Cupt in the presence of 100 μM substrate (CLexcess) from that in the presence of 0.01 or 0.1 μM substrate (CLtracer).
The OATP1B1/1B3-mediated uptake clearance for [3H]estrone-3-sulfate (E3S) (0.01 μM), [3H]cholecystokinin octapeptide (CCK-8) (0.01 μM) and [3H]pravastatin (0.1 μM), which are well known substrates of OATP transporters, was obtained by subtracting the uptake volume in mock cells from that in transporter-expressing cells during a pre-specified incubation time ([3H]E3S, 0.5 min; [3H]CCK-8 and [3H]pravastatin, 1 min) at 37 or 4 °C. Kinetic parameters for the OATP1B1/1B3-mediated uptake of trazpiroben (0.1–100 μM) for 1 min were obtained using the following equation:
The contribution of OATP1B1 and OATP1B3 to trazpiroben uptake was investigated based on the RAF approach to extrapolate active uptake clearances in transporter-expressing cells to those in human hepatocytes. According to a previous report (Hirano et al. Citation2004), RAFs were calculated using E3S and CCK-8 as reference substrates for OATP1B1 and OATP1B3, respectively.
where CLhep,ref represents saturable uptake clearances of [3H]E3S and [3H]CCK-8 determined in human hepatocytes. CLexpress,ref represents OATP1B1-mediated uptake clearance of [3H]E3S and OATP1B3-mediated uptake clearance of [3H]CCK-8 in transporter-expressing cells. RAF-based predicted net uptake clearances of a tested compound via OATP1B1 and OATP1B3 (CLOATP, RAF) were calculated using the following equations:
where CLOATP1B1 and CLOATP1B3 represent OATP1B1- and OATP1B3-mediated uptake clearances of trazpiroben and reference compound determined in transporter-expressing cells, respectively.
Data analysis
All parameters were calculated using Microsoft Excel 2010 (Microsoft Corp., Redmond, WA) unless otherwise noted. IC50 values were determined as percentages of control values at concentrations ranging from 0 (control) to examined maximum concentration of trazpiroben determined by the least-squares method using the solver function of Microsoft Excel 2010 or nonlinear regression fitting. Data from CYP and transporter assays were used to calculate the parameters.
Results
Trazpiroben binding to HLM
Trazpiroben showed low binding ability to HLM (0.5 mg/mL), with no concentration dependence and a mean Fu,mic (non-specific binding to microsomes) of 0.783. Under experimental conditions (HLM ≤0.1 mg/mL) the Fu,mic is >0.95, suggesting non-specific binding will not impact the interpretation of inhibition potential from in vitro data.
Identification of enzymes in trazpiroben metabolism
The in vitro metabolite profile of [14C]trazpiroben was examined using human, rat and dog hepatocytes, and metabolic pathways were clarified using HLM and HLC. In the metabolic study using hepatocytes, trazpiroben was metabolised to M23 and unidentified (monooxygenated) metabolites, with no human-specific metabolites detected (Supplementary Figure S1). The monooxygenated metabolites that eluted at 20–22 min (Supplementary Figure S1), were formed primarily by CYP2C8 in the CYP phenotyping study using CYP-expressing microsomes (data on file). The scaled hepatic clearance from in vitro metabolism data was characterised as low in rats and humans (<25% hepatic blood flow [QH]) and intermediate in dogs (>25% and <50% QH). In the metabolic study using HLM and HLC, M23 was formed in HLC, but not in HLM in the presence of an NADPH-regenerating system (), and M23 was only detected in the presence of an NADPH-regenerating system. Based on the CLint of trazpiroben with human liver S9 with or without ABT in the presence of NADPH, the relative contribution ratios of CYP and non-CYP towards in vitro metabolism of trazpiroben were 43.3 and 56.7%, respectively (). To identify the reductase responsible for M23 formation, effects of reductase inhibitors (at final concentrations of 10 and 100 µM) on the in vitro metabolism of trazpiroben were investigated using HLC. These studies suggested that AKR and SDR including CR are primarily involved in M23 formation (). The relative CYP contribution to in vitro metabolism of trazpiroben using RAFs was also evaluated. Trazpiroben was mainly metabolised by CYP2C8 and CYP3A4, and by other CYP-expressing microsomes to a minor extent. Relative contributions of each CYP isoform to the oxidative metabolism of trazpiroben were CYP3A4, 59.5%; CYP2C8, 27.2%; CYP2B6, 5.6%; CYP1A2, 4.1%; CYP2C9, 3.0%; CYP2C19, 0.5% and CYP2D6, 0.2% (). In addition, the relative contribution ratios of CYP2C8 and CYP3A4/5 to in vitro metabolic clearance of trazpiroben by HLM evaluated using montelukast and ketoconazole (CYP2C8 and CYP3A4/5 inhibitors) were 30.5% and 44.5%, respectively, comparable to the results in the RAF study.
Figure 2. Typical radiochromatograms of the in vitro incubation mixture of [14C] trazpiroben with human liver microsomes and cytosol.
![Figure 2. Typical radiochromatograms of the in vitro incubation mixture of [14C] trazpiroben with human liver microsomes and cytosol.](/cms/asset/4f415ebe-1945-4ff8-a6a8-819ba689e75b/ixen_a_1912438_f0002_b.jpg)
Table 1. Relative contribution ratios of CYP and non-CYP isoforms towards in vitro metabolism of trazpiroben with human liver S9.
Table 2. Effects of reductase inhibitors on in vitro metabolism of trazpiroben.
Table 3. Contribution ratio of each CYP isoform to metabolism of trazpiroben.
Direct and time-dependent inhibition of CYP activities by trazpiroben
Direct and time-dependent inhibitory effects of trazpiroben (0.03, 0.1, 0.3, 1, 3, 10, and 30 μM) on the marker activities of CYP1A2, CYP2B6, CYP2C8, CYP2C9, CYP2C19, CYP2D6 and CYP3A4/5 (as measured by midazolam 1′-hydroxylation and testosterone 6β-hydroxylation) are presented in . Under the experimental conditions examined, maximal trazpiroben-dependent CYP2C8 inhibition was only 31% at 30 μM. Trazpiroben had little or no direct inhibitory effect on other CYP isoforms (less than 11% at 30 μM); therefore, the IC50 values of trazpiroben for seven CYP isoforms in HLM were all greater than 30 μM. Furthermore, following exposure to trazpiroben, there was no evidence of time-dependent inhibition of any of the CYP enzymes evaluated and no IC50 shift was observed.
Table 4. Inhibition of CYP enzyme activity by trazpiroben in human liver microsomes.
CYP induction by trazpiroben
Treatment of cultured human hepatocytes from three donors with up to 30 µM trazpiroben resulted in no overt cytotoxicity, evaluated by morphology observation (data not shown). Trazpiroben had little or no effect on CYP1A2 mRNA levels at up to 30 μM, CYP3A4 mRNA levels at up to 10 μM in two of three donors, and CYP2B6 mRNA levels at up to 30 μM in all three donors. These examined concentrations (10 or 30 μM) of trazpiroben were much higher than the Cmax,ss observed at the clinically relevant dose (0.06 μM). In one of three cultures, decreases in mRNA levels of CYP1A2 (by as much as 62.2% below those of the vehicle control) and CYP3A4 (by as much as 51.3% below those of the vehicle control) were observed. These reductions were unlikely to have been related to trazpiroben treatment as they occurred in a single donor and within the same donor, and were not concentration dependent. Trazpiroben resulted in concentration-dependent increases in CYP3A4 mRNA levels in two of the three donors, with a > 2-fold increase observed at 30 μM (). These increases were <5% of the positive control response.
Table 5. Fold induction of CYP mRNA in human hepatocytes by trazpiroben and known inducers.
P-gp and BCRP substrate assessment
The Papp of [14C]trazpiroben (1 μM) from the apical to the basal side was 0.797 × 1.0−6 cm/s, and that from the basal to the apical side was 7.54 × 1.0−6 cm/s (). The Papp ratio was 9.5. Papp ratios of [14C]trazpiroben in the presence of quinidine (P-gp inhibitor), Ko143 (BCRP inhibitor) and GF120918 (P-gp and BCRP inhibitor) were 2.0, 9.8 and 1.2, respectively. The Papp of [14C]trazpiroben from the basal to the apical side was higher than that from the apical to the basal side. The Papp ratio decreased in the presence of quinidine and GF120918, but was not affected by Ko143. These results suggest that trazpiroben is a substrate of P-gp but not of BCRP. The Papp of [14C]trazpiroben from the apical to the basal side in the presence of GF120918 was about three times higher than that of [3H]atenolol and less than half that of [3H]minoxidil. These results suggest that trazpiroben has moderate permeability.
Table 6. P-gp and BCRP substrate assessments in Caco-2 cells.
Uptake transporter substrate assessment
Uptake of [14C]trazpiroben (0.1, 1, and 10 µM) after incubation at 37 °C for 2 min was investigated using OATP1B1-, OATP1B3-, organic anion transporter (OAT)1-, OAT3-, organic cation transporter (OCT)2-, multidrug and toxin extrusion protein (MATE)1- and MATE2-K-expressing HEK293 cells and vector control-transfected cells (). Ratio of uptake rates between transporter-expressing and control cells in OATP1B1- and OATP1B3-expressing cells were 2.2–3.6. In addition, rifampicin (10 μM), a typical inhibitor of both OATP1B1 and OATP1B3, inhibited uptake of [14C]trazpiroben into OATP1B1- and OATP1B3-expressing cells. Ratio of uptake rates between transporter-expressing and control cells of [14C]trazpiroben into OAT1-, OAT3-, OCT2-, MATE1- and MATE2-K-expressing cells were less than 2.0. Each typical inhibitor only minimally affected the uptake of [14C]trazpiroben into OAT1-, OAT3-, OCT2-, MATE1- and MATE2-K-expressing cells. These results suggest that trazpiroben is a substrate of OATP1B1 and OATP1B3, but not of OAT1, OAT3, OCT2, MATE1 and MATE2-K. The uptake of typical substrates into each solute carrier transporter-expressing cell type was clearly observed, suggesting that this assay system was an appropriate method for evaluating trazpiroben as a substrate of those transporters.
Table 7. Uptake of trazpiroben and known substrates at 2 min.
Transporter inhibition assessment
Administration of trazpiroben resulted in concentration-dependent inhibition of P-gp-mediated digoxin transport, OATP1B1-mediated E217βG transport, OATP1B3-mediated E217βG transport and MATE1-mediated metformin transport at IC50s of 54.5, 5.13, 22.0, and 8.38 μM in each transporter expressing cells, respectively (). Trazpiroben also inhibited OATP1B1- and OATP1B3-mediated transport of E217βG after preincubation with trazpiroben for 30 min, with IC50s of 4.02 and 16.0 μM, respectively, suggesting that trazpiroben had little or no time-dependent inhibitory effect on OATP1B1- and OATP1B3-mediated uptake. Trazpiroben-mediated inhibition of the other uptake transporters was not observed. Extrapolated IC50 values for trazpiroben were greater than 100 μM for BCRP, OCT1 and BSEP, and greater than 10 μM for OAT1, OAT3, OCT2, and MATE2-K (). Uptake of each typical substrate into each transporter-expressing cell type and BSEP-expressing vesicles was observed. Uptake markedly decreased with the addition of each typical inhibitor, suggesting that this assay system was appropriate for evaluating inhibitory effects of trazpiroben on the uptake of each typical substrate in P-gp, BCRP, OATP1B1, OATP1B3, OCT1, BSEP, OAT1, OAT3, OCT2, MATE1 and MATE2-K ().
Table 8. Inhibition assessment of P-gp, BCRP, OATP1B1/1B3, OCT1/2, BSEP, OAT1/3 and MATE1/2-K by trazpiroben.
Uptake of [14C]trazpiroben using human hepatocytes
Uptake of [14C]trazpiroben into human hepatocytes was time and temperature dependent. Uptake clearance of [14C]trazpiroben decreased in a concentration-dependent manner. Values for Km, Vmax and Pdif are shown in Supplementary Table S3. Km values were 3.98, 1.09, and 13.4 μM for donor numbers TDH, HH145A and HH318, respectively. The contribution of saturable uptake clearance to total uptake clearance, ([Vmax/Km]/[Vmax/Km + Pdif]), was estimated to be 91.5%, 80.3% and 42.2% for TDH, HH145A and HH318, respectively, in the linear uptake condition. Uptake clearance of [14C]trazpiroben was decreased by an OATP inhibitor, cyclosporin A. These results indicate that trazpiroben was taken up into human hepatocytes via carrier-mediated transport systems.
Saturable (transporter-mediated) components of uptake clearances of [14C]trazpiroben and reference compounds for OATP-mediated transport, [3H]E3S, [3H]CCK-8 and [3H]pravastatin into human hepatocytes were investigated (Supplementary Table S4). In vivo saturable hepatic uptake clearance of pravastatin has been estimated to be 59 μL/min/106 cells (Varma et al. Citation2012) and 106 human hepatocyte cells corresponded to 0.504 mg of protein from the average of measured protein concentrations. In this study, saturable uptake clearances of pravastatin were 15.6%, 2.7% and 14.5% of the estimated in vivo saturable hepatic uptake clearance of pravastatin (120 μL/min/mg protein) for TDH, HH145A and HH318, respectively (Supplementary Table S4).
Variation in the transport activity observed may be the result of both artefacts produced during hepatocyte isolation and/or cryopreservation and intrinsic interindividual differences in donor liver uptake activity. When it is assumed that there are no intrinsic interindividual differences in donor liver uptake activity, in vivo saturable hepatic uptake clearances of trazpiroben were estimated based on saturable uptake clearances of pravastatin and trazpiroben (Supplementary Table S3). Contributions of estimated in vivo saturable hepatic uptake clearances to total uptake clearances were estimated to be 98.1, 98.5, and 89.1% for TDH, HH145A and HH318, respectively, in the linear uptake condition. These results indicate that almost all in vivo trazpiroben uptake into human hepatocytes was via a saturable process.
Results of the kinetic study of [14C]trazpiroben using OATP1B1- and OATP1B3-expressing HEK293 cells suggested that OATP1B1- and OATP1B3-mediated uptake of trazpiroben was saturable, with Km values of 4.17 and 11.3 μM, respectively. Km values for trazpiroben uptake by human hepatocytes were similar to those of OATP1B1- and OATP1B3-mediated trazpiroben uptake by transporter-expressing cells. The contribution of OATP1B1 and OATP1B3 to trazpiroben uptake was investigated using the RAF approach to extrapolate active uptake clearances in transporter-expressing cells to those in human hepatocytes. Relative contribution ratios of CLOATP1B1, RAF to the sum of CLOATP1B1, RAF and CLOATP1B3, RAF for trazpiroben were 82.7, 98.4, and 91.9% for TDH, HH145A and HH318, respectively; corresponding relative contribution ratios for pravastatin were 89.3, 99.1, and 94.9%, respectively (). Estimation by the RAF method suggested that both trazpiroben and pravastatin are taken up into human hepatocytes predominantly by OATP1B1. These results indicate that trazpiroben is taken up into hepatocytes via transporters in humans, and that OATP1B1 is the main transporter involved.
Table 9. Relative contribution of OATP1B1/1B3 to the transporter-mediated uptake of trazpiroben and pravastatin in each lot of human hepatocytes.
Discussion
The objectives of these in vitro DDI studies were: (1) to determine the enzymes involved in trazpiroben metabolism for assessment of trazpiroben DDI potential as a victim; (2) to evaluate the potential for trazpiroben-mediated inhibition of seven major CYP enzymes, and its induction potential for aryl hydrocarbon receptor (CYP1A2), constitutive androstane receptor (CYP2B6) and pregnane X receptor (CYP3A4) as a perpetrator; and (3) to evaluate the substrate/inhibitor potential of trazpiroben for the transporters P-gp, BCRP, OATP1B1, OATP1B3, OAT1, OAT3, OCT2, MATE1 and MATE2-K, and the inhibitory potential towards OCT1 and BSEP.
Metabolic Enzyme-Mediated DDIs of trazpiroben as a victim
Identification of enzymes involved in trazpiroben metabolism was essential to evaluate the risk of enzyme-mediated DDIs of trazpiroben as a victim. In metabolic studies using hepatocytes, trazpiroben was metabolized to M23 and mono-oxygenated metabolites by human hepatocytes, and comparison with data from animal hepatocytes confirmed that no human-specific metabolites were detected. Reaction phenotyping showed that both CYP and non-CYP metabolic pathways were involved in trazpiroben metabolism. Formation of M23, with reduction of the carbonyl group of trazpiroben (), was observed in HLC, but not in HLM in the presence of an NADPH-regenerating system (). Inhibition of M23 formation using reductase-specific inhibitors () indicated that multiple reductases (AKR and SDR including CR) mediate its formation. Taken together, relative contribution ratios of CYP and non-CYP towards in vitro trazpiroben metabolism () and relative CYP contribution ratios towards in vitro oxidative metabolism of trazpiroben using RAFs () show that contribution ratios of cytosolic reductases, CYP3A4, CYP2C8 and other CYPs to complete trazpiroben metabolism were 56.7, 25.8, 11.8, and 5.7%, respectively. These data suggest that the enzymatic DDI of trazpiroben as a victim should focus on cytosolic reductases, CYP3A4 and CYP2C8. The enzymatic properties of AKR and SDR have been well characterised (Hoffmann and Maser Citation2007, Barski et al. Citation2008). However, only a low DDI risk related to these cytosolic reductases has been reported in the literature so far, and multiple enzyme involvement in trazpiroben metabolism would further reduce the DDI risk, even if one elimination route was inhibited by a co-administered drug. In fact, clinical DDI assessment of trazpiroben as a victim using itraconazole (an inhibitor of CYP3A and CYP2C8), resulted in no substantial change in trazpiroben maximum observed plasma concentration (Cmax) or area under the concentration–time curve (AUC) (≤2-fold) (Chen et al. Citation2018). Thus, it may be concluded that the risk of metabolic enzyme-mediated DDIs of trazpiroben as a victim is low.
Low risk of inhibition of seven major CYPs or induction of CYP1A2, CYP2B6, and CYP3A4 by trazpiroben as a perpetrator
Trazpiroben treatment did not result in significant direct inhibition of seven major CYP isoforms in HLM (CYP1A2, CYP2B6, CYP2C8, CYP2C9, CYP2C19, CYP2D6 and CYP3A) (). As IC50s could not be determined, they were considered to be greater than the maximal incubation concentration of 30 μM. Assuming the worst case of >15 μM in relation to the unbound Cmax of 0.06 μM, trazpiroben is unlikely to result in clinically meaningful inhibition of CYP enzyme substrates. Furthermore, there was no evidence of time-dependent inhibition of any CYP enzymes evaluated using trazpiroben, indicated by the lack of IC50 shift. Thus, it is unlikely that trazpiroben is a mediator of DDIs via either reversible or irreversible inhibition of CYP activity. For CYP induction an increase in mRNA expression of greater than 2-fold compared with vehicle control is generally considered potentially clinically relevant (European Medicines Agency (EMA), Citation2013). In our study, a 2-fold increase was only observed in CYP3A4 mRNA levels at 30 μM for two out of three donors (). Estimated induction parameters for these two donors were used to conduct a clinical risk assessment. The EMA guideline considers induction risk to be relevant when the concentration resulting in 2-fold induction (F2) is less than 50-fold that of the unbound peak plasma concentration at steady state (Cmax,ss). For the most sensitive donor, F2 was >2500 times higher than the observed exposure at the effective dose of 50 mg. Both the FDA and the PMDA consider in vitro induction to be clinically relevant if the value of R (an annotation of AUC ratio as presented in the DDI guidance documents) is <0.8 when the following equation is applied:
where d is a scaling factor, assumed to be 1, Emax is the maximum induction effect relative to control, where 1.0-fold induction is baseline, I is unbound plasma Cmax,ss (µM), and EC50 (µM) is the measured in vitro concentration causing half-maximal induction. The calculated R value in the most sensitive donor was 0.98, demonstrating that trazpiroben treatment is unlikely to result in clinically meaningful induction of CYP3A substrates. No significant or concentration-dependent increases in CYP1A2 or CYP2B6 mRNA levels were observed. These results indicate that trazpiroben is unlikely to result in clinical induction of enzymes regulated through the aryl hydrocarbon receptor, constitutive androstane receptor and pregnane X receptor. Trazpiroben is therefore considered unlikely to mediate DDIs via CYP induction.
Trazpiroben is a substrate of P-gp, OATP1B1 and OATP1B3, but not a substrate of BCRP, OAT1, OAT3, OCT2, MATE1 and MATE2-K
Assessment of the change in Papp ratio of trazpiroben (1 μM) in Caco-2 cells with and without P-gp and BCRP inhibitors found it to be a P-gp substrate but not a BCRP substrate. In uptake transporter substrate measurements at trazpiroben concentrations of 0.1, 1, and 10 μM, ratio of uptake rates between transporter-expressing and control cells were investigated in OATP1B1-, OATP1B3-, OAT1-, OAT3-, OCT2-, MATE1- and MATE2-K-expressing cells; the inhibitory effect of prototypical transport inhibitors with trazpiroben 1 μM was also evaluated. Results of these studies suggested that trazpiroben was a substrate of OATP1B1 and OATP1B3, but not of BCRP, OAT1, OAT3, OCT2, MATE1 and MATE2-K. When these results are taken together, it may be concluded that trazpiroben is a substrate of P-gp, OATP1B1 and OATP1B3. Itraconazole is known to inhibit both CYP3A and P-gp (Vermeer et al. Citation2016), and the clinical DDI study with itraconazole found no significant exposure change of trazpiroben (≤2-fold) (Chen et al. Citation2018). Thus, the effect of P-gp is believed to be limited, but a potential effect of co-administration with OATP1B1 and OATP1B3 inhibitors on trazpiroben clearance cannot be excluded. As shown in human hepatocyte uptake experiments (), OATP1B1 is the primary transporter involved in hepatic uptake of trazpiroben in humans, similar to pravastatin. The DDI of statins including pravastatin with OATP1B1/1B3 inhibitors is well known (Neuvonen et al. Citation2006), therefore potential for increased systemic exposure of trazpiroben as a result of OATP1B1/1B3 inhibition should be considered. To estimate the potential impact of OATP inhibition on trazpiroben exposure, the following AUC ratio (AUCR) equation proposed in the literature (Elsby et al. Citation2012) was applied:
where ft and fh is the fraction of total clearance mediated by the relevant transporter and hepatic excretion respectively, [I] is the inhibitor concentration, and Ki is the inhibitor concentration at which activity is impaired 50% when substrate concentrations are below the Km.
As the in vitro data demonstrated an average ft,OATP1B1 of 0.87 and ft,OATP1B3 of 0.086 and majority hepatic elimination fh=0.95 (data on file), and given the reported parameters for 600 mg intravenous rifampin (Cmax,u=3.1 µM, Ki OATP1B1=0.09 µM, and Ki OATP1B3=0.03 µM) (Duan et al. Citation2017, Sanofi-aventis U.S. LLC Citation2010), the projected change in trazpiroben AUC in the presence of rifampicin is 5.4-fold. Thus, clinical evaluation of trazpiroben as an OATP substrate should be considered. In addition, the impact of low-activity OATP1B1 haplotypes SLC01B1*5 and SLC01B1*15 on exposure of trazpiroben (Romaine et al. Citation2010) should be evaluated.
Trazpiroben is not expected to result in meaningful inhibition of P-gp, BCRP, OATP1B1, OATP1B3, OCT1, BSEP, OAT1, OAT3, OCT2, MATE1, and MATE2-K substrates at the anticipated clinically relevant dose
Trazpiroben inhibited in vitro transport of P-gp, OATP1B1, OATP1B3 and MATE1 substrates with IC50s of 54.5, 5.13, 22.0 and 8.38 μM, respectively. The drug did not significantly inhibit the transport of specific substrates of BCRP, OCT1, OCT2 and BSEP at 1–100 μM and OAT1, OAT3 and MATE2-K at 0.1–10 μM (). In addition, following a 30-min preincubation with increasing concentrations of trazpiroben, OATP1B1 and OATP1B3-dependent transport was inhibited with IC50s of 4.02 and 16.0 μM, respectively. No time dependency was observed. FDA, EMA and PMDA drug interaction study guidelines (European Medicines Agency Citation2013; Japan Ministry of Health, Labour and Welfare Citation2019, U.S. Food and Drug Administration, Department of Health and Human Services, Center for Drug Evaluation and Research (CDER) 2020) propose [I]/IC50 for P-gp inhibitory assessment, where [I] reflects the concentration at the luminal side of the gastrointestinal wall (oral administration) and is obtained by dividing the dose by 250 mL. The anticipated effective dose of 50 mg results in an estimated [I] of 386 µM, resulting in a calculated [I]/IC50 for P-gp less than the guideline criteria of 10. For MATE1, the guidelines propose the use of Imax,u/IC50, where Imax,u represents the maximal unbound plasma concentration. Based on human plasma protein binding of approximately 90% [fu,p (unbound plasma protein binding ratio): 0.102], and the observed total Cmax of 0.06 µM following repeat dosing of 50 mg for 5 days, the Imax,u/IC50 value was also less than the criteria of 0.02. Trazpiroben is therefore considered unlikely to perpetrate clinical P-gp and MATE1 DDIs. Furthermore, the R value (the predicted ratio of the victim drug’s AUC in the presence and absence of an inhibitor) for OATP1B1/1B3 inhibition was also calculated using the following equations, with slightly different criteria for the FDA, PMDA and EMA guidelines:
where Iin,max is the estimated maximum plasma inhibitor concentration at the inlet to the liver. It is calculated as:
where Fa is the fraction absorbed, Fg is intestinal availability, ka is the absorption rate constant, QH is the hepatic blood flow rate and RB is the blood-to-plasma concentration ratio. In this calculation, Fa=1, Fg=1 and Qh=1.62 L/min were used as a worst-case estimate. The ka of 0.608 h−1 was estimated using physiologically based pharmacokinetic modelling based on the clinical DDI study data with itraconazole (Chen et al. Citation2018) using Simcyp software version 17 (Certara). RB was found to be 0.836 from an in vitro study using human blood and plasma. Assuming repeat dosing of 50 mg of trazpiroben and an unbound hepatic inlet concentration of 0.08 µM, the R value for OATP1B1/1B3 was less than 1.04. These findings indicate that dedicated clinical transporter-mediated DDI studies with trazpiroben as the perpetrator are not required.
Conclusions
Collectively, data from this study indicate that there is a low risk that trazpiroben would be a perpetrator of clinical DDIs mediated through CYPs or transporters. Trazpiroben was a sensitive substrate for OATP1B1/1B3 in vitro and its clinical evaluation as a potential victim of DDI through this pathway should be considered.
ixen_a_1912438_sm0933.pdf
Download PDF (218.7 KB)Disclosure statement
The authors report no declarations of interest.
References
- Barski, O.A., Tipparaju, S.M., and Bhatnagar, A., 2008. The aldo-keto reductase superfamily and its role in drug metabolism and detoxification. Drug metabolism reviews, 40 (4), 553–624.
- Bohnert, T., Victim Drug–Drug Interactions Working Group, et al., 2016. Evaluation of a new molecular entity as a victim of metabolic drug-drug interactions-an industry perspective. Drug metabolism and disposition: the biological fate of chemicals, 44 (8), 1399–1423.
- Chen, C., et al., 2018. Evaluation of the effect of itraconazole, a potent CYP3A4 inhibitor, on the pharmacokinetics of a single oral dose of TAK-906, a peripherally-selective D2/D3 dopamine receptor antagonist. United European gastroenterology journal, 8 (1), A501.
- Choung, R.S., et al., 2012. Risk of gastroparesis in subjects with type 1 and 2 diabetes in the general population. The American journal of gastroenterology, 107 (1), 82–88.
- Darmani, N., Zhao, W., and Ahmad, B., 1999. The role of D2 and D3 dopamine receptors in the mediation of emesis in Cryptotis parva (the least shrew). Journal of neural transmission, 106 (11–12), 1045–1061.
- Duan, P., Zhao, P., and Zhang, L., 2017. Physiologically based pharmacokinetic (PBPK) modeling of pitavastatin and atorvastatin to predict drug-drug Interactions (DDIs). European journal of drug metabolism and pharmacokinetics, 42 (4), 689–705.
- Elsby, R., Hilgendorf, C., and Fenner, K., 2012. Understanding the critical disposition pathways of statins to assess drug-drug interaction risk during drug development: it's not just about OATP1B1. Clinical pharmacology and therapeutics, 92 (5), 584–598.
- European Medicines Agency. (2013). Guideline on the investigation of drug interactions. London, UK: EMA.
- Giacomini, K.M., International Transporter Consortium, et al., 2010. Membrane transporters in drug development. Nature reviews drug discovery, 9 (3), 215–236.
- Harper, T.W., and Brassil, P.J., 2008. Reaction phenotyping: current industry efforts to identify enzymes responsible for metabolizing drug candidates. The AAPS journal, 10 (1), 200–207.
- Hirano, M., et al., 2004. Contribution of OATP2 (OATP1B1) and OATP8 (OATP1B3) to the hepatic uptake of pitavastatin in humans. The journal of pharmacology and experimental therapeutics, 311 (1), 139–146.
- Hoffmann, F., and Maser, E., 2007. Carbonyl reductases and pluripotent hydroxysteroid dehydrogenases of the short-chain dehydrogenase/reductase superfamily. Drug metabolism reviews, 39 (1), 87–144.
- Japan Ministry of Health, Labour and Welfare. (2019). Guideline of drug interaction for drug development and appropriate provision of information. Available from: https://www.pmda.go.jp/files/000228122.pdf [accessed 11 October 2020].
- Jasper, J.R., and Whiting, R.L., 2020. TAK-906, a dopamine D2/D3 receptor antagonist with minimal brain penetration for gastrointestinal disorders. The FASEB journal, 34 (S1), 1–1.
- Kashyap, P., et al., 2009. The D2/D3 agonist PD128907 (R-(+)-trans-3,4a,10b-tetrahydro-4-propyl-2H,5H-[1] benzopyrano [4,3-b]-1,4-oxazin-9-ol) inhibits stimulated pyloric relaxation and spontaneous gastric emptying. Digestive diseases and sciences, 54 (1), 57–62.
- Kreckler, L., et al., 2020. Su1739 Safety pharmacology evluations of TAK-906, a novel dopamine D2/D3 selective receptor antagonist for the management of gastroparesis. Gastroenterology, 158 (6), S-627–S-628.
- Lee, A., and Kuo, B., 2010. Metoclopramide in the treatment of diabetic gastroparesis. Expert review of endocrinology and metabolism, 5 (5), 653–652.
- Meltzer, H.Y., 2013. Update on typical and atypical antipsychotic drugs. Annual Review of Medicine, 64, 393–406.
- Michaud, V., and Turgeon, J., 2013. Domperidone and sudden cardiac death: how much longer should we wait? Journal of cardiovascular pharmacology, 61 (3), 215–217.
- Neuvonen, P.J., Niemi, M., and Backman, J.T., 2006. Drug interactions with lipid-lowering drugs: mechanisms and clinical relevance. Clinical pharmacology and therapeutics, 80 (6), 565–581.
- Ramsden, D., et al., 2018. Identification and characterization of a selective human carbonyl reductase 1 substrate. Drug metabolism and disposition, 46 (10), 1434–1440.
- Romaine, S.P.R., et al., 2010. The influence of SLCO1B1 (OATP1B1) gene polymorphisms on response to statin therapy. The Pharmacogenomics Journal, 10 (1), 1–11.
- Rosemond, M.J.C., et al., 2004. Enzymology of a carbonyl reduction clearance pathway for the HIV integrase inhibitor, S-1360: role of human liver cytosolic aldo-keto reductases. Chemico-biological interactions, 147 (2), 129–139.
- Sanofi-aventis U.S. LLC. 2010. Rifadin (rifampin capsules USP) – FDA reference ID: 2862628. Available from: https://www.accessdata.fda.gov/drugsatfda_docs/label/2010/050420s073,050627s012lbl.pdf [Accessed 27 October 2020].
- U.S. Food and Drug Administration, Department of Health and Human Services, Center for Drug Evaluation and Research (CDER). (2020). In vitro drug interaction studies – cytochrome P450 enzyme- and transporter-mediated drug interactions. Guidance for industry. Available from: https://www.fda.gov/media/134582/download [Accessed 11 October 2020].
- Varma, M.V., et al., 2012. Physiologically based modeling of pravastatin transporter-mediated hepatobiliary disposition and drug-drug interactions. Pharmaceutical research, 29 (10), 2860–2873.
- Vermeer, L.M., et al., 2016. Evaluation of ketoconazole and its alternative clinical CYP3A4/5 inhibitors as inhibitors of drug transporters: the in vitro effects of ketoconazole, ritonavir, clarithromycin, and itraconazole on 13 clinically-relevant drug transporters. Drug metabolism and disposition, 44 (3), 453–459.
- Whiting, R.L., Choppin, A., and Luehr, G., 2020. Su1764 TAK-906, a novel dopamine D2/D3 receptor antagonist for the treatment of gastroparesis. Gastroenterology, 158:S, 638–639.