
 ?Mathematical formulae have been encoded as MathML and are displayed in this HTML version using MathJax in order to improve their display. Uncheck the box to turn MathJax off. This feature requires Javascript. Click on a formula to zoom.
Abstract
The effect of the reduced pressure on flow boiling of CO2 in macroscale- and microscale-tubes was analyzed in this article. First, flow boiling heat transfer at high and low reduced pressures were simulated using a general mechanistic heat transfer model for flow boiling CO2 to analyze the heat transfer mechanisms. Then, the simulated heat transfer coefficients were compared to an experimental database at the reduced pressure from 0.1332 to 0.9082 (the corresponding saturation temperature from −40.6 to 26.77 °C), the tube diameter from 0.529 to 9.52 mm, the heat flux from 2 to 72 kW/m2 and the mass flux from 100 to 1500 kg/m2s. The model predicts 81.3% of the data before the dryout inception within ±30% while it only predicts 21% of data in the dryout and mist flow regimes within ±30%. The poor prediction of the heat transfer in these two regimes are because the model does not capture the dryout inception and completion. Furthermore, the heat transfer mechanisms are discussed from the standpoint of the flow regime variations and unstable flow boiling phenomena in macroscale and microscale tubes. It is recommended that the model should be improved by considering the mechanisms at low and high reduced pressures.
Introduction
As a natural working fluid, CO2 has been receiving renewed interest as an efficient and environmentally safe working fluid in many engineering applications including mobile air conditioning, heat pump systems and refrigeration systems at low temperatures [Citation1–8]. Due to its low critical temperature Tcrit of 31.1 °C and high critical pressure pcrit of 7.38 MPa, CO2 is utilized at much higher operating pressures in air-conditioning and heat pump systems. Supercritical CO2 gas cooling in gas coolers rather than condensation in condensers operates in the cooling process and flow boiling in evaporators occurs at high reduced pressures. As the effects of good thermophysical properties, favorably flow boiling heat transfer and two-phase flow characteristics of CO2 can be achieved in the relevant thermal systems [Citation2–5, Citation9–11]. However, flow boiling at low reduced pressures occurs in the CO2 refrigeration systems and displays quite different heat transfer behaviors and mechanisms from those at high reduced pressures. In general, conventional flow boiling heat transfer methods do not work for CO2 [Citation12, Citation13]. Furthermore, CO2 may be used in electronic cooling, two-phase thermosyphon loop and evaporative CO2 cooling system for the upgrade of the Compact Muon Solenoid pixel detector and so forth [Citation4–6]. Applications with CO2 in various thermal and energy systems with microscale tube evaporators can improve the energy efficiency and environment safe. For instance, CO2 may be used in geothermal energy utilization, hybrid power and heat systems, solar energy utilization and recovery of industrial waste heat [Citation4].
Predicting flow boiling heat transfer is especially important in the thermal design of CO2 evaporators for various thermal energy systems such as heat pump, refrigeration, air-conditioning systems and other thermal energy systems. For more accurate evaluation of the heat transfer rate, local heat transfer may be evaluated using proper flow boiling heat transfer prediction methods and models. Therefore, use of CO2 in various thermal and energy systems requires well understanding and proper modeling of flow boiling heat transfer and reliable prediction methods and models for flow boiling heat transfer [Citation4, Citation5].
Both macroscale- and microscale-tubes are used in the CO2 refrigeration, air-conditioning, heat pump and relevant thermal energy systems [Citation10–14]. For example, in the automobile air-conditioning systems, microscale tubes with diameters of 0.6 to 1 mm are used in evaporators while both macrochannels and microchannels are used for CO2 refrigeration and heat pump systems. The conventional prediction methods do not work for flow boiling of CO2 as of the effects of the reduced pressures, tube diameters, heat flux and mass flux [Citation15, Citation16]. The tube diameter has a significant effect on the flow boiling heat transfer characteristics, bubble dynamics, void fractions, flow regimes and mechanisms [Citation17–22]. Therefore, mechanistic heat transfer model based on flow patterns such as the Cheng et al. [Citation23–26] flow pattern-based heat transfer model is promising for prediction of flow boiling heat transfer of CO2. However, the effect of the reduced pressure on the heat transfer behaviors and prediction methods is significant. The mechanistic model needs to be evaluated with a large amount of new experimental data at low and high reduced pressures. This will help to further improve the model from the standpoint of heat transfer mechanisms and flow regimes [Citation27–29].
Quite different flow boiling heat transfer characteristics of CO2 have been shown for high and low reduced pressures in the existing studies [Citation2, Citation4, Citation5, Citation9]. The flow boiling heat transfer characteristics of CO2 at the reduced pressure larger than 0.4724 (the saturation temperature larger than 0 °C) show quite different behaviors as compared to those of conventional refrigerants due to the significantly different physical properties. CO2 has much higher flow boiling heat transfer and much lower pressure drops than other low-pressure refrigerants at high reduced pressures. One feature is the dominance of the nucleate boiling at low/moderate vapor qualities prior to dryout [Citation23–29]. Another feature is that the dryout in CO2 flow boiling occurs much earlier (at lower vapor qualities) than conventional refrigerants. Furthermore, the effect of the reduced pressure on the flow boiling heat transfer coefficients is noticeable. At higher reduced pressures, the nucleate boiling mechanism is more pronounced and plays a key role at the low vapor quality while both nucleate boiling and convection boiling mechanisms may be dominant for various combination of the reduced pressures, tube diameters, heat fluxes and mass fluxes at different ranges of vapor qualities [Citation22–29].
The conventional flow boiling heat transfer correlations are not applicable to CO2 flow boiling and underpredict the experimental results of CO2 at high reduced pressures. In addition, the existing experimental studies have demonstrated that dryout trends occur earlier at moderate vapor qualities in CO2 evaporation processes, particularly at high mass flux and high temperature conditions. In the meantime, the flow regime transitions also vary, and the conventional flow pattern maps do not capture the CO2 flow patterns. This means the CO2 flow boiling heat transfer mechanisms are different from those of conventional refrigerants and the correlations developed for conventional refrigerants do not work for CO2 and does not capture the heat transfer trends and mechanisms. From a predictive standpoint, many features of the existing flow pattern maps and flow boiling heat transfer methods require refinement to attain the desired level of accuracy for refrigerant heat exchangers design.
The proper prediction model for CO2 flow boiling heat transfer should be relevant to the physical mechanisms and the corresponding flow regimes [Citation17–29]. Cheng et al. [Citation25, Citation26] developed a comprehensive flow map and a general mechanistic flow boiling heat transfer model based on the flow regimes for CO2 in 2006 and 2008. Since then, many experimental studies on flow boiling heat transfer of CO2 in macroscale and microscale tubes have been conducted at low and high reduced pressures. Some of these test conditions are beyond the application range of conditions of the Cheng et al. [Citation25, Citation26] flow pattern map and heat transfer model. Therefore, further understanding of the heat transfer behaviors and physical mechanisms of flow boiling of CO2 in macroscale and microscale tubes at a wide range of reduced pressures is needed. Analysis of the simulation results of flow boiling heat transfer at low and high reduced pressures and evaluation of the Cheng et al. [Citation25, Citation26] mechanistic heat transfer model for flow boiling of CO2 with the available new experimental data can identify the improvement of the mechanistic model.
The objectives of this study are to analyze the effect of the reduced pressure on the flow boiling heat transfer characteristics and mechanisms of CO2 in macroscale and microscale tubes according to simulations of heat transfer at various working conditions using the Cheng et al. [Citation25, Citation26] general mechanistic heat transfer model for CO2. The predicted heat transfer coefficients were compared to the experimental database collected from the literature to identify further improvement of the model. In the present study, the distinction between macroscale and microscale tubes by the threshold diameter of 3 mm is adopted due to the lack of a well-established theory but is in line with that recommended by Kandlikar [Citation12, Citation13]. Using this threshold diameter enables more relevant studies to be included and thus the different flow boiling heat transfer characteristics, mechanisms and models in various tubes can be compared and analyzed. This distinction is also reasonable and valid for the practical use in the CO2 air-conditioning, heat pump and refrigeration systems.
The mechanistic heat transfer model for flow boiling of CO2 in macroscale and microchannels
Cheng et al. [Citation23, Citation24] proposed a new flow pattern map and a new flow boiling heat transfer model based on the flow patterns, especially for CO2 flow boiling inside horizontal tubes. In particular, they related the flow patterns to the corresponding CO2 flow boiling heat transfer mechanisms in both macroscale and microscale tubes under a wide range of reduced pressures and operation conditions. Furthermore, Cheng et al. [Citation25, Citation26] updated their flow boiling heat transfer model for CO2 to cover a wider range of conditions to meet the requirement of industrial design of evaporators. The physical properties of CO2 obtained from REFPROP version 6.01 of NIST [Citation30] were used in their flow map and heat transfer models. Combining with the updated flow boiling heat transfer model for CO2, the annular flow to the dryout region transition boundary was further modified to better fit the sharp changes in flow boiling heat transfer characteristics for higher mass velocities. The new generalized flow boiling heat transfer model predicted well an extensive experimental database derived from the literature [Citation25, Citation26].
As the physical properties of CO2 from various software packages are used in the literature [Citation30, Citation31], there are some differences among these packages. The physical properties have some effect on reducing experimental and simulation results. Cheng et al. [Citation4] evaluated the effects of the physical properties on flow boiling heat transfer and flow pattern maps using various physical properties of REFPROP 6.01 [Citation30], REFPROP 7.0 [Citation31], REFPROP 9.1 [Citation32] and EES [Citation33]. They have found that REFPROP 6.01 gives slightly different simulated results while other property packages give the same results. The difference of the simulated heat transfer coefficients is less than 8%, which has negligible effect on the flow pattern maps and flow boiling heat transfer. Therefore, physical properties from all the packages can be used in the Cheng et al. [Citation25, Citation26] flow pattern map, heat transfer model, and have insignificant effects on the prediction for heat transfer coefficients.
The general equation for the local flow boiling heat transfer coefficients htp in a horizontal tube is expressed as follows:(1)
(1) where θdry is the dry angle defined in . The dry angle θdry defines the flow structures and the ratio of the tube perimeter in contact with liquid and vapor. The vapor phase heat transfer coefficient on the dry perimeter hV is calculated with the Dittus–Boelter correlation assuming tubular flow in the tube, which can be found in [Citation23, Citation26].
Figure 1. Schematic physical model of flow boiling heat transfer inside a horizontal tube.
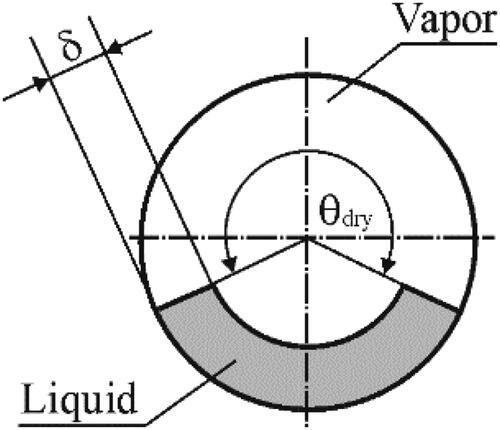
The heat transfer coefficient on the wet perimeter hwet is calculated with an asymptotic model which combines the nucleate boiling and convective evaporation heat transfer contributions to the overall flow boiling heat transfer by the third power as follows:(2)
(2) where hnb, S and hcb are, respectively, nucleate boiling heat transfer coefficient, nucleate boiling heat transfer suppression factor and convective evaporation heat transfer coefficient. The nucleate boiling heat transfer coefficient hnb is calculated with the Cheng et al. [Citation23, Citation26] nucleate boiling correlation for CO2. The Cheng et al. [Citation23, Citation26] nucleate boiling heat transfer suppression factor S for CO2 is applied to reduce the nucleate boiling heat transfer contribution due to the thinning of the annular liquid film. The convective evaporation heat transfer coefficient hcb is calculated with the convective correlation assuming an annular liquid film, which can be found in [Citation23, Citation26].
shows the Cheng et al. [Citation25, Citation26] flow pattern map and simulation results of flow boiling model for CO2 at the indicated conditions, superimposed on the same graphs. Simulation results for two tubes with diameters of 1.15 mm and 3 mm using the model show different flow boiling heat transfer trends and the corresponding flow patterns as in . The process path for the vapor quality variation from x = 0.01 to x = 0.99 is shown as the horizontal broken line (dash-dot line) while the variation in the heat transfer coefficient as it changes vapor quality and flow pattern is depicted by the dashed line. The flow pattern boundaries are in solid lines. The line (dashed line with arrows) indicates the calculated heat transfer coefficient at the indicated mass flux and vapor quality. Notice the various changes in trends in the heat transfer coefficient as this occurs. For example, when the flow regime passes from the annular flow into the dryout regime, there is a sharp inflection in the heat transfer coefficient as the top perimeter of the tube becomes dry. The prediction of flow boiling heat transfer is a big challenge depending on the various fluids and conditions. In particular, the reduced pressure and microscale tube effects become significant and need to be well understood [Citation4, Citation9]. In particular, the flow boiling mechanisms at macroscale and microscale tubes should be further investigated from new mechanisms relevant to unstable flow boiling phenomena and transient heat transfer behavior at low and high reduced pressures [Citation4, Citation5].
Figure 2. Modeling of flow boiling heat transfer of CO2 imposed on the corresponding flow pattern map using the Cheng et al. model [Citation25, Citation26]. I: Intermittent flow; A: Annular flow; B: Bubbly flow; SW: Stratified-wave flow; S: Stratified flow; Slug: Slug flow; D: Dryout; M: Mist flow. (a) For 1.15 mm tube at the conditions: q = 11 kW/m2, Tsat = 10 °C and G = 300 kg/m2s with indicated value at vapor quality x = 0.30; (b) For 3 mm tube at the conditions: q = 20 kW/m2, Tsat = 10 °C and G = 390 kg/m2s with indicated value at vapor quality x = 0.70.
![Figure 2. Modeling of flow boiling heat transfer of CO2 imposed on the corresponding flow pattern map using the Cheng et al. model [Citation25, Citation26]. I: Intermittent flow; A: Annular flow; B: Bubbly flow; SW: Stratified-wave flow; S: Stratified flow; Slug: Slug flow; D: Dryout; M: Mist flow. (a) For 1.15 mm tube at the conditions: q = 11 kW/m2, Tsat = 10 °C and G = 300 kg/m2s with indicated value at vapor quality x = 0.30; (b) For 3 mm tube at the conditions: q = 20 kW/m2, Tsat = 10 °C and G = 390 kg/m2s with indicated value at vapor quality x = 0.70.](/cms/asset/547720a7-03a7-499e-be06-ebf09bb33819/uhte_a_2140631_f0002_c.jpg)
Modeling of flow boiling heat transfer of CO2 in macroscale and microscale tubes
The effects of the reduced pressure, heat flux, mass flux and tube size on flow boiling heat transfer of CO2 were simulated at low and high reduced pressures. In order to understand the heat transfer characteristics and the corresponding mechanisms, simulation results of flow boiling heat transfer of CO2 in macroscale and microscale tubes using the Cheng et al [Citation25, Citation26] model are presented according to the reduced pressures larger than 0.45 and lower than 0.45, respectively. Simulation results of the tube diameters at low and high reduced pressures are analyzed to illustrate the tube size effect on the heat transfer characteristics and the corresponding mechanisms.
Simulation results of flow boiling heat transfer of CO2 at the reduced pressures larger than 0.45
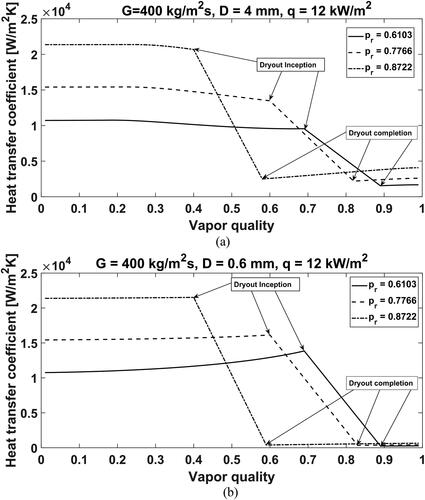
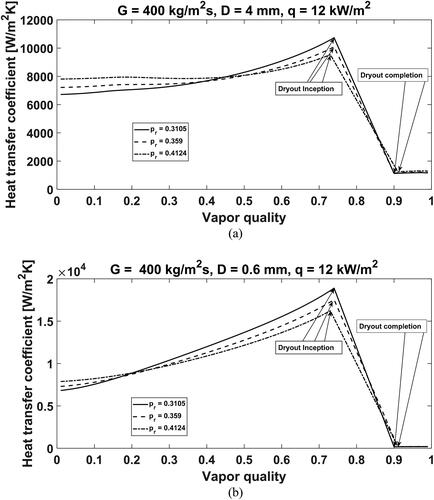
shows the simulated flow boiling heat transfer coefficients of CO2 in macroscale and microscale tubes with diameters of 4 mm and 0.6 mm at three reduced pressures larger than 0.45. With increasing the reduced pressure, the heat transfer coefficient increases significantly for both the macroscale and microscale tubes. Dryout occurs earlier at higher reduced pressures than that at lower reduced pressures. Before the dryout inception, flow boiling heat transfer trends are flat. This means nucleate boiling is the dominant heat transfer mechanism for both the macroscale and microscale tubes at high reduced pressures.
Figure 3. Simulation of flow boiling heat transfer coefficients in macroscale and microscale tubes at three reduced pressures larger than 0.45. (a) Heat transfer coefficient vs. vapor quality in a macroscale tube with a diameter of 4 mm at indicated conditions; (b) Heat transfer coefficient vs. vapor quality in a microscale tube with a diameter of 0.6 mm at indicated conditions.
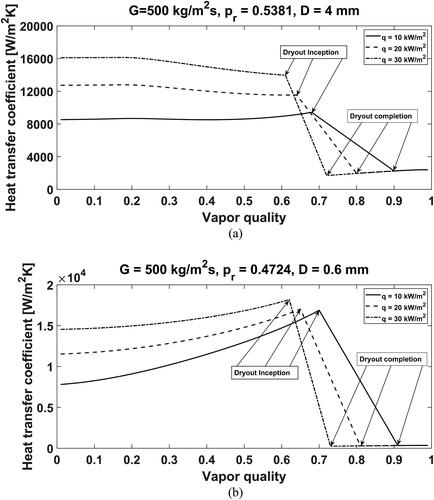
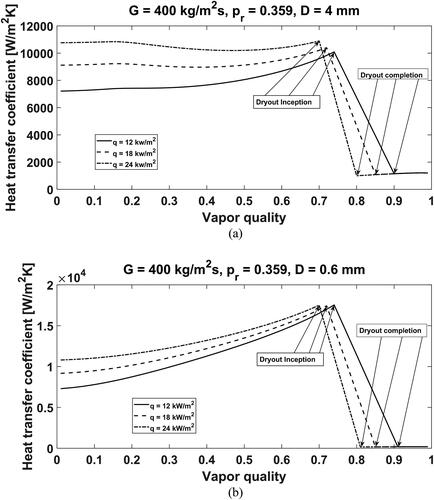
shows the simulated flow boiling heat transfer coefficients in macroscale and microscale tubes with diameters of 4 mm and 0.6 mm at three heat fluxes. For both the macroscale and microscale tubes, with increasing the heat flux, the heat transfer coefficient increases significantly. This means the heat transfer is strongly affected by the heat flux and nucleate boiling is the dominant heat transfer mechanism. However, the heat transfer trends for both the macroscale and microscale tubes are different. Before the dryout inception, the heat transfer trends are flat in the macroscale tube with the diameter of 4 mm while the heat transfer coefficient somehow increases with increasing the vapor quality for the microscale tube with the diameter of 0.6 mm. This means that nucleate boiling is the dominant heat transfer mechanism for the macroscale tube while both nucleate boiling and convection evaporation are the dominant heat transfer mechanisms for the microscale tube. The tube size influences the heat transfer behaviors and mechanisms.
Figure 4. Simulation of flow boiling heat transfer coefficients in macroscale and microscale tubes at three heat fluxes. (a) Heat transfer coefficient vs. vapor quality in a macroscale tube with a diameter of 4 mm at indicated conditions; (b) Heat transfer coefficient vs. vapor quality in a microscale tube with a diameter of 0.6 mm at indicated conditions.
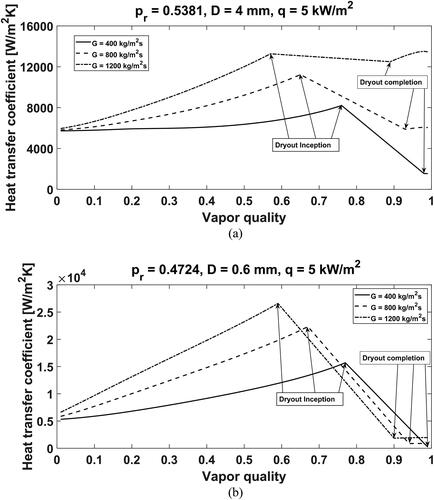
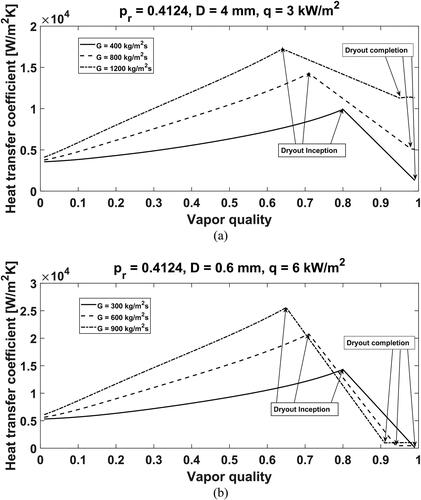
shows the simulated flow boiling heat transfer coefficients in the macroscale and microscale tubes with diameters of 4 mm and 0.6 mm at three mass fluxes. For both the macroscale and microscale tubes, with increasing the mass flux, the heat transfer coefficient increasing significantly. This means convection evaporation becomes strong and nucleate boiling is suppressed at high mass fluxes while both nucleate boiling and convection evaporation are the heat transfer mechanisms at low mass fluxes. The dryout occurs earlier at high mass fluxes than that at low mass fluxes. The tube size has insignificant effect on the dryout inception for both the macroscale and microscale tubes at the same working conditions.
Figure 5. Simulation of flow boiling heat transfer coefficients in macroscale and microscale tubes at three mass fluxes. (a) Heat transfer coefficient vs. vapor quality in a macroscale tube with a diameter of 4 mm at indicated conditions; (b) Heat transfer coefficient vs. vapor quality in a microscale tube with a diameter of 0.6 mm at indicated conditions.
Simulation results of flow boiling heat transfer of CO2 at reduced pressures less than 0.45
shows simulated flow boiling heat transfer coefficients of CO2 in macroscale and microscale tubes with diameters of 4 mm and 0.6 mm at three reduced pressures lower than 0.45. For both the macroscale and microscale tubes, with increasing the reduced pressure, the heat transfer coefficient increases at low vapor qualities while it decreases at high vapor qualities. This means nucleate boiling is the dominant heat transfer mechanism at low vapor qualities while convection evaporation becomes strong and nucleate boiling is suppressed at high vapor qualities. The reduced pressure has an insignificant effect on the dryout inception. Flow boiling heat transfer trends in the macroscale tube are flatter than those in the microscale tube as shown in . This means the tube size has a significant effect on the heat transfer behaviors and mechanisms. For the microscale tube, nucleate boiling is suppressed, and the convection evaporation is enhanced as of the effect of microscale tube.
Figure 6. Simulation of flow boiling heat transfer coefficients in macroscale and microscale tubes at three reduced pressures less than 0.45. (a) Heat transfer coefficient vs. vapor quality in a macroscale tube with a diameter of 4 mm at indicated conditions; (b) Heat transfer coefficient vs. vapor quality in a microscale tube with a diameter of 0.6 mm at indicated conditions.
shows the simulated flow boiling heat transfer coefficients in macroscale and microscale tubes with diameters of 4 mm and 0.6 mm at three heat fluxes. For both the macroscale and microscale tubes, with increasing the heat flux, the heat transfer coefficient increases significantly. This means the heat transfer is strongly affected by the heat flux and nucleate boiling is the dominant mechanism. However, the heat transfer trends for both the macroscale and microscale tubes are different. Before the dryout inception, the heat transfer coefficient curves are flat in the macroscale tube with the diameter of 4 mm while the heat transfer coefficient increases significantly with increasing the vapor quality for the microscale tube with the diameter of 0.6 mm. This means that nucleate boiling is the dominant heat transfer mechanism for the macroscale tube while both nucleate boiling and convection evaporation are the mechanisms for the microscale tube.
Figure 7. Simulation of flow boiling heat transfer coefficients in macroscale and microscale tubes at three heat fluxes. (a) Heat transfer coefficient vs. vapor quality in a macroscale tube with a diameter of 4 mm at indicated conditions; (b) Heat transfer coefficient vs. vapor quality in a microscale tube with a diameter of 0.6 mm at indicated conditions.
shows the simulated flow boiling heat transfer coefficients in macroscale and microscale tubes with diameters of 4 mm and 0.6 mm at three mass fluxes. For both the macroscale and microscale tubes, with increasing the mass flux, the heat transfer coefficient increasing significantly. This means convection evaporation becomes strong and nucleate boiling is suppressed at high mass fluxes while both nucleate boiling and convection evaporations are the mechanisms at low mass fluxes. The dryout occurs earlier at high mass fluxes than that at low mass fluxes. The heat transfer behaviors are remarkably similar to those in . The tube size has insignificant effect on the dryout inception for both the macroscale and microscale tubes at the same working conditions.
Figure 8. Simulation of flow boiling heat transfer coefficients in macroscale and microscale tubes at three mass fluxes. (a) Heat transfer coefficient vs. vapor quality in a macroscale tube with a diameter of 4 mm at indicated conditions; (b) Heat transfer coefficient vs. vapor quality in a microscale tube with a diameter of 0.6 mm at indicated conditions.
Simulation results of the tube diameter effect on flow boiling heat transfer of CO2 at low and high reduced pressures
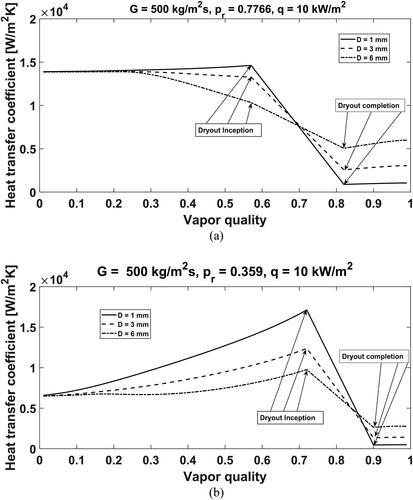
shows the simulated flow boiling heat transfer coefficients in macroscale and microscale tubes with three tube diameters of 1, 3 and 6 mm. As shown in , for the reduced pressure of 0.7766, the heat transfer coefficients are almost constant at low vapor qualities. This means nucleate boiling is the dominant mechanism for both the macroscale and microscale tubes. The dryout occurs earlier for the macroscale than that for the microscale tube. This means that dryout inception is postponed in the microscale tubes as compared to that in the macroscale tubes at the same working conditions. However, as shown in , for the reduced pressure of 0.359, with decreasing the tube diameter, the heat transfer coefficient increases significantly. Furthermore, the heat transfer coefficient increases significantly with increasing the vapor quality before the dryout inception. This indicates that convection evaporation becomes stronger for the microscale tubes as compared to that for macroscale tubes. The heat transfer trends in the macroscale tubes become flatter as compared to those in the microscale tubes. Therefore, nucleate boiling is the dominant mechanism in the macroscale tubes while it is suppressed in the microscale tubes. Furthermore, the tube size has insignificant effect on the dryout inception for both the macroscale and microscale tubes at the same working conditions.
Figure 9. Simulation of flow boiling heat transfer coefficients in macroscale and microscale tubes at three diameters at the same mass flux and heat flux. (a) Heat transfer coefficient vs. vapor quality at the reduced pressure of 0.7766; (b) Heat transfer coefficient vs. vapor quality at indicated the reduced pressure of 0.359.
Comparison of predicted of flow boiling heat transfer coefficients of CO2 in macroscale and microscale tubes to the experimental data at low and high reduced pressures
Several experimental studies on CO2 flow boiling heat transfer have been published in the literature after the Cheng et al. [Citation25, Citation26] mechanistic heat transfer models for flow boiling of CO2 were developed in 2006 and 2008. It is essential to evaluate the Cheng et al. [Citation25, Citation26] models with the new experimental data. A database containing 3609 experimental flow boiling heat transfer data points in macroscale and microscale tubes has been set up by digitizing data from the literature. and list the experimental conditions of the database for macroscale tubes [Citation34–42] and microscale tubes [Citation43–50], respectively. The database covers a wide range of test conditions: the reduced pressure pr from 0.1332 to 0.9082 (the corresponding saturation temperature Tsat from −40.6 to 26.77 °C), the tube diameter D from 0.529 to 9.52 mm, the heat flux q from 2 to 72 kW/m2 and mass flux G from 100 to 1500 kg/m2s. Some of the experimental conditions are beyond the applicable ranges of the Cheng et al. [Citation25, Citation26] mechanistic heat transfer model and the corresponding flow pattern map. Therefore, some predicted heat transfer coefficients and flow patterns are extrapolated to a wider range of conditions.
Table 1. Experimental database of flow boiling heat transfer of CO2 in macroscale tubes.
Table 2. Experimental database of flow boiling heat transfer of CO2 in microscale tubes.
The predicted flow boiling heat transfer coefficients were compared to the database for macroscale and microscale tubes in and . shows the comparation of the predicted flow boiling heat transfer coefficients to the experimental data in macroscale tubes with diameters of 6 mm and 6.1 mm at low and high reduced pressures of 0.3105 [Citation37] and 0.569 [Citation38]. The model captures the experimental heat transfer trends and favorably predicts the experimental data before the dryout in the two macroscale tubes at the indicated conditions. However, the model underpredicts the dryout inceptions for both the macroscale and microscale tubes. shows the comparison of the predicted flow boiling heat transfer coefficients to the experimental data in the microscale tube with a diameter of 0.529 at low and high reduced pressures of 0.359 and 0.4724 [Citation45]. As shown in , the model captures the heat transfer trend and favorably predicts the experimental data before the dryout but underpredicts the dryout inception at the indicated experimental conditions. As shown in , the model captures the heat transfer trend and favorably predicts the experimental data and the dryout inception at the indicated experimental conditions. This confirms that the reduced pressure has a significant effect on the heat transfer model. shows the comparison of the predicted flow boiling heat transfer coefficients to the experimental data in two microscale tubes with diameters of 1.42 mm and 1 mm at low and high reduced pressures of 0.1935 [Citation46] and 0.538 [Citation48]. The model captures the experimental heat transfer trends and favorably predicts the experimental data before the dryout in the two macroscale tubes at the indicated conditions. However, the model underpredicts the dryout inceptions for both the microscale tubes. As the database is beyond the applicable conditions of the original data used for developing the model. The model is extrapolated to predict the experimental data at lower and higher reduced pressures, heat fluxes, mass fluxes and tube diameters than those of the model.
Figure 10. Comparison of the predicted flow boiling heat transfer coefficients to the experimental data in macroscale tubes at low and high reduced pressures. (a) Comparative results in the macroscale tube with a diameter of 6 mm at the reduced pressure of 0.3105 [Citation37]; (b) Comparative results in the macroscale tube with a diameter of 6.1 mm at the reduced pressure of 0.569 [Citation38].
![Figure 10. Comparison of the predicted flow boiling heat transfer coefficients to the experimental data in macroscale tubes at low and high reduced pressures. (a) Comparative results in the macroscale tube with a diameter of 6 mm at the reduced pressure of 0.3105 [Citation37]; (b) Comparative results in the macroscale tube with a diameter of 6.1 mm at the reduced pressure of 0.569 [Citation38].](/cms/asset/2cf33f73-31e2-435c-8166-cb2f9f863544/uhte_a_2140631_f0010_b.jpg)
Figure 11. Comparison of the predicted flow boiling heat transfer coefficients to the experimental data in microscale tubes at low and high reduced pressures. (a) Comparative results in the macroscale tube with a diameter of 0.529 mm at the reduced pressure of 0.359 [Citation45]; (b) Comparative results in the macroscale tube with a diameter of 0.529 mm at the reduced pressure of 0.4724 [Citation45].
![Figure 11. Comparison of the predicted flow boiling heat transfer coefficients to the experimental data in microscale tubes at low and high reduced pressures. (a) Comparative results in the macroscale tube with a diameter of 0.529 mm at the reduced pressure of 0.359 [Citation45]; (b) Comparative results in the macroscale tube with a diameter of 0.529 mm at the reduced pressure of 0.4724 [Citation45].](/cms/asset/7cec1232-df04-438a-b848-350aa63774d7/uhte_a_2140631_f0011_b.jpg)
Figure 12. Comparison of the predicted flow boiling heat transfer coefficients to the experimental data in microscale tubes at low and high reduced pressures. (a) Comparative results in the macroscale tube with a diameter of 1.42 mm at the reduced pressure of 0.1935 [Citation46]; (b) Comparative results in the macroscale tube with a diameter of 1 mm at the reduced pressure of 0.538 [Citation48].
![Figure 12. Comparison of the predicted flow boiling heat transfer coefficients to the experimental data in microscale tubes at low and high reduced pressures. (a) Comparative results in the macroscale tube with a diameter of 1.42 mm at the reduced pressure of 0.1935 [Citation46]; (b) Comparative results in the macroscale tube with a diameter of 1 mm at the reduced pressure of 0.538 [Citation48].](/cms/asset/49590bc7-1c95-419f-8055-8ffada62ed13/uhte_a_2140631_f0012_b.jpg)
The whole database in and were compared to the predicted heat transfer coefficients with the Cheng et al. [Citation25, Citation26] mechanistic heat transfer model. lists the statistical results of the comparison. The Cheng et al. [Citation25, Citation26] model predicts 56.9% of the entire database within ±30%. In particular, the model predicts 81.3% of all the data without dryout and mist flow data within ±30%. This is good and promising. However, it only predicts 21% of the dryout and mist flow data within ±30%. The main reason is because the model underpredicts the dryout inception for a number of experimental data. Thus, a large number of data points are mistaken as the dryout and mist flow data which should be the data before the dryout inception. Therefore, the prediction methods for the dryout inception and completion in the flow pattern map and the corresponding heat transfer methods should be improved for better prediction of the heat transfer coefficients. According to the modeling results, the effects of the reduced pressure, tube diameter, heat flux and mass flux should be incorporated in the prediction methods for dryout inception and completion. The heat transfer mechanisms should be related to the corresponding heat transfer prediction methods for various flow patterns.
Table 3. Statistical analysis of the predicted flow boiling heat transfer coefficients by the Cheng et al. [Citation25, Citation26] mechanistic heat transfer model for flow boiling of CO2.
Discussion of the flow boiling heat transfer mechanisms
Flow boiling heat transfer in macroscale tubes is governed by two basic mechanisms of nucleate boiling dominant mechanism relating to the formation of vapor bubbles at the tube wall surface and convection dominant mechanism relating to conduction and convection through a thin liquid film with evaporation on the tube wall and at the liquid–vapor interface. Flow boiling heat transfer and dryout mechanisms are intrinsically related to the bubble dynamics and flow pattern behavior [Citation51–55]. Gravity becomes important for flow boiling in horizontal conventional tubes and affects the flow patterns and heat transfer characteristics. From the simulation results in the present study, flow boiling heat transfer is strongly dependent on the heat flux in nucleation dominant boiling is enhanced while the heat transfer is less dependent on the heat flux and strongly dependent on the mass flux and vapor quality in convection dominant evaporation. One may assume that these mechanisms function independently of one another for simplicity. However, the two main mechanisms may coexist at high vapor qualities, where the convective evaporation gradually suppresses the nucleate boiling. Therefore, the nucleate boiling and convective evaporation contributions to the heat transfer process can be superimposed by extraordinarily complex mechanisms which are not yet fully understood so far. For microscale tubes, the flow boiling heat transfer mechanisms are strongly affected by the bubble behaviors in confined space and the unstable bubble dynamics [Citation54, Citation55]. These observed phenomena have not yet been incorporated into the flow pattern and heat transfer prediction methods. From the simulation results and the existing experimental data, the reduced pressure has a significant effect on the flow boiling heat transfer and dryout behaviors and mechanisms. The combination effects of tube diameter, the reduced pressure, the heat flux, and mass flux are extremely complicated but should be incorporated in the flow pattern map and heat transfer model for better prediction for the heat transfer. Furthermore, general prediction methods are needed for flow boiling heat transfer based on the flow patterns. In this aspect, several flow patterns-based mechanistic flow boiling heat transfer models have been developed and show promising results. Cheng et al. [Citation25, Citation26] developed the comprehensive flow pattern map and a general flow boiling heat transfer model based on the flow patterns especially for CO2. However, further improvement of the model should focus on the dryout and mist flow regimes by incorporating new insights of mechanisms under unstable evaporation flow and transient heat transfer phenomena at a wide range of conditions of the reduced pressures, tube diameters, heat fluxes and mass fluxes.
Conclusions
The heat transfer characteristics and mechanisms of flow boiling of CO2 in macroscale and microscale tubes were investigated via simulations using the Cheng et al. [Citation25, Citation26] mechanistic heat transfer model for flow boiling of CO2. The effects of the reduced pressures, heat fluxes, mass fluxes and tube diameters on the model have been systematically analyzed. The following conclusions have been obtained from the present study:
The reduced pressure has a significant effect on the heat transfer characteristics and mechanisms. The simulation results show that nucleate boiling is dominant at high reduced pressures while both nucleate boiling and convection boiling are dominant at low reduced pressures for flow boiling of CO2 in both macroscale and microscale tubes. The heat transfer mechanisms are the dominance of the nucleate boiling at low/moderate vapor qualities prior to dryout and the occurrence of dryout in CO2 at lower vapor qualities than conventional refrigerants. Furthermore, the effect of the reduced pressure (saturation temperature) on the flow boiling heat transfer coefficient is more noticeable. At high reduced pressures (high saturation temperatures), the nucleate boiling mechanism is more pronounced at low vapor qualities.
With increasing the heat flux, the heat transfer coefficient increases in both macroscale and microscale tubes significantly. The heat transfer is strongly affected by the heat flux and the dominant mechanism is nucleate boiling. However, the heat transfer trends for both the macroscale and microscale tubes are slightly different and nucleate boiling is reduced in the microscale tubes.
With increasing the mass flux, the heat transfer coefficient increasing significantly in both the macroscale and microscale tubes. Convection evaporation is enhanced, and nucleate boiling is suppressed at high mass fluxes while both nucleate boiling and convection evaporation are the dominant heat transfer mechanisms at low mass fluxes. The dryout occurs earlier at high mass fluxes than that at low mass fluxes.
The predicted heat transfer coefficients using the Cheng et al. [Citation25, Citation26] mechanistic heat transfer model for flow boiling of CO2 predicts 81.3% of the entire database without dryout and mist flow data within ±30% while it only predicts 21% of the dryout and mist flow data within ±30%. The poor predicted results in the dryout and mist flow regions are mainly because the model does not capture the dryout inception and completion of flow boiling at the low and reduced pressures.
Regarding the heat transfer mechanisms of flow boiling of CO2, the present study has suggested a clear dominance of nucleate boiling heat transfer even at a large mass flux. Therefore, CO2 has much higher heat transfer coefficients than those of conventional refrigerants at the same reduced pressure. The combined nucleate boiling and convective evaporation mechanisms are affected by many factors such as reduced pressure, heat flux, mass flux and tube diameter.
New mechanisms should be investigated to understand the unstable and transient evaporation processes. The mechanisms should be incorporated in the improvement of the model in future for better prediction of heat transfer coefficients at a wide range of conditions. Furthermore, effort should be made to develop new prediction methods by considering the unstable and transient two-phase flow and flow boiling of CO2 as well.
| Nomenclature | ||
| A | = | annular flow |
| B | = | bubbly flow |
| D | = | internal tube diameter, m; dryout flow regime |
| G | = | total vapor and liquid two-phase mass flux, kg/m2s |
| h | = | heat transfer coefficient, W/m2K |
| hcb | = | liquid film convection boiling heat transfer coefficient, W/m2K |
| hnb | = | nucleate boiling heat transfer coefficient, W/m2K |
| htp | = | two phase heat transfer coefficient, W/m2K |
| hV | = | vapor phase heat transfer coefficient, W/m2K |
| hwet | = | heat transfer coefficient of the wetted perimeter, W/m2K |
| I | = | intermittent flow |
| i | = | data number |
| M | = | mist flow |
| N | = | number of data points |
| p | = | pressure, Pa |
| pcrit | = | critical pressure, Pa |
| pr | = | reduced pressure, p/pcrit |
| q | = | heat flux, W/m2 |
| S | = | nucleate boiling suppression factor; stratified flow |
| Slug | = | slug flow |
| SW | = | stratified-wave flow |
| T | = | temperature, K |
| Tcrit | = | critical temperature, K |
| Tsat | = | saturation temperature, K |
| x | = | vapor quality |
| Greek symbols | ||
| δ | = | liquid film thickness, m |
| θdry | = | dry angle of tube perimeter, rad |
| σ | = | standard deviation, % |
| ξ | = | relative error, % |
| = | average error, % | |
| = | mean error, % | |
| Subscripts | ||
| cb | = | convection boiling |
| crit | = | critical |
| nb | = | nucleate boiling |
| sat | = | saturation |
| tp | = | two-phase |
| V | = | vapor |
| wet | = | on the wet perimeter |
Disclosure statement
No conflict of interest was reported by the authors.
Additional information
Notes on contributors

Lixin Cheng
Lixin Cheng has worked at Sheffield Hallam University since 2016. He obtained his Ph.D. in Thermal Energy Engineering at the State Key Laboratory of Multiphase Flow at Xi’an Jiaotong University, China in 1998. He has received several prestigious awards such as Alexander von Humboldt Fellowship in Germany in 2006, an ERCOFTAC Visitor Grant in Switzerland in 2010 and a Distinguished Visiting Professorship of the City of Beijing, China in 2015. His research interests are multiphase flow and heat transfer and thermal energy engineering. He has published more than 100 papers in journals and conferences, 9 book chapters and edited 10 books. He has delivered more than 60 keynote and invited lectures worldwide. He has been the chair of the World Congress on Momentum, Heat and Mass Transfer (MHMT) since 2017. He is one of the founders and co-chair of the International Symposium of Thermal-Fluid Dynamics (ISTFD) series since 2019. He is associate editor of Heat Transfer Engineering, Heat Transfer Research and Journal of Fluid Flow, Heat and Mass Transfer, and international advisor of Thermal Power Generation (a Chinese journal).

Guodong Xia
Guodong Xia is a leading professor in Thermal Energy Engineering at Beijing University of Technology, China. He received his Ph.D. in Thermal Energy Engineering at the State Key Laboratory of Multiphase Flow of Xi’an Jiaotong University, China in 1996. He was a visiting professor in the Institute of Process Engineering at the University of Hanover, Germany in 2000–2001. His research interests include fundamentals and applications of microscale heat transfer, multiphase flow and heat transfer, waste energy recovery, thermal energy system, heat exchanger design and enhanced heat transfer. He is a member of the multiphase flow committee of the Chinese Society of Engineering Thermophysics and a member of the multiphase flow committee of the Chinese Society of Theoretical and Applied Mechanics. He has published more than 150 papers in journals and conferences.
References
- M. H. Kim, J. Pettersen, and C. W. Bullard, “Fundamental process and system design issues in CO2 vapor compression systems,” Prog. Energy Combust. Sci., vol. 30, no. 2, pp. 119–174, 2004. DOI: 10.1016/j.pecs.2003.09.002.
- J. R. Thome and G. Ribatski, “State-of-the-art of two-phase flow and flow boiling heat transfer and pressure drop of CO2 in macro- and micro-channels,” Int. J. Refrig., vol. 28, no. 8, pp. 1149–1168, 2005. DOI: 10.1016/j.ijrefrig.2005.07.005.
- J. Pettersen, “Two phase flow patterns in microchannel vaporization of CO2 at near-critical pressure,” Heat Transfer Eng., vol. 25, no. 3, pp. 52–60, 2004. DOI: 10.1080/01457630490280100.
- L. Cheng, G. Xia, and J. R. Thome, “Flow boiling heat transfer and two-phase flow phenomena of CO2 in macro- and micro-channel evaporators: fundamentals, applications and engineering design,” Appl. Therm. Eng., vol. 195, no. 170770, 2021. DOI: 10.1016/j.applthermaleng.2021.117070.
- L. Cheng, G. Xia, and Q. Li, “CO2 evaporation process modelling: fundamentals and engineering applications,” Heat Transfer Eng., vol. 43, no. 8–10, pp. 1–28, 2022. DOI: 10.1080/01457632.2021.1905297.
- L. Cheng and J. R. Thome, “Cooling of microprocessors using flow boiling of CO2 in micro-evaporators: preliminary analysis and performance comparison,” Appl. Therm. Eng., vol. 29, no. 11–12, pp. 2426–2432, 2009. DOI: 10.1016/j.applthermaleng.2008.12.019.
- L. Cheng, G. Ribatski, and J. R. Thome, “Analysis of supercritical CO2 cooling in macro- and micro-channels,” Int. J. Refrig., vol. 31, no. 8, pp. 1301–1316, 2008. DOI: 10.1016/j.ijrefrig.2008.01.010.
- L. Cheng, “Evaluation of correlations for supercritical CO2 cooling convective heat transfer and pressure drop in macro- and micro-scale tubes,” Int. J. Microscale Nanoscale Therm. Fluid Transp. Phenom., vol. 5, no. 2, pp. 113–126, 2014.
- L. Cheng and G. Xia, “Flow boiling heat transfer and two-phase flow of carbon dioxide: fundamentals, mechanistic models and applications,” Proc. the 4th World Congr. Momentum, Heat Mass Transfer (MHMT'19) Rome, Italy, Apr. 10–12, 2019. DOI: 10.11159/icmfht19.2.
- J. Patiño et al., “A comparative analysis of a CO2 evaporator model using experimental heat transfer correlations and a flow pattern map,” Int. J. Heat Mass Transfer, vol. 71, pp. 361–375, Apr. 2014. DOI: 10.1016/j.ijheatmasstransfer.2013.12.027.
- S. Yamaguchi, D. Kato, K. Saito, and S. Kawai, “Development and validation of static simulation model for CO2 heat pump,” Int. J. Heat Mass Transfer, vol. 54, no. 9–10, pp. 1896–1906, 2011. DOI: 10.1016/j.ijheatmasstransfer.2011.01.013.
- S. G. Kandlikar, “A roadmap for implementing minichannels in refrigeration and air-conditioning systems - current status and future directions,” Heat Transfer Eng., vol. 28, no. 12, pp. 973–985, 2007. DOI: 10.1080/01457630701483497.
- S. G. Kandlikar, “Fundamental issues related to flow boiling in minichannels and microchannels,” Exp. Therm. Fluid Sci., vol. 26, no. 2–4, pp. 389–407, 2002. DOI: 10.1016/S0894-1777(02)00150-4.
- L. Cheng and D. Mewes, “Review of two-phase flow and flow boiling of mixtures in small and mini channels,” Int. J. Multiphase Flow, vol. 32, no. 2, pp. 183–207, 2006. DOI: 10.1016/j.ijmultiphaseflow.2005.10.001.
- J. R. Thome, L. Cheng, G. Ribatski, and L. F. Vales, “Flow boiling of ammonia and hydrocarbons: a state-of-the-art review,” Int. J. Refrig., vol. 31, no. 4, pp. 603–620, 2008. DOI: 10.1016/j.ijrefrig.2007.11.010.
- L. Cheng and T. Cheng, “Comparison of six typical correlations for upward flow boiling heat transfer with kerosene in a vertical smooth tube,” Heat Transfer Eng., vol. 21, no. 5, pp. 27–34, 2000. DOI: 10.1080/01457630050127928.
- L. Cheng and D. Xia, “Fundamental issues, mechanisms and models of flow boiling heat transfer in microscale channels,” Int. J. Heat Mass Transfer, vol. 108, pp. 97–127, May 2017. DOI: 10.1016/j.ijheatmasstransfer.2016.12.003.
- L. Cheng, “Fundamental issues of critical heat flux phenomena during flow boiling in microscale-channels and nucleate pool boiling in confined spaces,” Heat Transfer Eng., vol. 34, no. 13, pp. 1011–1043, 2013. DOI: 10.1080/01457632.2013.763538.
- L. Cheng, “Microscale flow patterns and bubble growth in microchannels,” in Microchannel Phase Change Heat Transfer, Sujoy Kumar Saha, Ed. Butterworth-Heinemann, Oxford, UK: Elsevier Publisher, 2016, pp. 91–140. DOI: 10.1016/B978-0-12-804318-9.00003-0.
- L. Cheng, “Flow boiling heat transfer with models in microchannels,” in Microchannel Phase Change Heat Transfer, Sujoy Kumar Saha, Ed. Elsevier Publisher, 2016, pp. 141–191. DOI: 10.1016/B978-0-12-804318-9.00004-2.
- L. Cheng, G. Ribatski, and J. R. Thome, “Two-phase flow patterns and flow pattern maps: fundamentals and applications,” ASME Appl. Mech. Rev., vol. 61, no. 5, article no. 50802, p. 28, Sept. 2008. DOI: 10.1115/1.2955990.
- G. Xia, B. Cai, L. Cheng, and Z. Wang, “Flow regime visualization and identification of air–water two-phase flow in a horizontal helically coiled rectangular channel,” Heat Transfer Eng., vol. 43, no. 8–10, pp. 1–19, 2022. DOI: 10.1080/01457632.2021.1905313.
- L. Cheng, G. Ribatski, L. Wojtan, and J. R. Thome, “New flow boiling heat transfer model and flow pattern map for carbon dioxide evaporating inside horizontal tubes,” Int. J. Heat Mass Transfer, vol. 49, no. 21–22, pp. 4082–4094, 2006. DOI: 10.1016/j.ijheatmasstransfer.2006.04.003.
- L. Cheng, G. Ribatski, L. Wojtan, and J. R. Thome, “Erratum to: new flow boiling heat transfer model and flow pattern map for carbon dioxide evaporating inside tubes, [Heat Mass Transfer 49 (21-22) (2006) 4082-4094],” Int. J. Heat Mass Transfer, vol. 50, no. 1–2, pp. 391, 2007. DOI: 10.1016/j.ijheatmasstransfer.2006.07.033.
- L. Cheng, G. Ribatski, J. Moreno Quibén, and J. R. Thome, “New prediction methods for CO2 evaporation inside tubes: part I - a general two-phase flow pattern map and development of a phenomenological model of two-phase flow frictional pressure drop,” Int. J. Heat Mass Transfer, vol. 51, no. 1–2, pp. 111–124, 2008. DOI: 10.1016/j.ijheatmasstransfer.2007.04.002.
- L. Cheng, G. Ribatski, and J. R. Thome, “New prediction methods for CO2 evaporation inside tubes: part II - a general flow boiling heat transfer model based on flow patterns,” Int. J. Heat Mass Transfer, vol. 51, no. 1–2, pp. 125–135, 2008. DOI: 10.1016/j.ijheatmasstransfer.2007.04.001.
- J. Moreno Quibén, L. Cheng, R. J. da Silva Lima, and J. R. Thome, “Flow boiling in horizontal flattened tubes: part I — two-phase frictional pressure drops results and model,” Int. J. Heat Mass Transfer, vol. 52, no. 15–16, pp. 3634–3644, 2009. DOI: 10.1016/j.ijheatmasstransfer.2008.12.032.
- J. Moreno Quibén, L. Cheng, R. J. da Silva Lima, and J. R. Thome, “Flow boiling in horizontal flattened tubes: part II — flow boiling heat transfer results and model,” Int. J. Heat Mass Transfer, vol. 52, no. 15–16, pp. 3645–3653, 2009. DOI: 10.1016/j.ijheatmasstransfer.2008.12.033.
- L. Cheng, G. Ribatski– and J. R. Thome, “On the prediction of flow boiling heat transfer of CO2,” The 22nd IIR Int. Congr. Refrig., Beijing, P.R. China, Aug. 21–26, 2007.
- REFPROP. NIST Refrigerant Properties Database 23. Gaithersburg, MD, 1998, Version 6.01.
- REFPROP. NIST Refrigerant Properties Database 23. Gaithersburg, MD, 2002, Version 7.0.
- REFPROP. NIST Refrigerant Properties Database 23. Gaithersburg, MD, 2013, Version 9.1.
- EES, Engineering Equation Solver, Wisconsin: F-Chart MdthaSoftware Inc., 2005.
- J. J. Cho and M. S. Kim, “Experimental studies on the evaporative heat transfer and pressure drop of CO2 in smooth and micro-fin tubes of the diameters of 5 and 9.52mm,” “Int. J. Refrig., vol. 30, no. 6, pp. 986–994, 2007. DOI: 10.1016/j.ijrefrig.2007.01.007.
- X. Zhao and P. K. Bansal, “Experimental investigation on flow boiling heat transfer of CO2 at low temperatures,” Heat Transfer Eng, vol. 30, no. 1–2, pp. 2–11, 2009. DOI: 10.1080/01457630802289850.
- X. Zhao and P. K. Bansal, “Flow boiling heat transfer characteristics of CO2 at low temperatures,” Int. J. Refrig., vol. 30, no. 6, pp. 937–945, 2007. DOI: 10.1016/j.ijrefrig.2007.02.010.
- C. Y. Park and P. S. Hrnjak, “Flow boiling heat transfer of CO2 at low temperatures in a horizontal smooth tube,” J. Heat Transfer, vol. 127, no. 12, pp. 1305–1312, 2005. DOI: 10.1115/1.2098853.
- S. Grauso, R. Mastrullo, A. W. Mauro, and G. P. Vanoli, “Flow boiling of R410A and CO2 from low to medium reduced pressures in macro channels: experiments and assessment of prediction methods,” Int. J. Heat Mass Transfer, vol. 56, no. 1–2, pp. 107–118, 2013. DOI: 10.1016/j.ijheatmasstransfer.2012.09.015.
- H.-K. Oh and C.-H. Son, “Flow boiling heat transfer and pressure drop characteristics of CO2 in horizontal tube of 4.57-mm inner diameter,” Appl. Therm. Eng., vol. 31, no. 2–3, pp. 163–172, 2011. DOI: 10.1016/j.applthermaleng.2010.08.026.
- S. Grauso, R. Mastrullo, A. W. Mauro, and G. P. Vanoli, “CO2 and propane blends: experiments and assessment of predictive methods for flow boiling in horizontal tubes,” Int. J. Refrig., vol. 34, no. 4, pp. 1026–11039, 2011. DOI: 10.1016/j.ijrefrig.2011.03.001.
- R. Mastrullo, A. W. Mauro, A. Rosato, and G. P. Vanoli, “Carbon dioxide heat transfer coefficients and pressure drops during flow boiling: assessment of predictive methods,” Int. J. Refrig, vol. 33, no. 6, pp. 1068–1085, 2010. DOI: 10.1016/j.ijrefrig.2010.04.005.
- R. Mastrullo, A. W. Mauro, A. Rosato, and G. P. Vanoli, “Carbon dioxide local heat transfer coefficients during flow boiling in a horizontal circular smooth tube,” Int. J. Heat Mass Transfer, vol. 52, no. 19–20, pp. 4189–4194, 2009. DOI: 10.1016/j.ijheatmasstransfer.2009.04.004.
- K.-I. Choi, A. S. Pamitran, C.-Y. Oh, and J.-T. Oh, “Boiling heat transfer of R-22, R-134a, and CO2 in horizontal smooth minichannels,” Int. J. Refrig., vol. 30, no. 8, pp. 1336–1346, 2007. DOI: 10.1016/j.ijrefrig.2007.04.007.
- M. Ozawa et al., “Flow pattern and boiling heat transfer of CO2 in horizontal small-bore tubes,” Int. J. Multiphase Flow, vol. 35, no. 8, pp. 699–709, 2009. DOI: 10.1016/j.ijmultiphaseflow.2009.04.003.
- M. Ducoulombier, S. Colasson, J. Bonjour, and P. Haberschill, “Carbon dioxide flow boiling in a single microchannel – part II: heat transfer,” Exp. Therm. Fluid Sci., vol. 35, no. 4, pp. 597–611, 2011. DOI: 10.1016/j.expthermflusci.2010.11.014.
- J. Wu et al., “Investigation of heat transfer and pressure drop of CO2 two-phase flow in a horizontal minichannel,” Int. J. Heat Mass Transfer, vol. 54, no. 9–10, pp. 2154–2162, 2011. DOI: 10.1016/j.ijheatmasstransfer.2010.12.009.
- L. Jiang, J. Liu, L. Zhang, Q. Liu, and X. Xu, “Characteristics of heat transfer for CO2 flow boiling at low temperature in mini-channel,” Int. J. Heat Mass Transfer, vol. 108, pp. 2120–2129, 2017. DOI: 10.1016/j.ijheatmasstransfer.2016.12.113.
- L. Jiang, J. Liu, L. Zhang, Q. Liu, and X. Xu, “A research on the dryout characteristics of CO2’S flow boiling heat transfer process in mini-channels,” Int. J. Heat Mass Transfer, vol. 83, pp. 131–142, Nov. 2017. DOI: 10.1016/j.ijrefrig.2017.07.017.
- L. Zhang, L. Jiang, J. Liu, and Y. Zhao, “Investigation of flow boiling heat transfer characteristics of CO2 in horizontal mini-tube,” Int. J. Therm. Sci., vol. 138, pp. 109–115, 2019. DOI: 10.1016/j.ijthermalsci.2018.11.032.
- K. Keniar, F. Mazzelli, and S. Garimella, “Experimental investigation of carbon dioxide flow boiling in a single microchannel,” Int. J. Heat Mass Transfer, vol. 159, no. 120100, Oct. 2020. DOI: 10.1016/j.ijheatmasstransfer.2020.120100.
- G. Xia, B. Cai, L. Cheng, Z. Wang, and Y. Jia, “Experimental study and modeling of average void fraction of gas-liquid two-phase flow in a horizontal helically coiled rectangular channel,” Exp. Therm. Fluid Sci., vol. 94, pp. 9–22, Jun. 2018. DOI: 10.1016/j.expthermflusci.2018.01.027.
- Y. Lv, G. Xia, L. Cheng, and D. Ma, “Experimental study on the pressure drop oscillation characteristics of the flow boiling instability with FC-72 in parallel rectangle microchannels,” Int. Comm. Heat Mass Transfer, vol. 108, no. 104289, Nov. 2019. DOI: 10.1016/j.icheatmasstransfer.2019.104289.
- Y. Lv, G. Xia, L. Cheng, and D. Ma, “Experimental investigation into unstable two-phase flow phenomena during flow boiling in multi-microchannels,” Int. J. Therm. Sci., vol. 166, no. 106985, Aug. 2021. DOI: 10.1016/j.ijthermalsci.2021.106985.
- G. Xia, Y. Lv, L. Cheng, D. Ma, and Y. Jia, “Experimental study and dynamic simulation of the continuous two phase instable boiling in multiple parallel microchannels,” Int. J. Heat Mass Transfer, vol. 138, pp. 961–984, Aug. 2019. DOI: 10.1016/j.ijheatmasstransfer.2019.04.124.
- G. Xia, Y. Cheng, L. Cheng, and Y. Li, “Heat transfer characteristics and flow visualization during flow boiling of acetone in semi-open multi-microchannels,” Heat Transfer Eng., vol. 40, no. 16, pp. 1349–1362, 2019. DOI: 10.1080/01457632.2018.1470296.