

ABSTRACT
In the present study, we have demonstrated the application of two-step optimization strategy for hexavalent chromium (Cr (VI)) adsorption using Sargassum sp in a packed bed column. ANOVA showed that initial metal concentration has larger impact on sorption efficiency. Application of ANN-GA optimization showed promising results among the models tested. The biosorption efficiency accelerated to 90.79% with Cr (VI) conc = 25 mg L−1, Bed height = 11.97 cm and Flow rate = 5.29 mL min−1. The adsorption mechanism was described using kinetic models where Bed depth service time and Yoon–Nelson model showed a better fit for the experimental data with the correlation coefficient of 0.9.
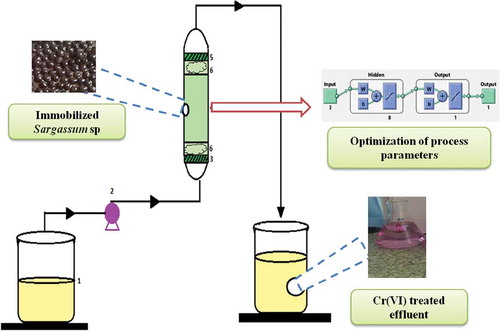
Graphical Abstract
Nomenclature and abbreviations
| A | = | area under the breakthrough curve, cm2 |
| C0 | = | initial/inlet metal ion concentration, mg L−1 |
| Ct | = | effluent metal ion concentration, mg L−1 |
| F | = | flow rate, ml min−1 |
| te | = | bed exhaustion time, min |
| q0 | = | biosorption capacity, mg g−1 |
| qeq | = | equilibrium metal uptake or maximum capacity of the column, mg g−1 |
| mad | = | amount of metal ion adsorbed, mg |
| md | = | amount of metal ion desorbed, mg |
| mtotal | = | total amount of metal ion sent to column, mg |
| M | = | total mass of the biosorbent packed in the column, g |
| Veff | = | total volume treated, mL |
| Z | = | bed depth, cm |
| R | = | removal percentage of Cr (VI) ions, % |
| E | = | desorption percentage of Cr (VI) ions, % |
| K | = | rate constant in BDST model, L mg min−1 |
| N0 | = | biosorption capacity of bed, mg L−1 |
| KTh | = | the Thomas model constant, mL min mg−1 |
| KYN | = | the Yoon–Nelson model rate constant, min−1 |
| τ | = | time required for 50% adsorbate breakthrough, min |
| KAB | = | mass transfer coefficient, L mg min−1 |
| NAB | = | saturation concentration in the Adams–Bohart model, mg L−1 |
| s | = | service time, min |
| u | = | influent linear velocity, cm min−1 |
| v | = | linear flow rate, cm min−1 |
| R2 | = | coefficient of correlation, % |
| = | experimental-specific uptake, mg g−1 | |
| = | calculated-specific uptake, mg g−1 | |
| N | = | number of observations in the experimental isotherm |
| p | = | number of parameters in the regression model |
| = | Response of the predicted model | |
| = | Response of the experimental data | |
| MPSD | = | Marquardt’s percent standard deviation |
| ARE | = | Average Relative Error |
| ANN | = | Artificial neural network |
| ANOVA | = | Analysis of variance |
| DF | = | Degree of freedom |
| DOE | = | Design of experiments |
| OA | = | Orthogonal array |
| OFAT | = | one factor at a time experiment |
| SA | = | Simulated annealing |
| GA | = | Genetic algorithm |
| SS | = | Sum of square |
| MS | = | Mean square |
| SSD | = | Sum of squares of the differences |
| S/N | = | Signal-to-noise |
| SD | = | Standard deviation |
| RMSE | = | Root means square error |
| AARD | = | Absolute average relative deviation |
| wi | = | connection weights, (i=1to n) |
| b | = | bias |
| xi | = | input parameter |
| Ya | = | actual output |
| Yp | = | predicted output |
| N | = | number of data points |
| f | = | objective function (ANN model) |
| x | = | input vector |
| w | = | corresponding weight vector |
| Y | = | Percentage Cr (VI) removal experimental yield |
| X | = | operating conditions |
| P | = | no. of input variables |
| xiL&xiU | = | lower and upper bounds of xi fitness of each candidate solution were evaluated based on following fitness function |
| j | = | fitness value of the candidate solution |
| Ypred | = | MLP model predicted Percentage Cr (VI) removal of given candidate solution. |
| n | = | number of replication |
| Yi | = | response (objective function) |
| Z(T) | = | normalization function |
| kb | = | Boltzmann constant |
| E | = | system energy |
| β | = | system’s sensitivity under a certain control condition |
| σ | = | the variance |
| S | = | the system sensitivity in a dynamic system |
Acknowledgements
The authors gratefully acknowledge the Department of biosciences and bioengineering, IIT Guwahati for providing infrastructure facility to carry out this research. The authors acknowledge Ms. Biju Bharali, Ph.D. student (Department of Biosciences and Bioengineering, IIT Guwahati) for her support in conducting the experiments. The authors also thank Kanchan Hariramani for proof reading this manuscript. The authors also acknowledge Central Instrumentation facility, IIT Guwahati, for rendering their support by providing analytical facility.
Compliance with ethical standards
Ethical statement approval: This article does not contain any studies with human participants or animals performed by any of the authors.
Conflicts of interest: The authors declare that they have no conflict of interest.
Supplemental material
Supplemental data for this article can be accessed here.