
ABSTRACT
This paper explores patterns in participation in adult education and training (AET) by comparing five countries with high participation rates (the Nordic countries and the Netherlands) with three countries with significantly lower participation rates (France, Poland and the Slovak Republic). Using PIAAC data the paper examines differences in the levels of demand for AET as well as variations in barriers to AET participation between the two groups of countries. The demand for AET is higher than the actual participation rate since it includes those who do not participate although they wish to. The demand for AET is substantially higher in countries with high participation rates. Further, the structure and level of barriers is quite similar in the two groups of countries. Countries with low AET participation rate do not have a higher proportion of individuals reporting barriers to AET participation; that they do not participate in AET although they wish to. In both groups of countries demand for AET is strongly associated with the individuals’ educational level. The findings are discussed by drawing on previous studies on drivers of and barriers to participation in AET.
Introduction
With the emergence of the knowledge economy, encouraging participation in adult education and training (AET) throughout life – i.e. lifelong learning – has been the focus of several policy initiatives (see e.g. Fridberg et al., Citation2015; OECD, Citation2012). The importance of lifelong learning is visible in country-specific policies, as well as in general European policy documents. The European Parliament and the European Council have launched a range of initiatives directed at adult learning and according to Špolar and Holford (Citation2014), the European Parliament’s Resolution on Adult Learning: It is Never Too Late to Learn includes a focus on how to improve ‘adult’s motivation to participate in learning’ (Špolar & Holford, Citation2014, p. 43).
Previous research has documented substantial variations in AET participation rates between countries (for recent studies see Dämmerich, Vono de Vilhena, & Reichert, Citation2014; Desjardins, Citation2015). The great variability between countries in AET participation rates suggests that structural and organisational characteristics are important when explaining AET participation. Some studies have pointed to differences in the formal educational system as a driver of differences in participation rates (Bassanini, Booth, Brunello, De Paola, & Leuven, Citation2005; Desjardins, Citation2017). Differences in welfare state regimes (Esping-Andersen, Citation1990) have been used in several studies to explain the observed differences in participation rates (Blossfeld et al Citation2014; Rubenson, Citation2006; Rubenson & Desjardins, Citation2009). For instance, the high participation rates in the Nordic countries is often explained as being a result of the Nordic welfare state regimes, with its emphasis on maximising labour force participation (Esping-Andersen, Citation1990). Encouraging AET participation by reducing structural barriers, such as costs of learning activities (for both employers and employees) is in line with this policy.
However, few previous studies have compared countries with high and low AET participation rates in order to learn more about the factors behind the differences in AET participation rates. In this paper, we explore some of these factors. By comparing how widespread the wish to participate is, i.e. the demand for AET, as well as the barriers to AET participation among those who wish to participate, the aim of this paper is to provide nuances and new knowledge on factors contributing to country variations in AET participation.
There are overlaps between the typology of welfare state regimes and our distinction of countries into two groups with high and low participation rates. Still, our focus is on a comparison of countries with high and low AET participation rates independent of each country’s welfare state regime. The point of departure is exploratory and empirical: we have used the distribution of a country’s AET participation rate as the starting point for exploring barriers to and demand for AET across European countries.
In this paper, we study AET participation in different European countries by using data from the OECD’s Programme for the International Assessment of Adult Competencies – PIAAC. AET participation is here defined as have participated in formal and non-formal education during the last 12 months among employed persons 25–65 years old.
The rest of this paper is organised as follows. In the next section, previous studies on AET participation and barriers are presented. Then follows a presentation of research questions. The fourth section describes data and methods used for the analyses. The fifth section presents the results from the analyses. In the final section, the results are discussed in relation to previous research and the three research questions.
Reasons for AET participation
Previous studies on AET have discussed a number of reasons why people would engage in learning – and why not. A distinction can be made between different reasons for learning, such as personal, social, and job-related reasons for learning. Most adults participate in AET for job-related reasons, but the distinction between job and non-job reasons is not so clear cut (Desjardins, Rubenson, & Milana, Citation2006). For instance, an individual may participate in learning for both job-related and personal reasons.
When discussing why people engage in learning, the concept of motivation for learning is often used. Motivation is a theoretical construct, used to explain behaviour by representing the reasons for our actions, our desires, and our needs (Ryan & Deci, Citation2000). A classic distinction in motivational theory is the division between intrinsic and extrinsic motivation. For example, the individuals’ intrinsic motivation for taking a course or training programme could be to gain more knowledge. Thus, participating in learning is driven by an interest or enjoyment in the task itself and exists within the individual rather than relying on external pressures or a desire for reward. The opposite is extrinsic motivation, through which influences outside the individual are the main sources of motivation (Boggiano & Pittman, Citation1992). Over the years, the validity and distinction between the two categories have been discussed (see for instance Ryan & Deci, Citation2000). For instance, it can be argued that extrinsic motivation varies considerably in its relative autonomy. Thus, it can either reflect external control or true self-regulation (Ryan & Deci, Citation2000). The concepts of motivation and reasons for learning overlap, although they are not similar. Here we will mainly use the concept of reasons for AET participation.
Several scholars have pointed out that those who already have a high level of education are more likely to invest in further education while they are working (Boeren, Citation2016; Børing, Wiborg, & Skule, Citation2013; Desjardins & Rubenson, Citation2011; Desjardins et al., Citation2006). Hence, those who already have high levels of education are more likely to receive more education while those who have low levels of education do not seek further education. This has been described as the Matthew effect of accumulated advantage; participation in AET seems to increase the gap between those with high and low levels of education (Kilpi-Jakonen, Buchholz, Dämmerich, McMullin, & Blossfeld, Citation2014).
Following the strong correlation between the individuals’ level of education and AET participation, we could expect to find that a country’s average educational level is correlated with the country’s share of individuals who participate in AET. Differences in countries’ average educational level could be a factor explaining differences in countries’ AET participation rates.
To try to explain what makes people participate in AET, Cross (Citation1981) developed a ‘chain-of-response’ model (COR), based on the assumption that ‘participation in a learning activity… is not a single act but the result of a chain of responses, each based on an evaluation of the position of the individual’ (Cross, Citation1981, p. 125) within that person’s environment. The model points to the importance of opportunities and barriers, as well as to the goals, which can be seen as different sides of the same thing. The extent to which individuals expect to meet their goals is seen as an additional factor. Hence, Cross (Citation1981) argues that the experiences an individual has with participating in learning activities can create positive or negative circles – reinforcing motivation and interest for learning among those who participate in AET, while those who do not participate remain unmotivated.
Recent studies using PIAAC data (the OECD’s Programme for the International Assessment of Adult Competencies) have studied country variations in AET participation by combining information on participation with information on whether or not the individuals report an interest to participate in AET (Desjardins, Citation2017). This forms four groups of demand for AET:
No demand: Those who have not participated in AET and do not wish to do so
Unmet demand: Those who have not participated in AET but wish to do so
Partially met demand: Those who have participated in AET and wish to participate more
Met demand: Those who have participated in AET and do not wish to participate more
The four groups modelled by Desjardins (Citation2017) illustrates that the demand for AET may vary between countries beyond the actual participation rates, as there are individuals in all countries who wish to participate in AET but do not do so because of barriers. In addition, the groups facing barriers to (more) AET participation may be divided between those who have participated in AET and wish to participate more and those who have not participated in AET but wish to do so (groups 2 and 3). The four groups of demand are therefore useful as a tool to explore patterns of demand and barriers between countries with high and low AET participation rates.
The first group consists of those who have not participated in AET and do not wish to do so. Thus, they are categorised as individuals with no demand for AET. The other three groups have had or still have some form of demand for AET. The fourth group consists of those who have participated in AET and do not wish to participate more. These are therefore categorised as a group with a balance between demand and supply; a met demand for AET. The two groups in the middle consist of those of whom it could be argued experience less balance between the supply of and their demand for AET. One group (2) is formed by those who have not participated in any AET but wish to do so. The second group (3) is formed by those who have participated in AET but wish to participate more. It could be argued that both groups face barriers that prevent them from (more) AET participation. On the other hand, there may be substantial differences between the two groups.
The group consisting of those who have participated in AET but wish to participate more (3) may be considered to be a group, which faces individual and/or structural barriers that hinder the group from developing the skills they need to perform optimally at work (see for instance Massing & Gauly, Citation2017). The label ‘partially met demand’ may indicate an interpretation along this line of reasoning. Alternatively, they could be considered to be a group of individuals, which is highly motivated towards engaging in learning activities and will report an interest in further AET participation even if they already have high skill levels, and further AET may not be crucial for their work performance. In this perspective, their reported interest in more AET may not necessarily be regarded as a barrier. Could it be that some groups would like to participate in AET beyond their (or their employer’s) need for work related skills, if there were no limits? Rather than barriers, could it be that some groups have a general high level of motivation for learning – an unlimited demand? By studying individual and workplace characteristics of this group, the analyses will explore these questions further.
Conceptualisation of barriers to participation in adult education and training
When discussing why people would not engage in learning, the concept of barriers is central. Barriers may be anything that stands in the way of someone taking part in AET. Thus, barriers may include lack of motivation or other forms of emotional barriers, as well as external factors, such as costs, access to information or lack of employers’ support.
Previous research on barriers to AET participation includes classifications of barriers into different sets of groups. A frequently used classification is the distinction between institutional, situational and dispositional barriers to participation (Cross, Citation1981). Institutional barriers are commonly understood as being created by workplace factors or by policy in general, such as a lack of relevant programmes or that programmes are offered at an inconvenient time/place. Situational barriers are understood as obstacles associated with the individual, such as family responsibilities causing time constraints or lack of employers’ support. Dispositional barriers differ from the other two types of barriers as it is not an external barrier, but rather is linked to ‘attitudes and self-perceptions about oneself as a learner’ (Cross, Citation1981, p. 98).
However, how these three types of barriers have been operationalised as items in a survey varies. Cross (Citation1981) pointed out that it is possible to place the same items in different categories, using ‘lack of information’ as an example. In her list, this is categorised as an institutional barrier, but this is only correct if providing information on educational opportunities is seen as a responsibility that lies with the educational institution. It can equally be seen as a situational barrier, if lack of information is linked to individuals living in certain neighbourhoods or working in a particular kind of firm and rarely getting information. Alternatively, it would be a dispositional barrier if we consider that those who have a negative attitude about participating in learning activities are less likely to inform themselves about educational opportunities. Thus, the classification of barriers is not straight forward and has been discussed in a number of previous studies. For instance, in the original overview, Cross (Citation1981) included various forms of cost under situational barriers, while Desjardins et al. (Citation2006), Rubenson (Citation2010) and Roosmaa and Saar (Citation2017) included ‘no money’, ‘fees’ and ‘training too expensive/could not afford it’ under institutional barriers. Others have simply classified all factors related to monetary and non-monetary costs of education to the term ‘costs’, without separating between personal and institutional costs (Gorges, Citation2016).
The PIAAC data set contains seven questions on barriers to further participation in AET, in addition to a general category labelled as ‘other’. In this paper, we study country variations within each barrier, in order to investigate whether differences in barriers have been reported in countries with high and low AET participation rates. In addition, the barriers are categorised as either institutional barriers or situational barriers. In our categorisation of barriers, we have followed the more recent research, which includes cost as one of the institutional barriers (in line with the definition of variables used in Rubenson (Citation2010) and Roosmaa and Saar (Citation2017).
In PIAAC as in most other surveys on AET participation, questions about barriers to participation are only asked of those who have stated that they would like to participate (more) in AET (unmet demand or partially met demand) (see for instance, Gorges, Citation2016). While those who answered that they have no interest in participating in AET have not received any questions about barriers. As noted by previous studies on AET participation, ‘situational and institutional barriers tend to dominate’ when questions about barriers are directed only at those who did not participate but stated that they wanted to participate (Rubenson & Desjardins, Citation2009, p. 191).
Research questions
To investigate the link between demand for participation in AET, barriers to participation in AET and participation rates, we will use the four groups of demand for AET modelled by Desjardins (Citation2017). Three research questions have been formulated. The research questions should be seen in relation with each other as they cover different aspects of the barriers to and drivers of AET participation:
Is there a general higher demand for AET in European countries with high participation rates?
Do we find a similar relationship between the individuals’ education level and demand for AET in the two groups of countries?
Do individuals report more barriers to participation in AET in European countries with low participation rates?
The first research question concerns the interest for AET, examining the extent to which high participation rates are related to high demand for AET. Is the proportion of individuals reporting no interest for AET participation higher in countries with low participation rates?
The second question focus on the association between the individuals’ educational level and demand for AET. Earlier findings have found that individuals with higher education are more likely to wish to invest (more) in AET. Is this relationship the same in countries with high and low participation rates? Or could it be that the individuals’ education level is a less critical factor explaining participation and demand for AET in countries with high participation rates than in countries with low participation rates? All four groups of demand will be included when studying research question 2.
The third question concentrates on barriers to AET participation and the extent to which countries with high and low participation rates differs in that respect. Only those who have reported an interest in (more) AET participation have been asked about barriers to participation. Thus, two groups of demand are included in these analyses; group 2 (unmet demand) and group 3 (partially met demand).
Data and methods
This study uses the data set from the OECD’s Programme for the International Assessment of Adult Competencies – PIAAC, from the first round of the data collection carried out in 2011–2012. As a point of departure, all participating European countries have been included in the analyses. In the analyses of barriers and demand we have used internationally comparable data for eight European countries: Norway, Denmark, Finland, Sweden, the Netherlands, France, Poland and the Slovak Republic. These countries have been chosen because they either scored significantly higher than the average, or significantly lower than the average on the rate of participation in AET in the PIAAC data set (see ).
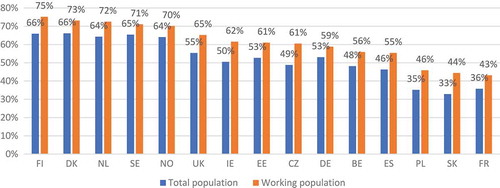
Figure 1. Participation rate in adult education and training (AET) by country. The whole population and working population. European countries1 participating in the 2013 PIAAC survey.
1Country abbreviations: FI= Finland, DK=Denmark, NL= the Netherlands, SE= Sweden, NO= Norway, UK=United Kingdom, IE=Ireland, EE= Estonia, CZ=Czech Republic, DE=Germany, BE=Belgium, ES=Spain, PL= Poland, SK=Slovak Republic, FR= France
The data collected for PIAAC include the working age population (16–65 years), but our sample has been restricted to those who are working and are over 25 years of age. The main reason for this restriction is to exclude youths 16–24 years in initial cycle of studies, as this group could distort the data, and contribute to country differences which are due to differences in educational systems rather than differences in opportunities to undertake AET.
PIAAC is collected as a face-to-face interview, during which interviewees complete a background questionnaire and a test of various skills. The variables used in this analysis all came from the background questionnaire, as the test result data have not been utilised in the analyses. The data have been weighted using the weights provided in the data set (STATA). As the proportion of working adults varies, the sample sizes per country varied from 2867 to 3437. Data from over 25,000 individuals were used in the analyses. However, a slightly lower number was retained in the logistic regression analysis, due to missing values.
The methods used to analyse the data include contingency tables that compare percentages in different groups across countries, and binary logistic regressions. Only statistically significant differences in the tables and graphs are commented on.
Research question 1 is studied by comparing the share of individuals who report that they have participated in AET during last 12 months, and the share who reports that they would like to participate in AET in the two groups of countries.
Research question 2 is studied by comparing the individuals’ educational level across the four groups of demand for AET in countries with high and low participation rates. To study the characteristics of the individuals who report that they have participated in AET and would like to participate more, presents results from a binary logistic regression on the probability of being in the ‘partially met demand’-group in countries with high and low participation rates. In the results from is illustrated by showing the estimated probabilities for being in the ‘partially met demand’ group by central individual and workplace characteristics.
Table 1. Four groups of demand for AET by own educational level in European countries with high and low AET participation rate.
Table 2. Logistic regression on being in the ‘partially met demand’-group. Separate analyses for countries with high and low AET participation rate.
Figure 2. Four types of demand for AET, by country2. Eight countries participating in the 2013 PIAAC survey.
2Country abbreviations: NO= Norway, DK=Denmark, FI= Finland, SE= Sweden, NL= the Netherlands, FR= France, Pl= Poland, SK=Slovak republic
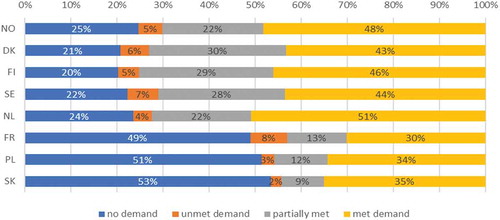
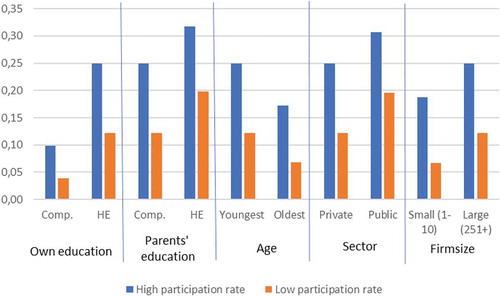
Figure 3. Estimated probability of being in the ‘partially met demand’ group in European countries with high and low participation rate, by various background characteristics. Calculations based on significant coefficients in the regression in .
Research question 3 is studied by comparing the average frequency of barriers to AET participation in European countries with high and low participation rate. This is presented in . presents eight barriers in addition to a ninth category comprising all other barriers. The eight barriers are presented both separately and classified as either institutional or situational barriers.
Table 3. Average frequency of barriers to AET participation in European countries with high and low participation rate.
Binary logistic regression, used in , is a method used when the outcome variable is categorical and estimates the probability of being in the ‘partially met demand’-group, given the values of the explanatory variables. The independent variables used were demographic variables (gender, age), own educational level, parents’ educational level, and workplace-related variables (private or public sector, and firm size, see definitions in and in Appendix ). The individual and workplace characteristics included in the analyses are known from previous studies to be factors that could affect participation in AET (see Desjardins Citation2010; Desjardins, Citation2015).
The frequency distribution of all independent variables included in the analyses is presented in (in the appendix).
Results
Comparing participation rates in adult education and training across European countries
As a starting point for our analyses, we compared participation rates in AET across European countries participating in the 2013 PIAAC survey. displays participation rates in AET, for the whole population and for the working population.
illustrates the variations in AET participation rates in the 15 European countries which participated in the 2013 PIAAC survey. Finland and France are at either end of the distribution with 75% and 43% participation among working adults, respectively. The graph displays a well-known pattern, with four Nordic countries and the Netherlands as the countries with the highest participation rates. Common for these five countries is that they have a participation rate of 70% or more of the working population 25 years or older. They are in the group of countries with a high participation rate. At the other end of the scale, we find three countries with less than 50% participation by those in the working population, and only around 35% participation by the total population. These are Poland, the Slovak Republic and France. They are in the group of countries with a low rate of participation.
illustrates the general tendency in all countries that the AET participation rate is higher in the working population than in the total population. This is not surprising, as the total population includes groups with low interest or lack of opportunities to participate in AET, such as people with long-term sickness or disabilities, and other groups which are outside the labour market, temporarily or permanently. Further, in the population analysed here, persons 16–24 years of age (mainly students in their initial cycle of studies) are excluded. As the dominant reason for participation in AET in many instances is job-related, our analysis has been limited to those who are working.
In the rest of the paper, our analyses are concentrated on eight countries mentioned above: Denmark, Finland, Norway, Sweden, the Netherlands, Poland, the Slovak Republic and France. The first five countries constitute the group of countries with the highest AET participation rates, while the latter three countries constitute the group of countries with the lowest AET participation rates. As mentioned, the analyses only include the working population in each country, to further concentrate the analytical focus. Excluding individuals not in the working population allows to consider the relationship between work place factors and AET participation.
Higher demand for AET in countries with high participation rates?
presents a closer look at variations in demand for AET in the working population in each of the eight countries using the four groups of demand for AET modelled by Desjardins (Citation2017). By combining information on participation in AET with information on the individual’s demand for AET participation, the graph illustrates variations in demand and AET participation between the eight countries. Thus, addresses research question 1: Is there a general higher demand for AET in European countries with high participation rates?
displays the distinct differences between countries with high and low AET participation rates. Obviously, there are several differences between the two groups of countries. Looking at the right end of the figure (yellow bars) we see that in countries with high AET participation rates, about half of the working population had participated in AET during the previous 12 months without wanting to participate more. Thus, according to the four groups of demand, they can be labelled as having ‘met demand’ for AET. The percentage with ‘met demand’ is substantially lower in countries with low participation rates, where they constitute 30–35% of the working population. The differences are statistically significant.
Turning to the left end of the figure, those who do not participate in AET and do not wish to participate (the ‘no demand’ group) make up 20–25% in countries with high participation rates. In countries with low participation rates, about half of the working population is in the ‘no demand’ group.
The third group that differs significantly in size between countries with high and low AET participation rates is the ‘partially met demand’-group – those who have participated in AET but wishes to participate even more. The proportion is 22–30% for countries with high participation rates and only 9–12% for countries with low participation rates.
The fourth and smallest group consists of those who do not participate in AET but wish to do so, the ‘unmet demand’-group. What might be surprising is the lack of difference in group size between countries with high and low AET participation rates. Taking into account the possible higher level of barriers to AET in low participation countries one might expect this group to be larger in this group of countries. Generally, the ‘unmet demand’ group is relatively small in all countries (2–8%). Thus, countries with low AET participation rates are not found to have a high proportion of people reporting barriers which prevent them from taking part in learning activities.
Comparing educational level and demand for AET in countries with high and low participation rates
To further study characteristics of individuals in the different groups of demand, presents the educational level among individuals in each of the four groups of demand in countries with high and low participation rates. Hence, addresses research question 2, which also will be followed up later.
illustrates the substantial differences in educational level between the four groups of demand for AET. A general difference in education level between the two groups of countries is found. In countries with high AET participation rates the share of individuals with higher education is 43%, compared to 33% in countries with low AET participation rates.
In both groups of countries, those who have participated in AET have on average a higher educational level compared to those who have not participated in AET during the last 12 months. This is in line with previous research which has shown that individuals with higher levels of education are more likely to wish to invest in AET (see Desjardins & Rubenson, Citation2011; Desjardins et al., Citation2006, Steffensen, Citation2009).
Interestingly, it is the ‘partially met demand’ group which is found to have the highest average level of education. Around 60% of those in this group have undertaken higher education (58% in low participating countries and 62 in high participating countries) while only 3–7% have compulsory education as their highest completed educational level. Among those who have participated in AET and do not wish to participate more, the ‘met demand’ group, the proportion with higher education is about 45% in both groups of countries.
In the two other demand groups, the average level of education is lower. In the ‘unmet demand’ group, the proportion having undertaken higher education is about 30%, and in the ‘no demand’ group, only about 20% have undertaken higher education. Thus, expressing no interest in participating in AET is matched by low levels of education. illustrates similar patterns between countries with high and low AET participation rates when comparing share with higher education across the four groups of demand.
Another interesting result of is the different composition by education level of the ‘no demand’ category in the two groups of countries. In countries with high AET participation rates, a statistically significant higher proportion of the ‘no demand’ group has the lowest education level (compulsory education) than in the countries with low participation rates (31% and 16%, respectively). In countries with low participation rates, a higher share of the ‘no demand’ group has upper secondary education (65% and 46%, respectively). This could indicate that the demand for AET is more driven by education level in the low-participation countries than in the high-participation countries.
indicates that the two groups of individuals that report a wish to participate (more) in AET, the ‘partially met demand’ group, and the ‘unmet demand’ group may have quite different characteristics. The ‘partially met demand’ group is revealed to have a statistically significant higher average level of education than any of the other groups of demand, both in the group of countries with high and low participation rates.
Characteristics of the ‘partly met demand’-group in countries with high and low participation rates
To study in more detail the characteristics of the ‘partially met demand’ group – i.e. those who report an interest to participate even more in AET than they already have, presents the results from a multivariate analysis on the probability of being in the ‘partially met demand’ group compared to being in the other groups of demand. The analytical models are run separately for countries with high and low participation rates.
displays the results from a logistic regression model including individual characteristics (gender, age, educational level and parents’ educational level) and work place characteristics (sector and firm size). By controlling for central individual and workplace characteristics, the aim is to learn more of the factors recognising the ‘partially met demand’ group in countries with high and low participation rates. Significant effects are marked in bold.
The analyses presented in reveal some of the individual and workplace characteristics of the ‘partially met demand’ group in countries with high and low participation rates. In both groups of countries, the ‘partially met demand’ group is characterised as being relatively young individuals with a high level of education (as shown in ). Older individuals are less likely to state that they have a partially met demand compared to those aged 34 or younger. Working in the public sector or in a larger firm increases the likelihood of stating that they would be interested in more AET, even though they already have participated in AET. Having parents with a higher level of education increases the probability of being in the ‘partially unmet demand’ group both in countries with high and low participation rates.
The only clear difference between the two groups of countries is the effect of gender in . In countries with high participation rates women are more likely than men to state that they have a ‘partially unmet demand’, while there is no gender difference in countries with a low participation rate. However, the effect of gender is small. When calculated as the probability of being in the group stating ‘partially met demand’ the estimated probability for men in high participation countries is 0.25, while the corresponding probability for women is 0.28.
All the independent variables related to educational background or workplace characteristics prove to be significant, both for countries with high and low participation rates. Even though the importance of the different variables varies between the two groups of countries, the general pattern is similar: The most substantial variable which increases the probability of a person having ‘partially met demand’ is their own educational level.
illustrates the differences in probabilities of being in the ‘partially met demand’ group in countries with high and low participation rates. The calculated probabilities presented in are based on the model in .
illustrates how different individual and workplace characteristics affect the probability of being in the ‘partially met demand’ group (all probabilities are calculated on statistically significant results in the regression). The pattern is similar in countries with high and low participation rates. Looking at the columns to the left the estimated probabilities of being in the ‘partially met demand’ group is higher among those who have undertaken higher education compared to those who have compulsory education as their highest educational level. While the estimated probability increases from 10% to 25% in countries with high participation rates, the probability increases from about 4% to 12% in countries with low participation rates.
Similarly, based on the results in the probabilities of being in the ‘partially met demand’ group are higher among those who have a high social background measured as parents’ level of education. The estimated probability increases from about 25% to 32% in countries with high participation rates, and from about 12% to 20% in countries with low participation rates. Furthermore, illustrates the higher probability of being in the ‘partially met demand’ group among the youngest compared to the oldest age groups, those occupied in the public sector compared to the private sector, and among those working in large firms compared to small firms. However, the variable which has the strongest separate effect is one’s own educational level – those who have undertaken higher education are much more likely than their less educated counterparts to have an interest in participating more in AET than they already have.
Barriers to AET participation
Having studied demand for AET, the role of educational level, as well as other individual and workplace characteristics in countries with high and low participation rates, we now turn to the topic of barriers. In PIAAC, all those who would like to participate in AET but have not been able to do so, and those who have participated in AET but would like to participate more, have been asked to report on the barriers to not participating (or to participate more). Thus, the requirement for receiving the questions on barriers to AET participation is to have reported interest in participation. A total of seven barriers are addressed in the PIAAC questionnaire, in addition to an eighth group consisting of ‘other barriers’.
presents the frequency of each barrier in each of the five countries having a high AET participation rate and the three countries having a low AET participation rate. The table also shows the average frequency of each barrier in the two groups of countries. In addition, the barriers are categorised as either institutional or situational, following earlier research (Cross, Citation1981, Desjardins et al., Citation2006, Rubenson, Citation2010). Dispositional barriers are left out of the analyses as there are no items measuring directly that type of barrier. Relating to the research questions, the table addresses the third research question: Do individuals report more barriers to participation in AET in European countries with low participation rates?
reveals substantial variations between the scopes of the different barriers. While some barriers are reported by more than a third of respondents in some countries, other barriers are only reported by a small group. The barrier reported by the highest proportion in most countries is ‘I was too busy at work’. In the Slovak Republic this is reported to be a barrier by 38%, followed by Norway where 36% report this to be a barrier. Poland is the country where the proportion reporting this as a barrier is lowest, 18%. However, in Poland the proportion reporting costs as a barrier to participation is higher compared to the other countries, 21% compared to 9% on average in the high participation countries.
Although there are variations in the frequencies of reported barriers and some country differences, indicates a pattern of similarities across the two groups of countries. The pattern of barriers at play in high participation countries does not seem to differ much from the pattern in low participation countries. The differences in averages of the three main types of barriers between the two groups of countries are not statistically significant.
When summarising the proportions reporting institutional barriers to participation in each country, the differences vary from 19% in Norway to 38% in Poland. Still, the average for the two groups of countries is almost the same. The proportion of reported institutional barriers is 24% in countries with high AET participation rates, while the corresponding percentage for countries with low participation rates is 26. Thus, except for Poland, the proportion reporting institutional barriers to AET participation seems to be rather modest both in countries with high and low participation rates.
Turning from institutional to situational barriers, the proportion reporting these types of barriers are generally higher in both groups of countries. Among the countries with high participation rates, there is not much variation in the occurrence of different situational barriers, with a few exceptions. In Denmark the proportion reporting barriers due to child care and family responsibilities is only 5%, lower than in the other countries (9–13%), while lack of employers’ support is higher in Denmark compared to the other countries with high participation rates, 18 compared to 10–13%.
Among the countries with low participation rates there are somewhat more variations. A significantly higher rate of respondents in France reported ‘lack of employer support’ as a barrier compared to the other two countries in this group.
As already mentioned, ‘I was too busy at work’ is the barrier reported by the highest proportion in most countries. Still, the proportion varies from 18% in Poland, 28% in France and 38% in the Slovak Republic.
There are only minor variations in the proportion stating ‘other barriers’: on average, 17% in both groups of countries report barriers other than those specified.
Overall, the patterns of reported institutional and situational barriers seem to be rather similar across countries, irrespective of their total AET participation rates. The ranked importance of the items is the same in the two groups of countries, although there are minor variations in their magnitude. For instance, reporting ‘too busy at work’ as a barrier to participation is on average of less importance to respondents in low participation countries compared to respondents from high participation countries. The barrier ‘lack of employer support’ seems to be more important in low participation countries than in high participation countries. For institutional barriers, the pattern is a little different, as the cost of education seems to be the dominant factor in countries with low participation rates while inconvenient scheduling is found to be more important as an institutional barrier in high participation countries.
Discussion
In this paper, we have taken an empirical point of departure by comparing differences in demand for adult training, i.e. the wish to participate in training or participate more, as well as barriers to AET participation among those who wish to participate, in countries with high and low participation rates. To investigate the link between demand for participation in AET, barriers to participation in AET and participation rates, we have used the four groups of demand for AET modelled by Desjardins (Citation2017). The aim has been to use this angle to explore and highlight some of the factors behind the country differences in AET participation.
Four Nordic countries and the Netherlands have formed the group of countries with high participation rates, while Poland, the Slovak Republic and France have formed the group of countries with low AET participation rates.
The analyses show substantial variations between the two groups of countries in the demand for AET. Countries with high AET participation rates have a higher proportion of individuals who have participated in AET and do not wish to participate more (the ‘met demand’ group). In addition, the proportion of individual who have participated in AET and wish to participate more (the ‘partially met demand’ group) is significantly larger in this group of countries. The ‘partially met demand’ group is on average twice as large in countries with high AET participation rates compared with countries with low AET participation rates, 26% and 11%, respectively. Thus, the findings suggest a positive answer to research question 1. We find a general higher demand for AET in European countries with high participation rates. Further, the ‘no demand’ group, i.e. those who do not wish to participate, is considerably larger in the low-participating countries than in the other group of countries.
The findings also suggest a mostly positive answer to research question 2. Overall, we find a similar relationship between the individuals’ education level and demand for AET in the two group of countries. In both countries with high and low participation rates individuals who have participated in AET are recognised with a higher educational level compared to those who have not participated. In addition, those who have participated in AET and wish to participate more (partially met demand) are found to have a particularly high average level of education, significantly higher than the other groups. In this group, about 60% have completed higher education. In contrast, only about 20% have completed higher education in the group of individuals that have not participated in AET and have not reported any interest in AET (the ‘no demand’ group).
The findings could indicate that the ‘partially met demand’ group is not necessarily a group facing barriers hindering them from further AET participation. Both individual and work place characteristics of this group indicate that it consists of individuals who have above average opportunities for AET participation. More often than individuals in the other groups, they are employed in the public sector and in large firms; parts of the labour market that have higher proportions of employees who participate in AET compared to the private sector and smaller firms. Using the concepts of Cross (Citation1981), their experiences with participating in learning activities may have created positive circles and have reinforced their motivation for AET participation. The visibility of many training opportunities in the ‘high-participating countries’ is probably the reason why the ‘partially met demand’ group is relatively large in these countries. Thus, instead of classifying this group as having ‘partly met demand’, and alternative classification of this group could be ‘infinite demand’.
Although the relationship between the individuals’ education level and demand for AET in the two group of countries are found to be generally similar, some variations are found. In countries with high AET participation rates, a substantially higher proportion of the ‘no demand’ group has a low education level than in countries with low participation rates. This could indicate that the demand for AET is more driven by education level in the low-participation countries than in the high-participation countries.
The analyses of barriers to participation in AET show a similar pattern between countries with high and low AET participation rates. On average, the proportion reporting barriers to AET participation is not higher in countries with low AET participation rates compared to countries with high participation rates. Furthermore, the groups reporting that they have not participated in AET although they would like to (the ‘unmet demand’ group) are not larger in countries with low AET participation rates, rather this group is small in both groups of countries. These findings suggest a negative answer to research question 3 that individuals in countries with low participation rates face higher barriers to AET participation compared with individuals in countries with high participation rates. Thus, contrary to what we could have expected there does not seem to be a higher share of individuals reporting barriers to AET participation in countries with low participation rates.
Still, some exceptions are found. In Poland the proportion reporting costs as a barrier to participation is higher compared to the other countries. This might be linked to the rapid rise of private higher education in Poland from the early 1990s (Duczmal, Citation2006; Kweik, Citation2013). The low proportion reporting costs as a barrier is probably also partly due to a high degree of ‘free-of-charge’ or low-cost offerings of continuing education in the Nordic countries. In these countries, there has been a long tradition of programmes of this type being offered (Rubenson, Citation2006).
In addition, it could be argued that (some of) those who have not participated in AET and report no interest in participation, are in fact facing dispositional barriers. As previously discussed, dispositional barriers are difficult to measure as they are linked to ‘attitudes and self-perceptions about oneself as a learner’ (Cross, Citation1981, p. 98). Since only those who reported an interest in more participation in AET received the questions about barriers, it could be argued that some individuals who face barriers to participation are not revealed by the PIAAC data. The large proportion of individuals reporting no demand for AET in the low participation countries may imply higher dispositional barriers to participation in this group of countries, but also that fewer training opportunities are actually perceptible. In other words, instead of being in a positive learning circle caused by participating in learning activities, it could be argued that they are in a negative circle – not gaining new skills or knowledge and remaining uninterested in participating in learning activities.
Our findings seem to demonstrate a difference in the general interest for AET in countries with high and low participation rates. Countries where structural barriers are low and general participation high seems to be recognised with a more positive climate towards AET participation. These are mainly formed by the Nordic countries which can be recognised by their welfare state regimes. These findings are in line with previous studies which have found AET participation to be being closely linked to structural factors, including features of the work place, the labour market and/or country-specific policies (Cross, Citation1981; Desjardins & Rubenson, Citation2013; Rubenson, Citation2006).
The findings display that the differences between countries with high and low AET participation rates is more evident when comparing the scope of demand for AET, and different forms of demand, than when comparing barriers to participation. However, a considerable difference between the two groups of countries is the proportion which reports no interest in AET. This points to the relationship between barriers and demand. While countries with high AET participation are generally recognised as having high demand and low barriers to AET participation, countries with low participation rates as recognised by their low demand which may be seen as an outcome of less attention being paid to AET and fewer opportunities to participate in AET in these countries.
As a paradox, the association between individuals’ educational level and AET participation seems to be strong also in countries with high participation rates. Thus, even in countries with high AET participation rates, where the structural barriers are low, the challenge seems to be to increase the interest in AET among those who have not (yet) participated in AET and who are not part of the ‘positive learning circle’ (Cross, Citation1981). These are groups recognised by low levels of education and fewer work place opportunities for AET. Nevertheless, these groups of individuals might experience major benefits from participating in AET. The analyses in this paper suggest that reducing barriers do not necessarily increase demand for AET among all groups. Increasing the interest for AET among individuals with low levels of education is a major challenge both in countries with high and low participation rates.
Acknowledgments
This work was funded by a grant from the Norwegian Research Council - Barriers and drivers regarding adult education, skills acquisition and innovative activity (BRAIN project, number 228258). The discussions among BRAIN project members at the project’s workshops are gratefully acknowledged, particularly comments from project leader Liv Anne Støren, professor Rolf van der Velden (Research Centre for Education and the Labour Market (ROA) at Maastricht University) and professor Richard Desjardins (Department of Education, UCLA), as well as valuable comments from participants at ECER Dublin (2017) where a first draft of this paper was presented.
Disclosure statement
No potential conflict of interest was reported by the authors.
Additional information
Funding
Notes on contributors
Elisabeth Hovdhaugen
Elisabeth Hovdhaugen, Ph.D, is a Senior Researcher at NIFU. The topic of her thesis was dropout in higher education, and her main expertise is related to students in higher education, though she has also worked topics such as upper secondary education and mature students. She was national project leader for Norway's participation in the OECD project 'AHELO'.
Vibeke Opheim
Vibeke Opheim, Ph.D. is deputy director at NIFU (Nordic institute for Studies in Innovation, Research and Education). With a background in sociology, her research areas include equity in education, education policy, and students’ learning outcome. In 2009-2010 she was the NPM for Norway in PIAAC. She is currently the national project manager for Norway in the International OECD survey on ECEC staff and managers (TALIS Starting Strong Survey 2018).
References
- Bassanini, A., Booth, A., Brunello, G., De Paola, M., & Leuven, E. (2005, June). Workplace training in Europe (IZA Discussion paper nr. 1640). Bonn: Institute for the Study of Labor (IZA).
- Blossfeld, H.-P., Kilpi-Jakonen, E., Vono de Vilhena, D., & Buchholz, S. (2014). Adult learning in modern societies. An international comparison from a life-course perspective. Cheltenham, UK: Edward Elgar.
- Boeren, E. (2016). Lifelong learning participation in a changing policy context. London: Palgrave Macmillan.
- Boggiano, A. K., & Pittman, T. S. (Eds.). (1992). Cambridge studies in social and emotional development. Achievement and motivation: A social-developmental perspective. New York, NY: Cambridge University Press.
- Børing, P., Wiborg, Ø., & Skule, S. (2013): Livslang læring og mobilitet i arbeidsmarkedet: En studie av formell og uformell videreutdanning blant norske arbeidstakere basert på lærevilkårsmonitoren og registerdata [Lifelong learning and mobility in the labour market] (Report 8/2013). Oslo: NIFU.
- Cross, K. P. (1981). Adults as learners: Increasing participation and facilitating learning. San Francisco: Jossey-Bass.
- Dämmerich, J., Vono de Vilhena, D., & Reichert, E. (2014). Participation in adult learning in Europe: The impact of country-level and individual characteristics. In H.-P. Blossfeld, E. Kilpi-Jakonen, D. Vono de Vilhena, & S. Buchholz: (Eds.), Adult learning in modern societies. An international comparison from a life-course perspective(pp. 29-55). Cheltenham, UK: Edward Elgar.
- Desjardins, R. (2010). Participation in adult learning. International Encyclopedia of Education, 1, 240-250. doi:10.1016/B978-0-08-044894-7.00037-3
- Desjardins, R. (2015): Participation in adult education opportunities: Evidence from PIAAC and policy trends in selected countries Background paper for the education for all global monitoring report 2015. Paris: UNESCO. Retrieved from http://unesdoc.unesco.org/images/0023/002323/232396e.pdf
- Desjardins, R. (2017). The political economy of adult learning systems. Alternative strategies, policies and the coordination of constraints. London: Bloomsbury Academic.
- Desjardins, R., & Rubenson, K. (2011): An analysis of skill mismatch using direct measures of skills (OECD Education Working Papers, 63). Paris: OECD Publishing.
- Desjardins, R., & Rubenson, K. (2013). Participation patterns in adult education: The role of institutions and public policy frameworks in resolving coordination problems. European Journal of Education, 48(2), 262–280.
- Desjardins, R., Rubenson, K., & Milana, M. (2006). Unequal chances to participate in adult learning: International perspectives. Paris: UNESCO.
- Duczmal, W. (2006). The rise of private higher education in Poland. Policies, markets and strategies (PhD thesis). University of Twente, Enschede.
- Esping-Andersen, G. (1990). The three welfare states of capitalism. Cambridge: Cambridge Polity Press.
- Fridberg, T., Rosdahl, A., Halapuu, V., Valk, V. A., Malin, A., Hämäläinen, R., … Mellander, E. (2015): Adult skills in the Nordic region: Key information-processing skills among adults in the Nordic region (TemaNord 2015: 535). Copenhagen: Nordic Councils of Ministers.
- Gorges, J. (2016). Why adults learn: Interpreting adults’ reasons to participate in education in terms of Eccles’ subjective task value. International Online Journal of Education and Teaching (IOJET), 3(1), 26–41.
- Kilpi-Jakonen, E., Buchholz, S., Dämmerich, J., McMullin, P., & Blossfeld, H.-P. (2014). Adult learning, labor market outcomes and social inequalities in modern societies. In H.-P. Blossfeld, E. Kilpi-Jakonen, D. Vono de Vilhena, & S. Buchholz (Eds.), Adult learning in modern societies. An international comparison from a life-course perspective(pp. 3-28). Cheltenham, UK: Edward Elgar.
- Kweik, M. (2013). From system expansion to system contraction: Access to higher education in Poland. Comparative Education Review, 57(3), 533–576.
- Massing, N., & Gauly, B. (2017). Training participation and gender: Analyzing individual barriers across different welfare state regimes. Adult Education Quarterly, 67(4), 266–285.
- OECD. (2012). Lifelong learning and adults. In Education today 2013: The OECD perspective. Paris: Author. doi:10.1787/edu_today-2013-9-en
- Roosmaa, E.-L., & Saar, E. (2017). Adults who do not want to participate in learning: A cross-national European analysis of their perceived barriers. International Journal of Lifelong Education, 36(3), 254–277.
- Rubenson, K. (2006). The Nordic model of lifelong learning. Compare: A Journal of Comparative and International Education, 36(3), 327–341.
- Rubenson, K. (2010). Adult education overview. In P. Peterson, E. Baker, & B. McGaw (Eds.), International encyclopaedia of education(pp. 1-11). Oxford: Elsevier.
- Rubenson, K., & Desjardins, R. (2009). The impact of welfare state regimes on barriers to participation in adult education. A bounded agency model. Adult Education Quarterly, 59(3), 187–207.
- Ryan, R. M., & Deci, E. L. (2000). Intrinsic and extrinsic motivations: Classic definitions and new directions. Contemporary Educational Psychology, 25(1), 54–67.
- Špolar, V. A. M., & Holford, J. (2014). Adult learning: From the margins to the mainstream. In M. Milana & J.Holford (Eds.), Adult education policy and the European Union. Theoretical and methodological perspectives(pp. 35-50). Rotterdam: Sense Publishers.
- Steffensen, K. (2009). Deltagelsesmønstre i voksnes læring i Norge og andre europeiske land [Participation patterns in adult learning in Norway and other European countries] (In Statistics Norway: Utdanning 2009 – læringsutbytte og kompetanse). Oslo-Kongsvinger: Statistics Norway.